GCSE Tutoring Programme
Our chosen students improved 1.19 of a grade on average - 0.45 more than those who didn't have the tutoring.
In order to access this I need to be confident with:
Square numbers and square roots Cube numbers and cube roots Factors, multiples and primes 2D shapes 3D shapes Decimals Negative numbersThis topic is relevant for:

Constructing Venn Diagrams
Here we will learn about constructing Venn diagrams, including how to draw two set and three set Venn diagrams, correctly placing items in the correct subset of a Venn diagram, and using limited information to complete a Venn diagram.
There are also Venn diagram worksheets based on Edexcel, AQA and OCR exam questions, along with further guidance on where to go next if you’re still stuck.
What is constructing Venn diagrams?
Constructing Venn diagrams is an essential skill within set theory. Venn diagrams allow us to visualise individual items or frequencies of items within different subsets.
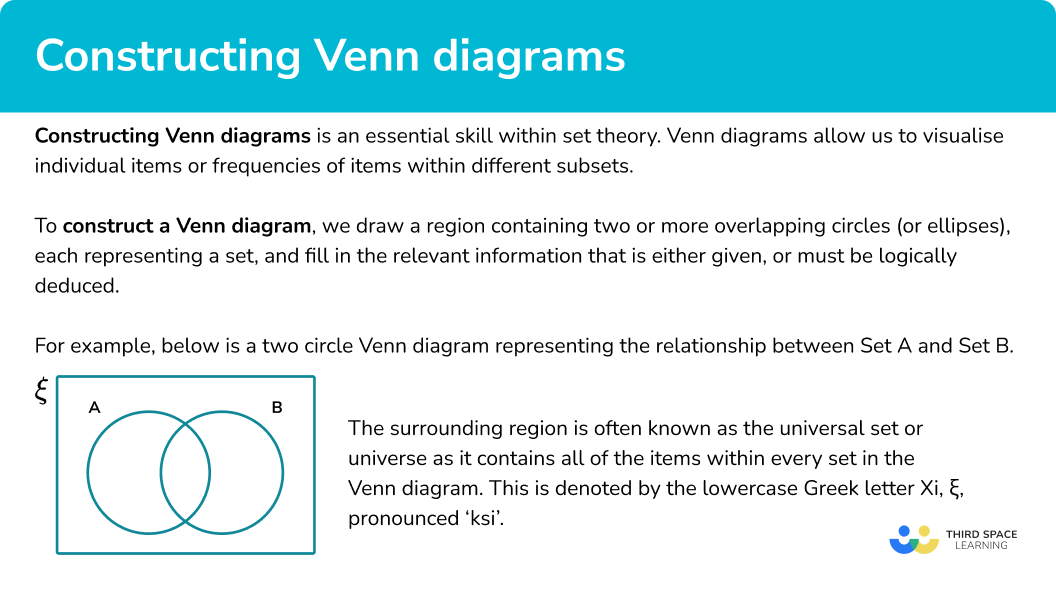
To construct a Venn diagram we draw a region containing two or more overlapping circles (or ellipses), each representing a set, and fill in the relevant information that is either given, or must be logically deduced.
E.g.
Below is a two circle Venn diagram representing the relationship between set A and set B.
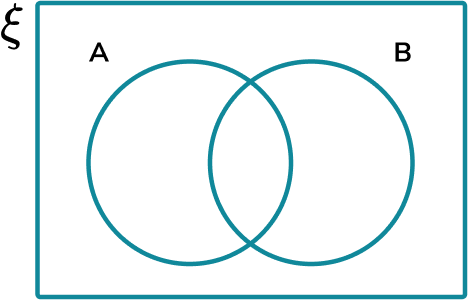
The surrounding region is often known as the universal set or universe as it contains all of the items within every set in the Venn diagram. This is denoted by the lowercase Greek letter Xi, \bf{\xi} , pronounced ‘ksi’.
A Venn diagram can contain a large number of sets however we will only consider a two set or a three set diagram.
What is constructing Venn diagrams?
How to construct a Venn diagram
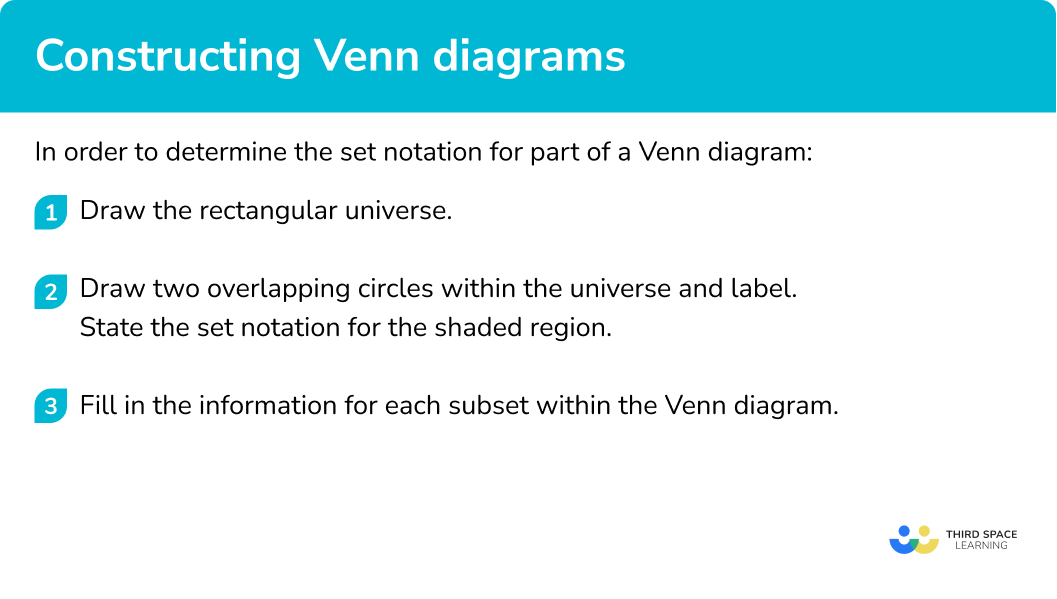
In order to construct a Venn diagram:
- Draw the rectangular universe.
- Draw two overlapping circles within the universe and label.
- Fill in the information for each subset within the Venn diagram.
Explain how to construct a Venn diagram

Venn diagrams worksheet (includes constructing Venn diagrams)

Get your free constructing Venn diagrams worksheet of 20+ Venn diagram questions and answers. Includes reasoning and applied questions.
DOWNLOAD FREE
Venn diagrams worksheet (includes constructing Venn diagrams)

Get your free constructing Venn diagrams worksheet of 20+ Venn diagram questions and answers. Includes reasoning and applied questions.
DOWNLOAD FREERelated lessons on Venn diagram symbols
Constructing Venn diagram is part of our series of lessons to support revision on how to calculate probability. You may find it helpful to start with the main Venn diagram lesson for a summary of what to expect, or use the step by step guides below for further detail on individual topics. Other lessons in this series include:
Constructing Venn diagrams examples
Example 1: types of number
The universal set \xi contains the numbers from 1 to 30 . Draw a Venn diagram to represent the information from the two sets:
- First 10 prime numbers, A=\{2, 3, 5, 7, 11, 13, 17, 19, 23, 29\}
- Factors of 30, B=\{1, 2, 3, 5, 6, 10, 15, 30\}
- Draw the rectangular universe.

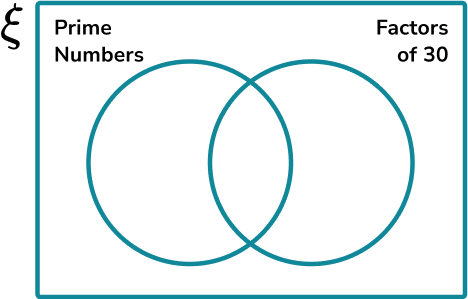
2Draw two overlapping circles within the universe and label.
Here, set A contains the first 10 prime numbers and set B contains the factors of 30 . We label the two circles ‘Prime Numbers’ and ‘Factors of 30 ’.
3Fill in the information for each subset within the Venn diagram.
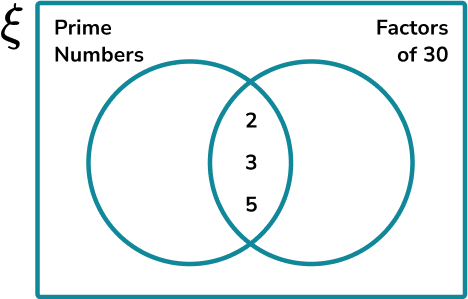
2, 3, and 5 occur in both sets and so they are written in the intersection of the two sets.
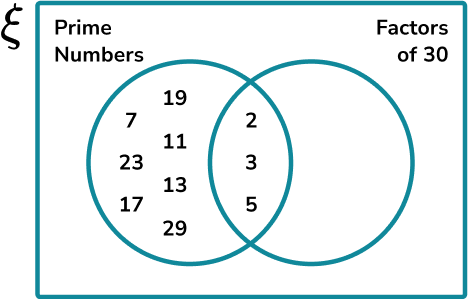
17, 11, 13, 17, 19, 23 and 29 are prime numbers but they are not factors of 30 and so they go in the left crescent of the prime number set (‘just prime’).
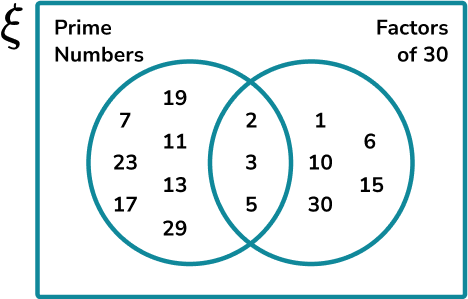
1, 6, 10, 15 and 30 are factors of 30 but not prime numbers so they go in the right crescent of the factors of 30 set (‘just factors of 30 ’).
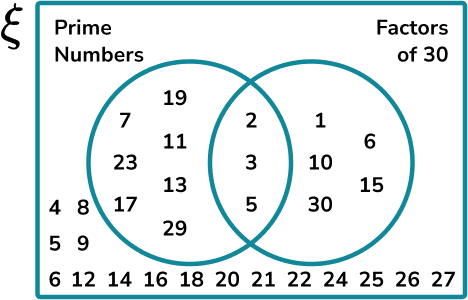
The remaining numbers are not prime or factors of 30 , so they are written in the outer region of the Venn diagram, but still within the universal set.
This gives us the final solution:
Example 2: 2D shapes
Below is a group of coloured 2D shapes.
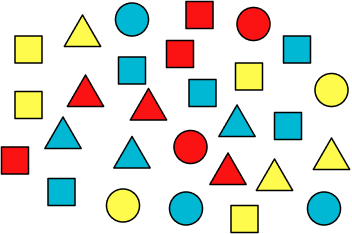
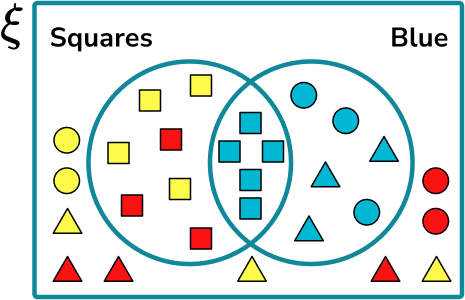
Place the following shapes into a Venn diagram categorised into the two sets:
- A={Squares}
- B={Blue}

Here we have the two sets ‘Square’ and ‘Blue’.
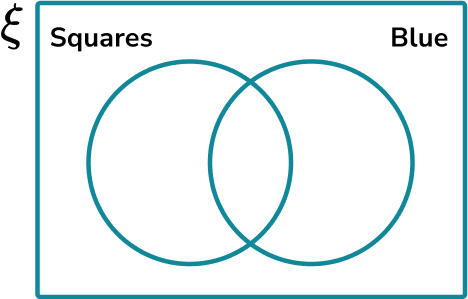
Placing each shape into the correct part of the Venn diagram one at a time, we have the solution:
Example 3: animals
Below is a list of animals with their single and plural names.
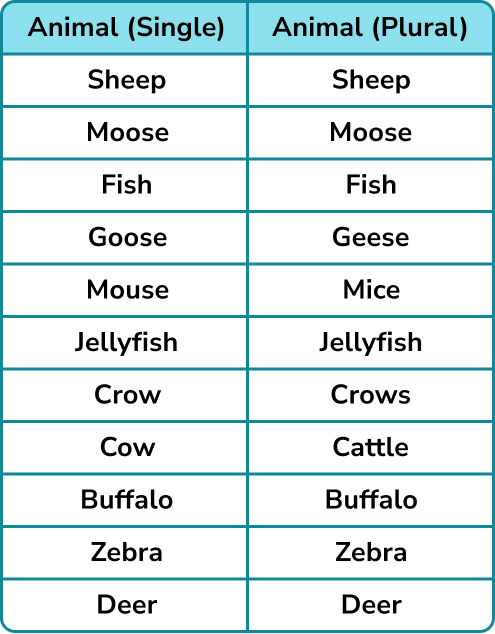
Complete the Venn diagram to show the two sets:
- A={Animals where their singular name is the same as their plural name}
- B={Animals with 4 legs}

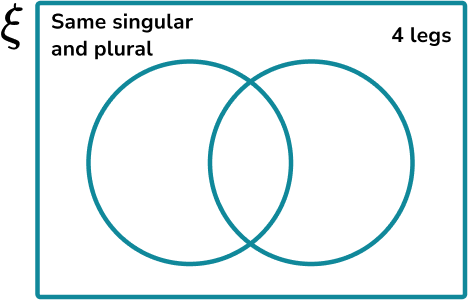
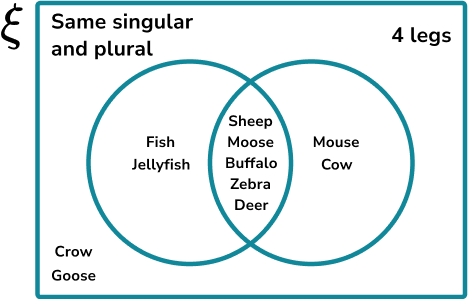
The following animals have the same singular and plural name and have 4 legs {sheep, moose, buffalo, zebra, deer} so they are placed in the intersection of the two sets.
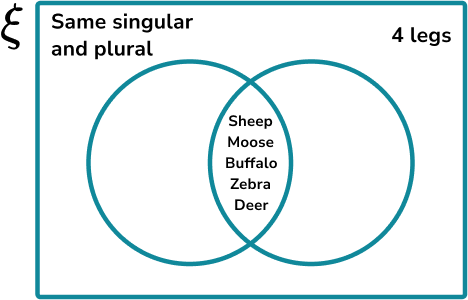
The following animals have the same singular and plural name but do not have 4 legs {jellyfish, fish} so they are written into the left crescent.
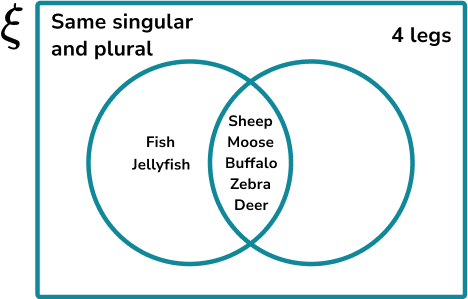
The following animals do not have the same singular and plural name but they do have 4 legs {mouse, cow} so they go in the right crescent.
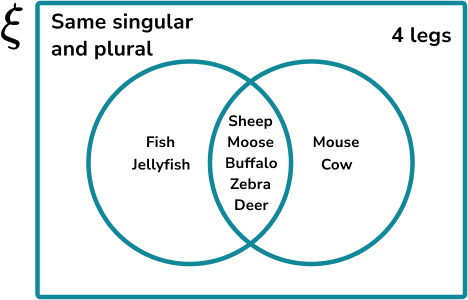
The remaining animals that do not have the same singular and plural name and do not have 4 legs are {goose, crow} so these go in the outer region of the universal set.
Example 4: 3D polyhedra
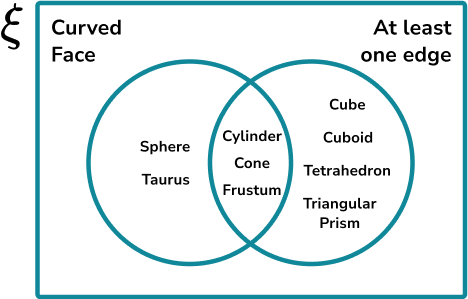
Place the following shapes into a Venn diagram categorised into the two sets:
- A={Curved face}
- B={At least one edge}

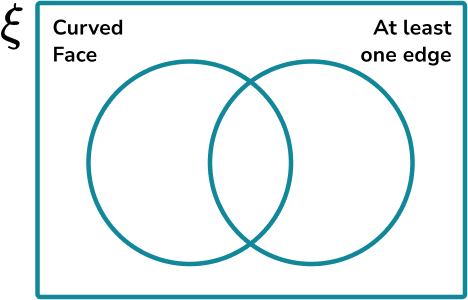
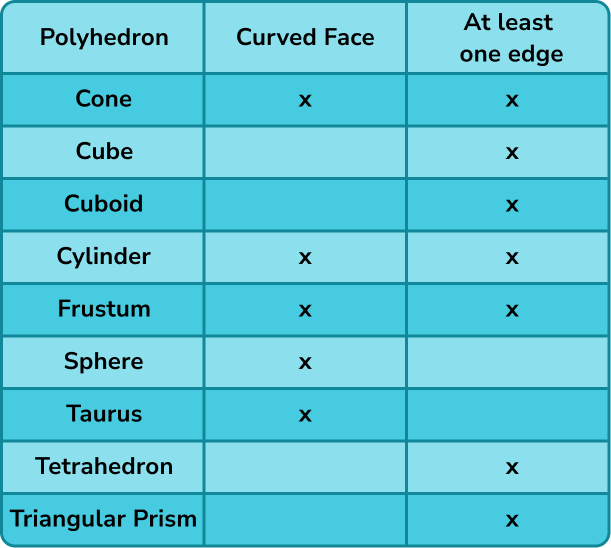
Using a table, we can check next to each shape whether they have the property or not. We can then place them into the Venn diagram with ease.
Solution:
Example 5: elements of the periodic table
A list of elements of the periodic table is given below, along with their atomic number, symbol and group.
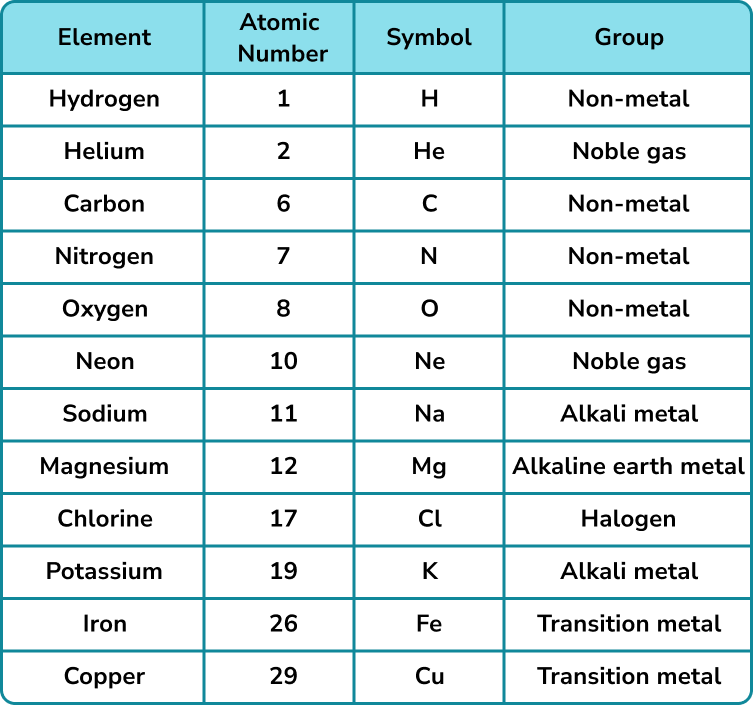
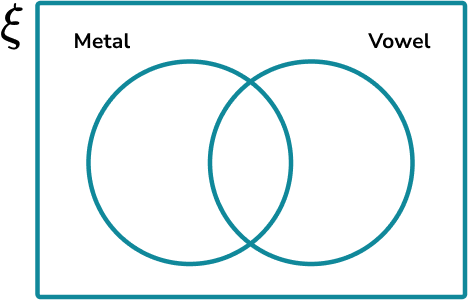
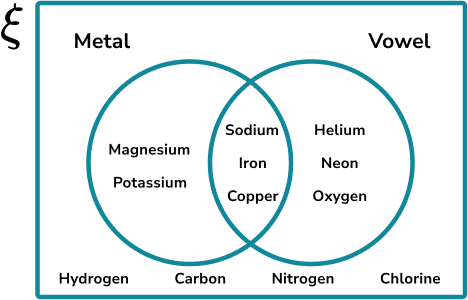
Use the list to construct a Venn diagram showing the frequencies of elements in the two sets:
- A={Metals}
- B={Symbol contains a vowel}

Example 6: sequences
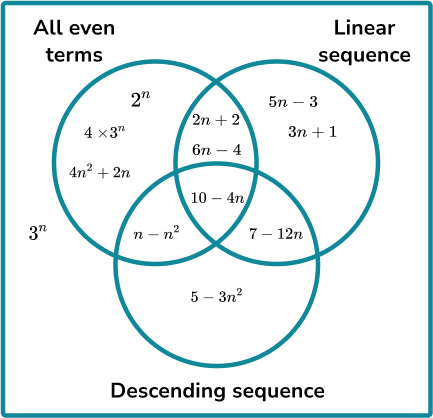
Below is the nth term for 12 different sequences along with the first 5 terms.
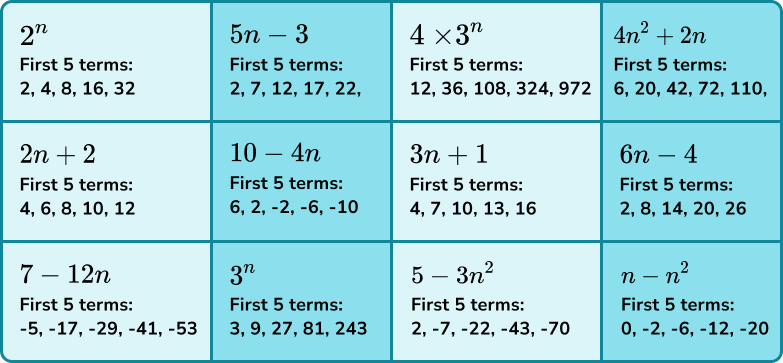
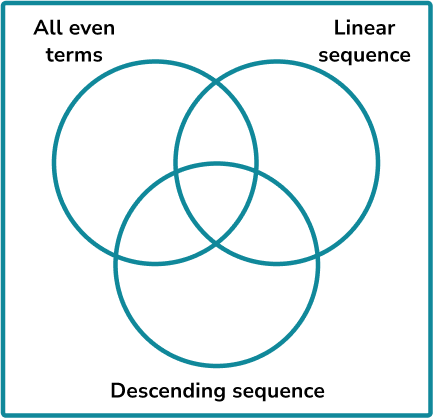
Construct a three circle Venn diagram categorised into the three sets:
- A={All terms are even}
- B={Linear sequence}
- C={Descending sequence}

Here we have a three set Venn diagram and so we must draw three overlapping circles and label them accordingly.
Common misconceptions
- Placing every item in a set in the intersection
The intersection is the overlap between two sets. If the item is only in set A and not set B, it must go in the subset that is just A, and not the intersection.
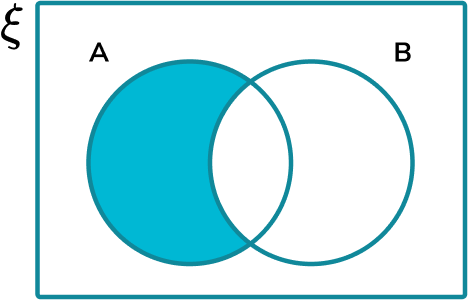
(This is the section A \cap B’ pronounced A and not B, or, just A)
Step-by-step guide: Venn diagram symbols
- Missing values
Make sure that every value within all of the sets is written into the Venn diagram.
- No universal set
The universal set contains all of the items within every set given. If an item does not go in either circle, the item is written in the outer region, still within the rectangular universe.
- The empty set
It is possible that a set contains no items, or the empty set. The frequency should therefore be written as 0 , and not left blank.
- Sets incorrectly labelled
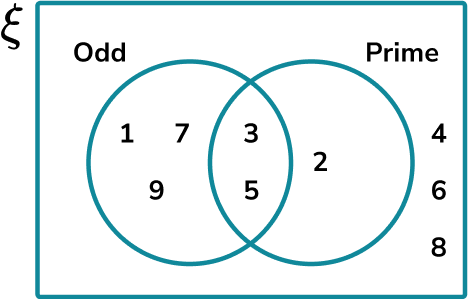
Take for example the following two sets:
– Odd numbers less than 10
– Prime numbers less than 10
The Venn diagram is drawn so that the two sets are given as:
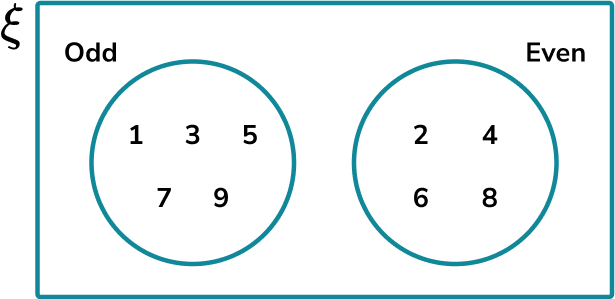
Whereas the Venn diagram should look like this:
Practice constructing Venn diagrams questions
1. Here is a list of 2D polygons.
| Square | Circle | Equilateral triangle | Regular pentagon |
| Trapezium | Hexagon | Ellipse | Parallelogram |
| Regular octagon | Isosceles triangle | Kite | Rectangle |
Using this list, select the correct venn diagram that represents the following two sets:
- A={Rotational symmetry}
- B={ 4 or more vertices}
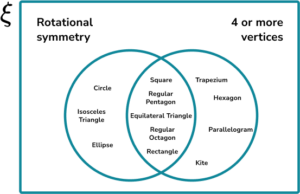

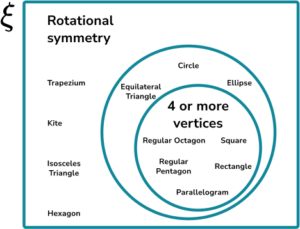


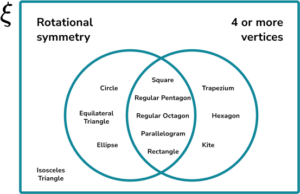

- The 2D polygons that have a rotational symmetry and 4 or more vertices are {square, regular pentagon, regular octagon, parallelogram, rectangle}. These are written in the intersection of the two circles.
- The 2D polygons that have a rotational symmetry but fewer than 4 vertices are {circle, equilateral triangle, ellipse}. These are written in the left crescent of set A.
- The 2D polygons that do not have a rotational symmetry but have 4 or more vertices are {trapezium, hexagon, kite}. These are written in the right crescent of set B.
- The 2D polygons that do not have a rotational symmetry or 4 or more vertices are {isosceles triangle}. These are written in the outside region.
2. Freddie writes down all of the integers from 1-24 . Place the integers into the Venn diagram with the following sets:
- A={Factors of 24 }
- B={Square numbers}
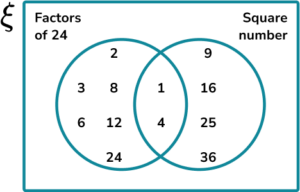

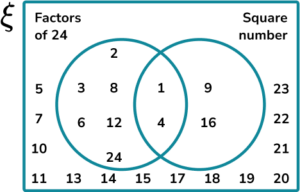

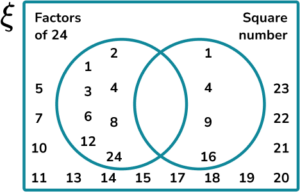

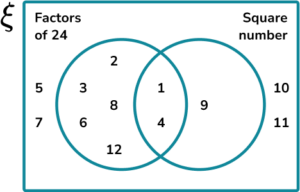

- The numbers that are factors of 24 and square numbers are {1, 4} . These are written in the intersection of the two circles.
- The numbers that are factors of 24 but are not square numbers are \{2, 3, 6, 8, 12, 24\} . These are written in the left crescent of set A.
- The numbers that are not factors of 24 but are square numbers are \{9, 16\} . These are written in the right crescent of set B.
- The numbers that are neither factors of 24 or square numbers are \{5, 7, 10, 11, 13, 14, 15, 17, 18, 19, 20, 21, 22, 23\} . These are written in the outside region.
3. The universal set \xi = \{A, I, O, K, P, E, S, U, Y, H\} . Draw a Venn diagram with the following sets:
- A={Vowels}
- B={No curved lines}
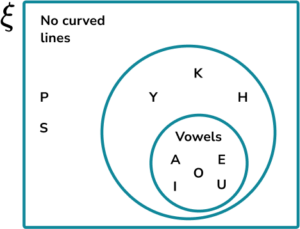

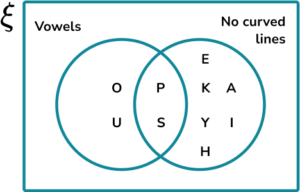

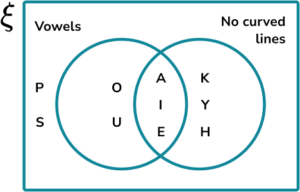

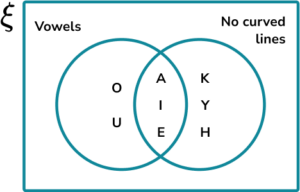

- The letters that are vowels and have no curved lines are \{A, E, I\} . These are written in the intersection of the two circles.
- The letters that are vowels and have curved lines are \{O, U\} . These are written in the left crescent of set A.
- The letters that are not vowels but have no curved lines are \{H, K, Y\} . These are written in the right crescent of set B.
- The letters that are not vowels and have curved lines are \{P, S\} . These are written in the outside region.
4. Below is a table containing the name of each planet in the solar system along with their radius and whether they are gas giants or terrestrial.
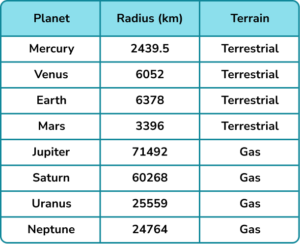
Draw a Venn diagram with the following sets:
- A={Radius r<3\times{10}^{4}\text{km} }
- B={Gas giant}
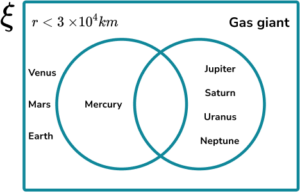

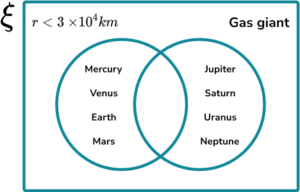

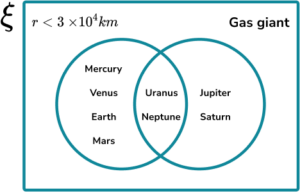


- The planets that have a radius smaller than 3\times{10}^{4} and are gas giants is the subset {Uranus, Neptune}. These are written in the intersection of the two circles.
- TThe planets that have a radius smaller than 3\times{10}^{4} and are not gas giants is the subset {Mercury, Venus, Earth, Mars}. These are written in the left crescent of set A.
- The planets that have a radius larger than 3\times{10}^{4} and are gas giants is the subset {Jupiter, Saturn}. These are written in the right crescent of set B.
- There are no planets in the solar system that have a radius larger than 3\times{10}^{4} and are not gas giants.
5. A list of random numbers is generated by a computer.
| -8.83 | 5.71 | 1.05 | 37 |
| -7.62 | -6 | 22 | 13 |
| -7 | -12 | 6.63 | -4.1 |
| -19 | 3.9 | 42 | 8.62 |
| 5 | 49 | 10.5 | 32 |
Sort these numbers into the two sets:
- A={Decimal}
- B={Negative number}
and hence construct a Venn diagram to show the number of items within each subset.
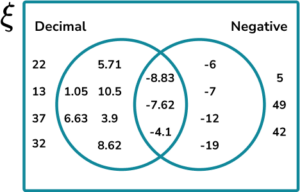

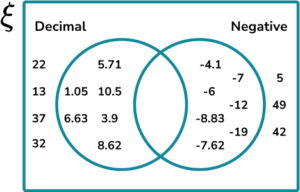

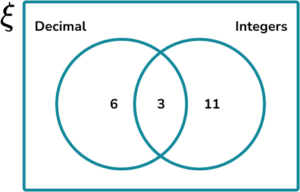

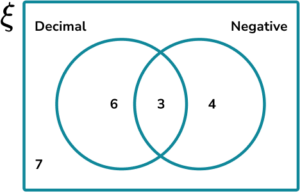

- The numbers that are decimals and negative numbers are \{-8.83, -7.62, -4.1\} (the negative decimals). There are 3 of these numbers and so 3 is written in the intersection of the two circles.
- The numbers that are decimals but not negative numbers are \{5.71, 1.05, 10.5, 6.63, 3.9, 8.62\} (the positive decimals). There are 6 of these numbers and so 6 is written in the left crescent of set A..
- The numbers that are not decimals but are negative numbers are \{-6, -7, -12, -19\} (the negative integers). There are 4 of these numbers and so 4 is written in the right crescent of set B.
- The numbers that are not decimals or negative numbers are \{22, 13, 37, 32, 5, 49, 42\} (the positive integers). There are 7 of these numbers and so 7 is written in the outside region.
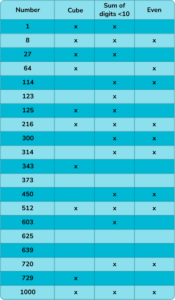
6. The universal set \xi contains the following numbers:
| 3625 | 216 | 314 | 603 | 300 |
| 8 | 450 | 512 | 123 | 639 |
| 27 | 1 | 64 | 1000 | 343 |
| 373 | 729 | 114 | 125 | 720 |
Construct a three circle Venn diagram to show the frequencies of items in following sets:
- A={Cube numbers}
- B={Sum of digits <10 }
- C={Even}
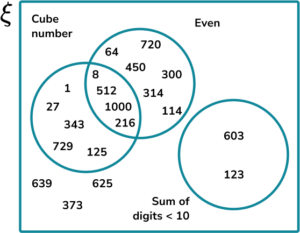

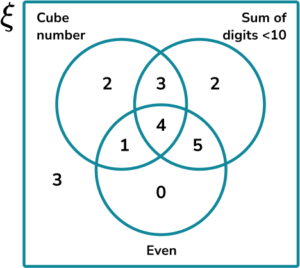

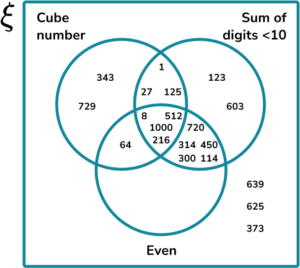

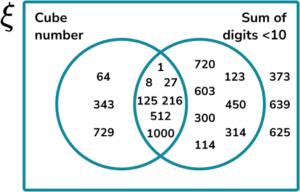

Using a table, we can see the details for each number below:
Constructing Venn diagrams GCSE questions
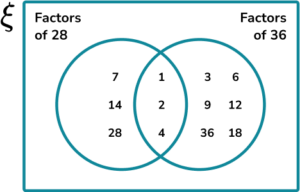
1. Draw a Venn diagram to show the relationship between the two sets:
- Factors of 28
- Factors of 36
Only include the values within these two sets.
(2 marks)
Two circle Venn diagram drawn with correct labels
(1)
Correct factors within each subset
(1)
Solution:
2. (a) A netball team has 7 players split into two categories: Attack and Defense. The player who is in the Centre position can attack and defend.
There are 4 defensive players in a team. Draw a Venn diagram to show the frequency of each subset.
(b) What is the probability of picking a player at random who plays an attack position only?
(3 marks)
(a)
Two circle Venn diagram drawn with correct labels
(1)
Correct frequencies within each subset
(1)
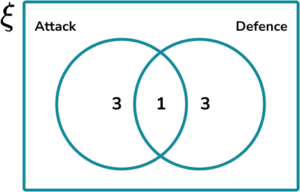
(b)
\cfrac{3}{7}
(1)
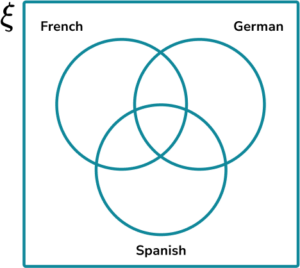
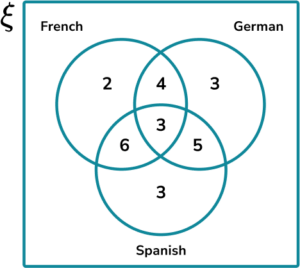
3. A linguistics college is researching the frequencies of students who study French, Spanish and/or German at GCSE. Use the following information to complete the Venn diagram below.
- 15 students study German
- 17 students study Spanish
- 15 students study French
- 3 students study all three languages
- 9 students study French and Spanishn
- 5 students study German and Spanish, but not French
- 3 students only study German
(2 marks)
Two circle Venn diagram drawn with correct labels
(1)
Correct factors within each subset
(1)
Solution:
Learning checklist
You have now learned how to:
The next lessons are
Still stuck?
Prepare your KS4 students for maths GCSEs success with Third Space Learning. Weekly online one to one GCSE maths revision lessons delivered by expert maths tutors.

Find out more about our GCSE maths tuition programme.