GCSE Tutoring Programme
Our chosen students improved 1.19 of a grade on average - 0.45 more than those who didn't have the tutoring.
In order to access this I need to be confident with:
Squares and square roots Cubes and cube roots Prime numbers Types of numbers Factors and multiples 2D shapes 3D shapes Decimals Negative numbersThis topic is relevant for:

Venn Diagram
Here we will learn about Venn diagrams, including what they are, what they represent, their uses and key set notation.
You can also download the following free venn diagram resources all suitable for those following Edexcel, AQA or OCR exam boards:
What is a Venn diagram?
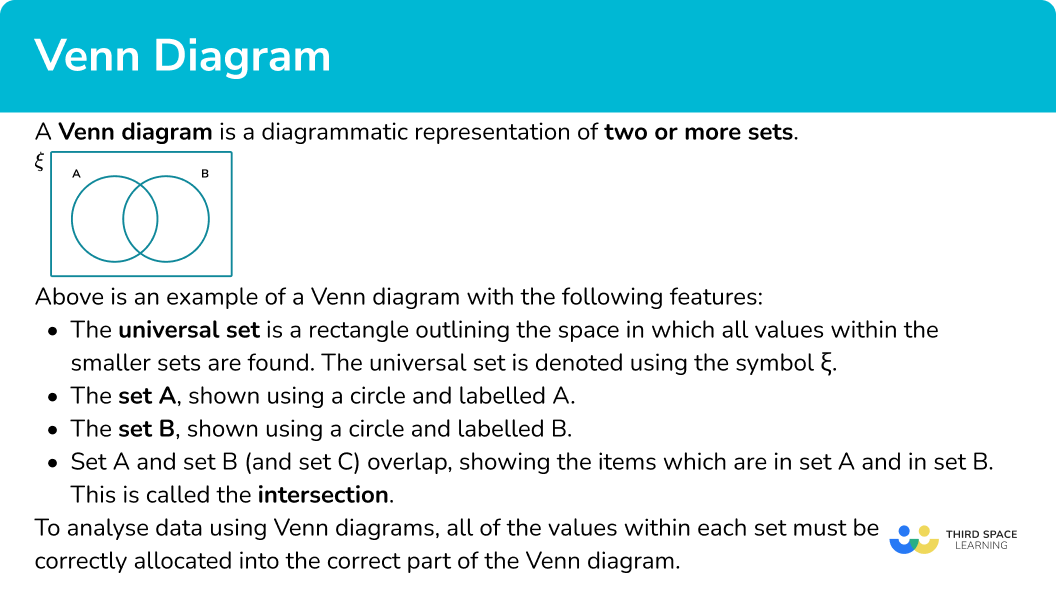
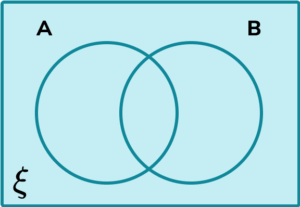
A Venn diagram is a diagrammatic representation of two or more sets.
For example,
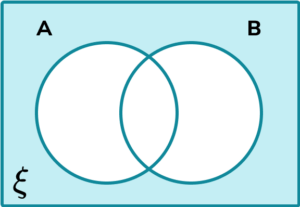
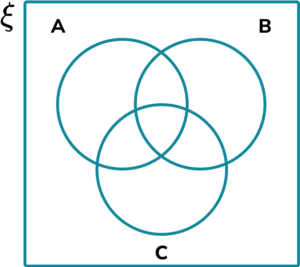
Above are examples of a two set and a three set Venn diagram with the following features:
- The universal set is a rectangle outlining the space in which all values within the smaller sets are found. The universal set is denoted using the symbol \xi.
- The set A, shown using a circle and labelled A.
- The set B, shown using a circle and labelled B.
- The set C, shown using a circle and labelled C (Three set Venn diagram).
- Set A and set B (and set C) overlap, showing the items which are in set A and in set B. This is called the intersection.
To analyse data using Venn diagrams, all of the values within each set must be correctly allocated into the correct part of the Venn diagram. The number of sets is usually outlined or logically deduced from the information provided.
What is a Venn diagram?
How to use a Venn diagram
● Constructing a Venn diagram
To construct a Venn diagram, we draw a region containing two or more overlapping circles (or ellipses), each representing a set, and fill in the relevant information that is either given, or can be logically deduced.
For example, this Venn diagram shows the set of numbers \xi=\{1, 2, 3, 4, 5, 6, 7, 8, 9, 10\} which have been sorted into factors of 10 (F) and even numbers (E).
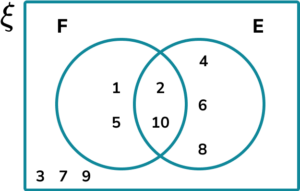
- All numbers 1-10 are represented on the Venn diagram.
- The factors of 10 appear within F.
- The even numbers appear within E.
- The numbers that are both factors of 10 and even numbers appear in the intersection of F and E.
- The numbers that are not factors of 10 or even numbers are outside of the circles.
Step-by-step guide: Constructing Venn diagrams
● Set notation
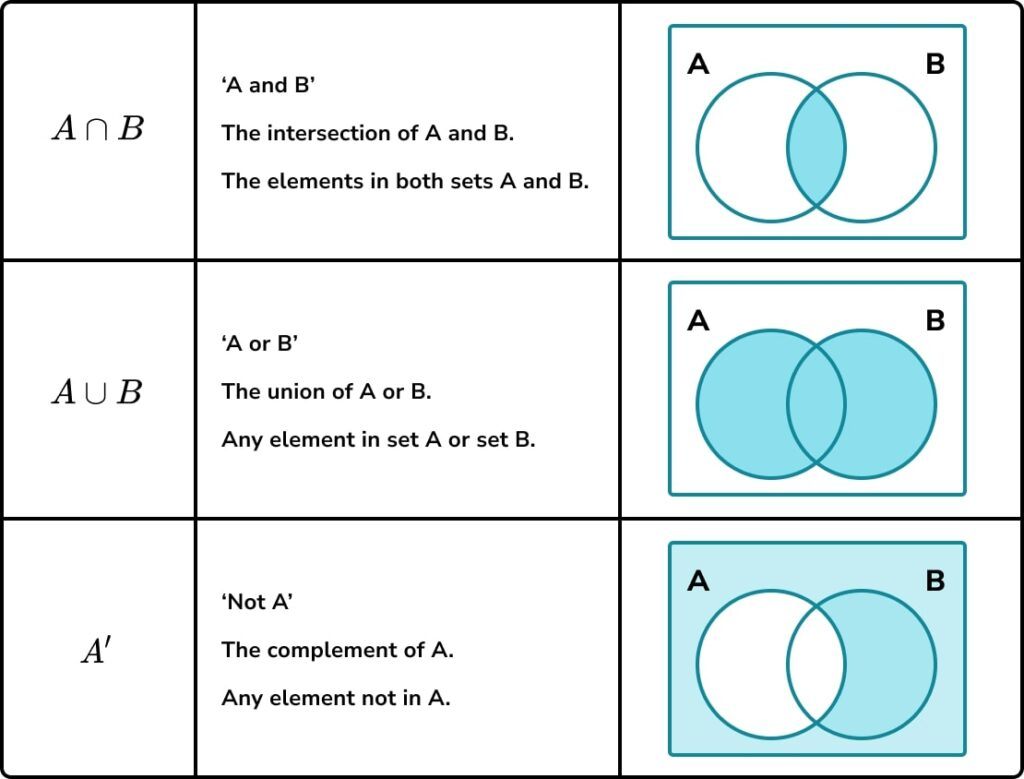
To describe a subset, we need to understand key symbols and set notation for different sets including the intersection of sets, the union of sets and the absolute complement of sets.
Here are some common examples of set notation and their meaning,
We can use combinations of these, for example
A^{\prime} \cup B^{\prime} \text { or }(A \cap B)^{\prime} .
Step-by-step guide: Venn diagram symbols
● Subsets
To calculate the number of items in a subset of a Venn diagram, we need to add together the frequencies of the required subset.
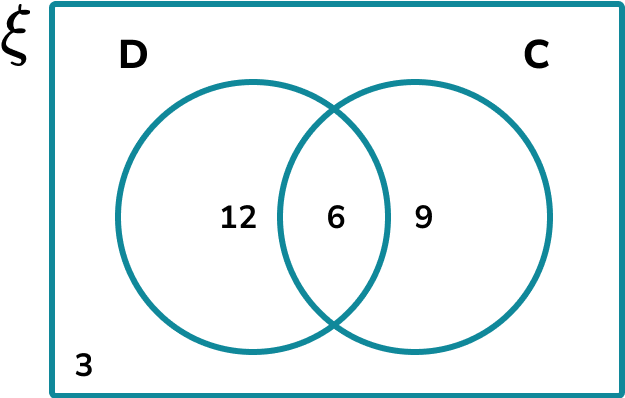
For example, this Venn diagram shows the number of people who own a cat (C) or a dog (D).
Step-by-step guide: Set notation
● Calculating probabilities
To calculate a Venn diagram probability, we need to know each frequency within a subset and the frequency of the larger set which the probability is conditioned on.
For example, this Venn diagram shows the number of people who like Chinese food (C) and Indian food (I).
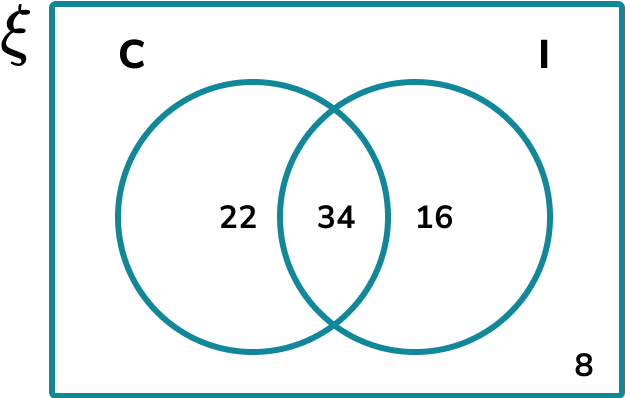
We can find the probability that a person likes Chinese and Indian food.
In general, \text{probability}=\frac{\text{number of desired outcomes}}{\text{total number of outcomes}} .
Here, the probability that a person chosen at random likes Chinese and Indian food, written \text{P}(\text{C} \cap \text{I}), is \frac{34}{80} since 34 people like Chinese and Indian food out of 80 people in total.
Step-by-step guide: Venn diagram probability
See also: Venn diagram union and intersection
What do Venn diagrams include?
Venn diagram worksheet
Get your free Venn diagram worksheet of 20+ questions and answers. Includes reasoning and applied questions.
DOWNLOAD FREE Venn diagram worksheet
Get your free Venn diagram worksheet of 20+ questions and answers. Includes reasoning and applied questions.
DOWNLOAD FREEVenn diagram examples
Example 1: constructing a two set Venn diagram
The set \xi = \{1, 2, 3, 4, 5, 6, 7, 8, 9, 10, 11, 12 \}. Draw a Venn diagram that shows the distribution of the values in the set \xi into the two following sets:
- Prime Numbers
- Factors of 12
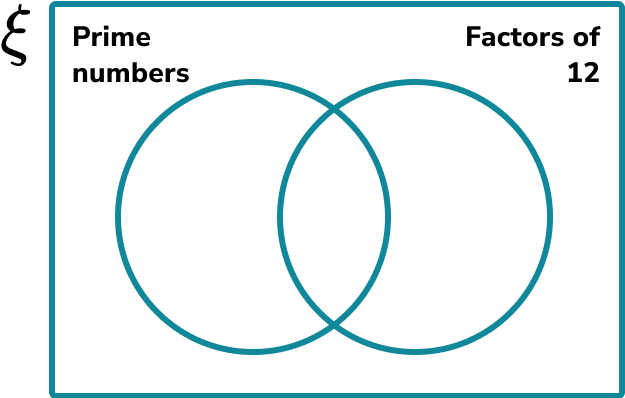
- Draw the rectangular universe.
2Draw the overlapping circles within the universe and label.
The first circle should be labelled with the name of the set Prime Numbers. The second circle should be labelled Factors of 12.
3Fill in the information for each subset within the Venn diagram.
Place each item in the universal set into the correct part of the Venn diagram.
Top tip: Go through each item in order so you don’t miss any values.
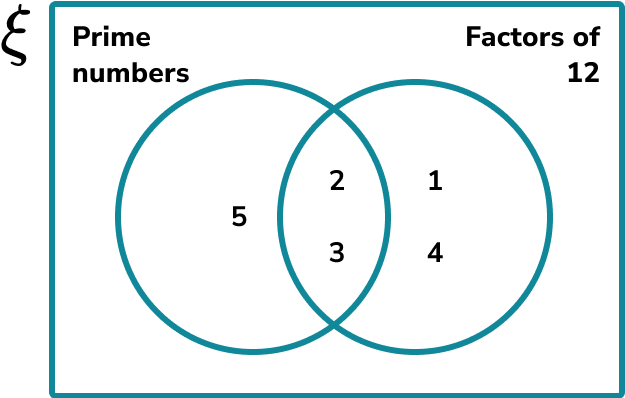
- As 1 is a factor of 12 and not a prime number, the number 1 would be placed in the right crescent of the set Factors of 12.
- 2 is a factor of 12 and it is a prime number. This would go in the overlapping part of the two circles (the intersection).
- 3 is a factor of 12 and it is a prime number so this would also go into the intersection of the two sets.
- 4 is a factor of 12 and not a prime number so that will go into the right crescent.
- 5 is a prime number but not a factor of 12 and so this would go into the left crescent.
So far we have the following Venn diagram,
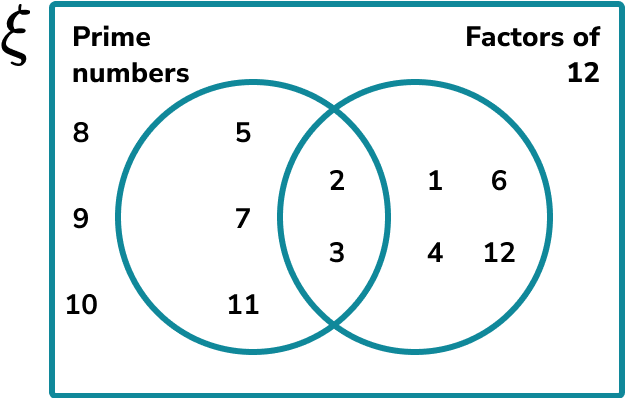
Continuing this process, we get the final solution,
Example 2: constructing a three set Venn diagram
A research group divided 40 construction workers into three groups based on the following criteria,
- A = {Aged over 30 years old}
- B = {Builder}
- C = {Owns a car}
10\% of the participants satisfy all three criteria.
\frac{1}{2} of the construction workers satisfy at least 2 of the three criteria.
Complete the following three circle Venn diagram to represent the distribution of the participants in the research study.
The universal set is already given and so we can move on to the next step.
The three sets have already been given and so we can move on to the next step.
As 10\% of participants are within all three sets, the very centre of the Venn diagram where all three sets overlap would contain the value,
(40 \div 100) \times 10=4 .
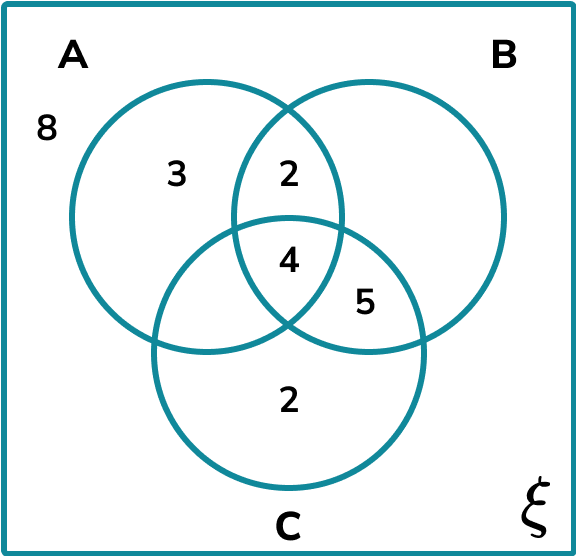
As \frac{1}{2} of the participants are in at least 2 of the three sets, 40\times\frac{1}{2}=20.
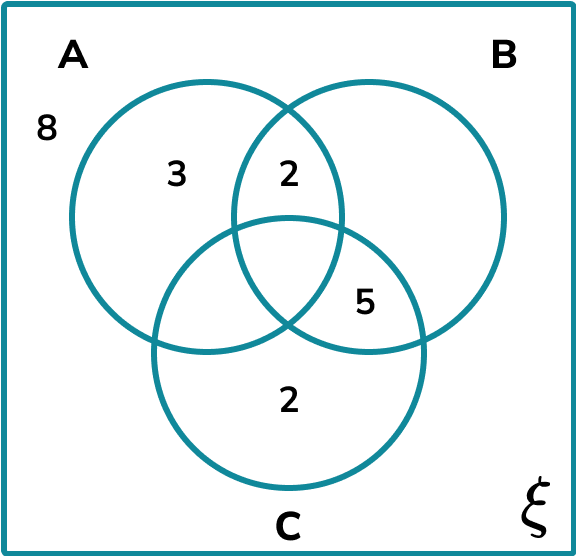
The missing value in the intersection between A and C is therefore 20-(2+4+5)=9.

The final missing value for set B is the number of remaining participants. This is equal to
40-(8+3+2+9+4+5+2)=7.
This gives us the completed Venn diagram.

Example 3: describing a subset of a two set Venn diagram
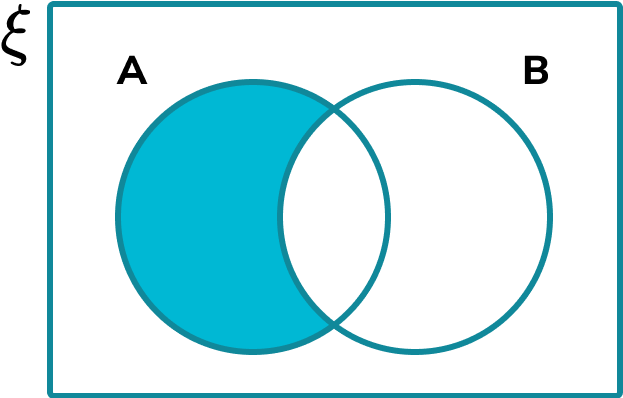
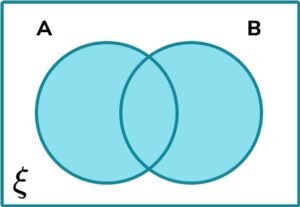
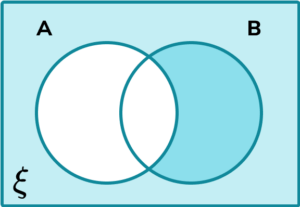
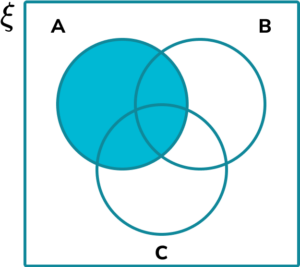
State the name of the subset that is the shaded region in the Venn diagram below,
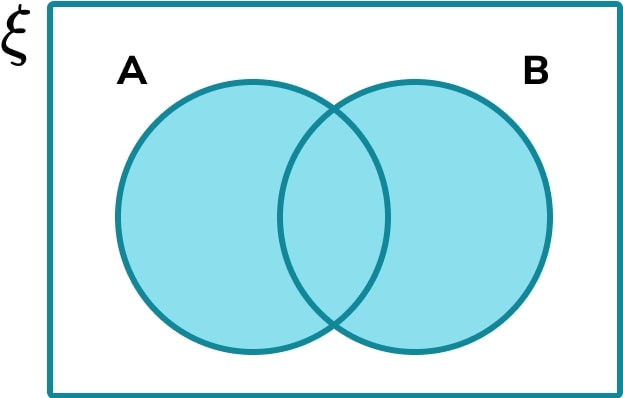
Every value in set A and every value in set B are included in the shaded region.
Every value not in the set A or B is not included in the shaded region.
As every region within set A or set B is shaded, this is the union of set A and set B, written as A \cup B.
Solution: A \cup B
Example 4: set notation
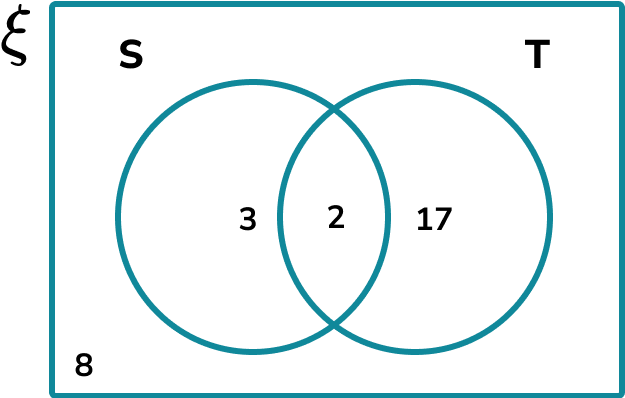
A meteorologist recorded the daily weather patterns over the month of November.
The two factors that he wants to look at are
- S={number of days with at least 4 hours of sunshine}
- T={Temperature dropped below 0^{o}C between 8pm and 8am }
Below is a Venn diagram of his results.
Determine the frequency of the set S \cup T’.
The subset S \cup T’ is the union of all of the values in the set S or all of the values not in the set T. This is the following shaded region:
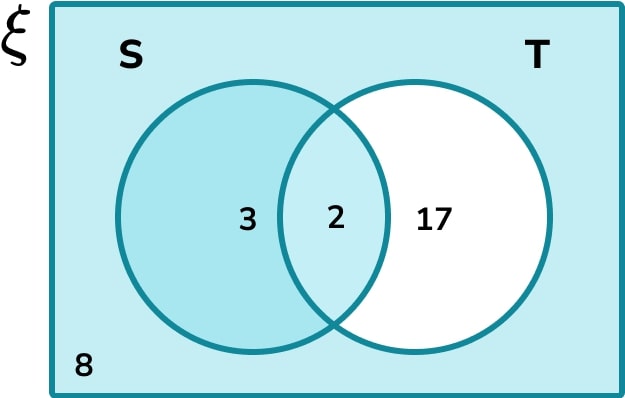
Do not count any duplicated values twice. We only add each value within the two sets once, to get 8+3+2=13.
Solution: S \cup T’ =13.
Example 5: probability
40 musicians were asked if they could play the Violin (V) or the Piano (P). The results are shown in the Venn diagram below.
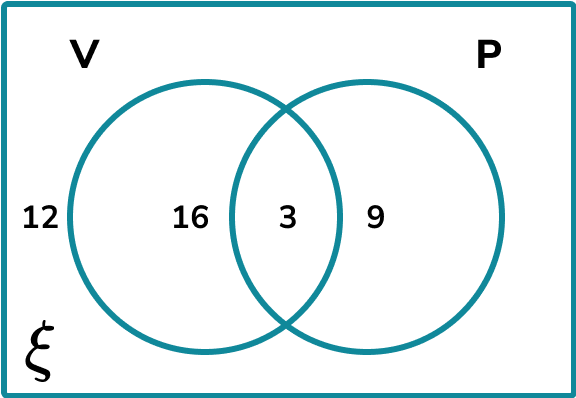
Calculate the probability of selecting a musician at random that can only play the violin.
The subset of musicians that can only play the violin is the set,
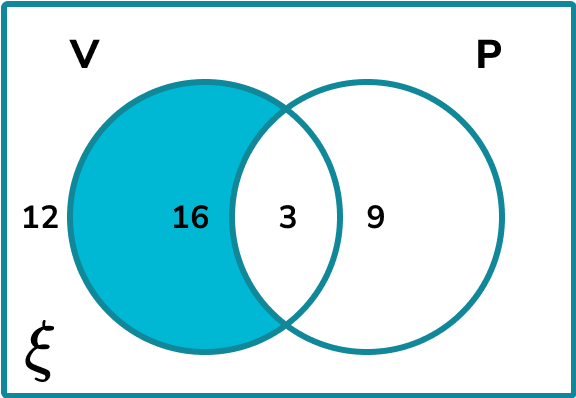
The frequency of musicians who can only play the violin is 16.
The larger set is every musician. We know that this total is 40 as it is given in the question (we can work this out by adding every frequency in the Venn diagram).
The probability of picking a musician at random that can only play the violin is \frac{16}{40}=\frac{2}{5}.
Example 6: conditional probability
70 students were asked about whether they have B={biscuits} or C={crisps} for their break time snack. The results are shown in the Venn diagram below.
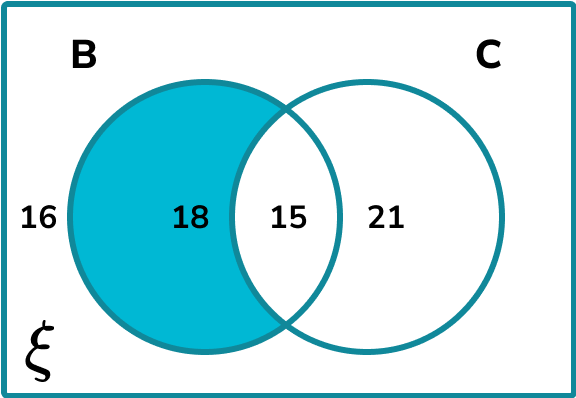
Calculate the probability of a student not having crisps given that they have biscuits.
We need to identify the subset which is the part of B that is not part of C,
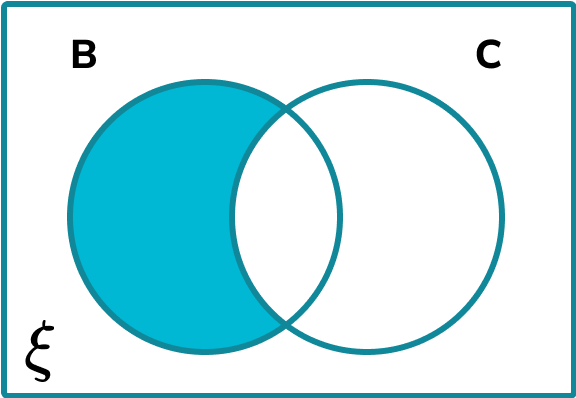
The frequency of values in the subset is 18.
In this case, we know the student has biscuits, so the population we are looking at is those in set B and we can ignore those not in set B.
The frequency of values in set B is 18+15 = 33.
P(C’ given B) =\frac{18}{33}=\frac{6}{11}.
Common misconceptions
- Placing every item in a set in the intersection
The intersection is the overlap between two sets. If the item is only in Set A and not Set B, it must go in the subset that is just A, and not the intersection.
(This is the intersection of sets \mathrm{A} and \mathrm{B}^{\prime}. We write this as \mathrm{A} \cap \mathrm{B}^{\prime} and say A and not B, or just A)
- Missing values
Make sure that every value within all of the sets is written into the Venn diagram. Count the items or add the frequencies to check your answer.
- No universal set
The universal set contains all of the items within every set given. If an item does not go in either circle, the item is written in the outer region, still within the rectangular universe.
- The empty set
It is possible that a set contains no items, or is the empty set. The frequency should therefore be written as 0, and not left blank.
- Sets incorrectly labelled
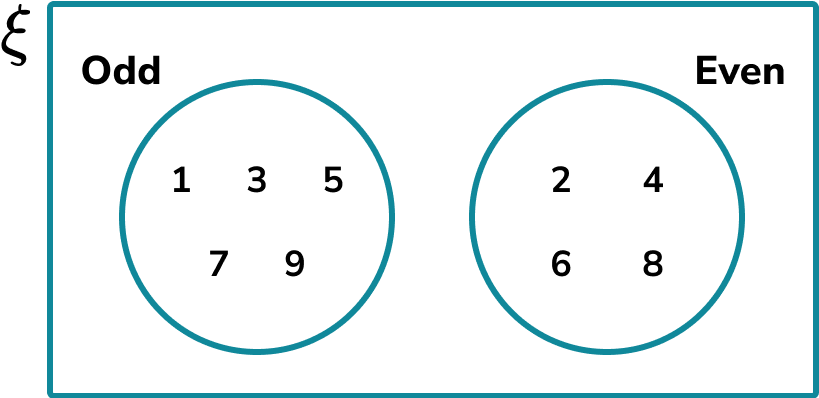
Take for example the following two sets,
☐ Odd numbers less than 10
☐ Prime numbers less than 10
The Venn diagram is drawn so that the two sets are given as,
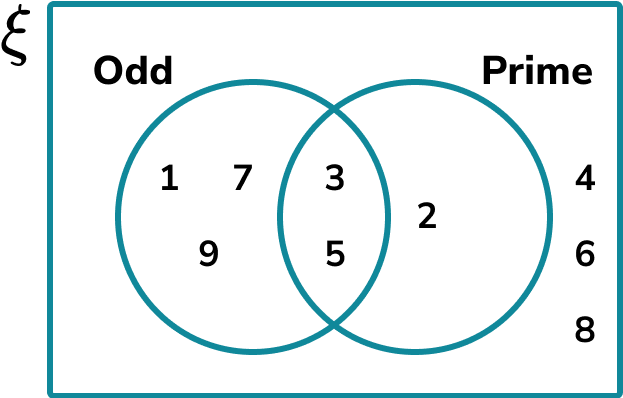
whereas the Venn diagram should look like this,
- Using probability terminology incorrectly
The set of A is written as A which consists of a list of items or a frequency.
The probability of A is written as P(A) and is a fraction. These two should not be confused.
- Conditional Probability
For conditional probability, the denominator of the fraction will be a subset of the population, rather than the universal set.
- Duplicated values
The items that are placed in the intersection are sometimes incorrectly added twice, as it is assumed that the values are doubled as they belong to two sets. They only need to be counted once.
Practice Venn diagram questions
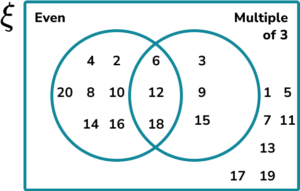
1. Let x be an integer. Construct a two set Venn diagram to represent the set \xi=\{0 < x\leq{20}\} shared between the set of even numbers and the set of the multiples of 3.
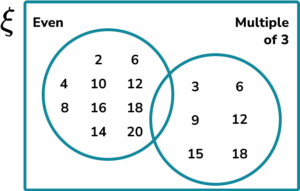

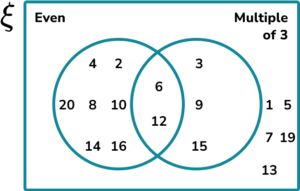
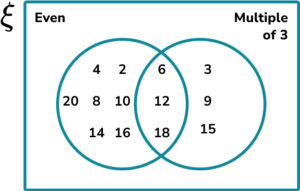


- The even numbers that are not multiples of 3 are 2, 4, 8, 10, 14, 16, 20. These are in the left crescent representing only even.
- The multiples of 3 that are not even numbers are 3, 9, 15. These are in the right crescent representing only multiples of 3.
- The even numbers that are also multiples of 3 are 6, 12, and 18. These go in the intersection of the two circles.
- The numbers that are not even or multiples of 3 are 1, 5, 7, 11, 13, 17, and 19.
2. A group of people were asked about their phobias. Use the following information to complete the three set Venn diagram showing the results.
- 30 people had a phobia of balloons (B).
- 24 people had a phobia of spiders (S).
- 15 people had a phobia of clowns (C).
- 5 people had a phobia of balloons, spiders and clowns.


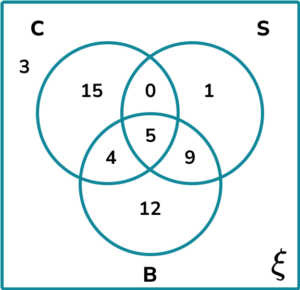
- As 5 people have a phobia of all 3, 5 is placed in the centre of the Venn diagram where all of the three circles intersect.
- The total for balloons is 30 so 30-(4+5+9)=12. (Just B)
- The total for clowns is 15 so 15-(0+5+4)=6. (Just C)
- The total for spiders is 24 so 24-(0+5+9)=10. (Just S)
3. Determine the shaded region on the Venn diagram for the set \mathrm{A}^{\prime} \cap \mathrm{B}^{\prime}.
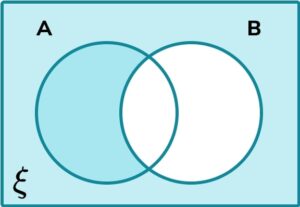
The set \mathrm{A}^{\prime}:
The set \mathrm{B}^{\prime}:

And so the set \mathrm{A}^{\prime} \cap \mathrm{B}^{\prime} is the intersection of the two sets A’ and B’ or the regions that occur in both sets. This is the region:

4. A local pharmacy is carrying out some research. They would like to find out how many people have had one of the following three symptoms of flu:
- T = {Temperature}
- C = {Cough}
- F={Fever}
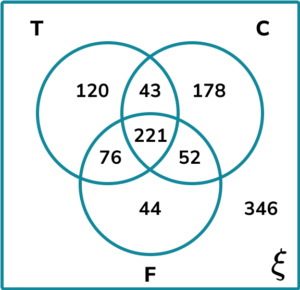
Calculate the frequency of people who had a cough or a fever, but not a temperature.
178 people had a cough only. 44 people had a fever only. 52 people had a cough and a fever, but not a temperature. The number of people that had a cough or a fever, but not a temperature is 178+52+44=274.
5. The Venn diagram below shows the names of 2D shapes that have at least one pair of parallel sides (P) or are quadrilateral (Q).
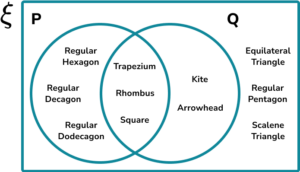
From the set \xi , determine P(P \cup Q)’.
The set (P \cup Q)’ contains all of the values that are not in the set P or Q,
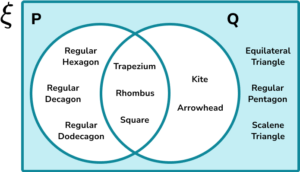
The three shapes that are in the shaded region are equilateral triangle, regular pentagon, and scalene triangle.
As there are 11 shapes in the Venn diagram,
P(P \cup Q)’ = \frac{3}{11}.
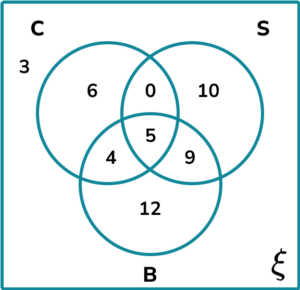
6. A university’s entry requirements to study a degree in Medical Science is a grade A in Maths, and then a grade A in at least two of the three subjects: Chemistry, Biology, or Physics.
The Venn diagram below shows the frequencies of students who applied for the course and achieved an A grade in each subject.
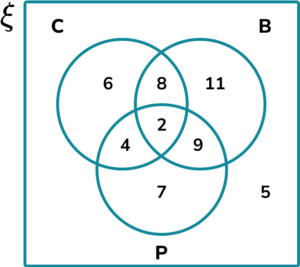
Calculate P(C given that B \cup P).
The frequencies within each shaded region for the required subsets are,
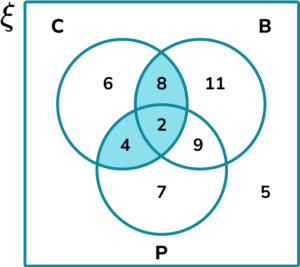
C \cap (B \cup P):
\begin{aligned} \\ &=8+2+4 \\\\ &=14 \end{aligned}
‘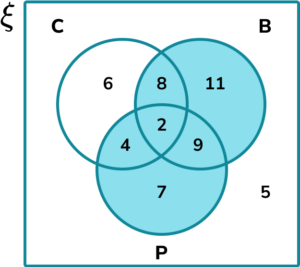
B \cup P:
\begin{aligned} \\ &=8+11+2+9+4+7 \\\\ &=41 \end{aligned}
P(C given that B \cup P) = \frac{14}{41}.
Venn diagrams GCSE questions
1. Shade the region in the Venn diagram that represents the set (A \cup B) \cap (A \cup C).
(1 mark)
(1)
2. (a) A marine life park is opening a new underwater world consisting of 16 different tanks.
\frac{1}{4} of the tanks have coral and fish in them, \frac{1}{2} of the tanks contain fish only, and 1 tank does not contain fish or coral.
Draw a Venn diagram to show the distribution of Fish and Coral in the new underwater world tanks.
(b) How many tanks contain Coral?
(5 marks)
(a)
4 written in the intersection of Fish and Coral
(1)
8 written in Fish only
(1)
3 written in Coral only
(1)
1 written in the universal set
(1)
Solution:
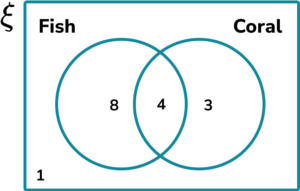
(b)
4+3=7
(1)
3. (a) Members of a mountain rescue team were asking local walking groups whether they had any of the following emergency items: F = {First aid kit}, B = {Bivvy bag}, W = {Whistle}.
The results of their research were written into a Venn diagram:

How many walking groups had at least 2 of the three emergency items with them?
(b) Calculate P(F \cap B \cap W). Give your answer as a simplified fraction.
(4 marks)
(a)
9+12+11+2=34 groups
(1)
(b)
F \cap B \cap W =12
(1)
P(F \cap B \cap W) =\frac{12}{64}
(1)
\frac{3}{16}(1)
Learning checklist
You have now learned how to:
The next lessons are
A brief history of diagrams
John Venn (1834-1923) was a mathematician, logician and philosopher who introduced the Venn diagram which we use widely in modern day statistics, probability, set theory and computer science. Clarence Irving wrote about the Venn diagram in his book ‘A survey of symbolic logic’ in 1918 after which Venn diagrams became more popular.
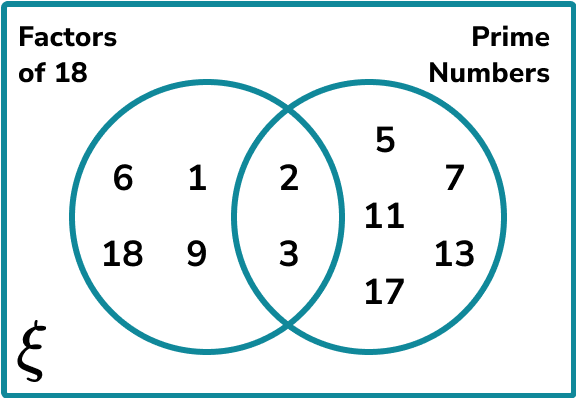
The Venn diagram below shows the relationship between the data set of Factors of 18, and the data set of Prime numbers less than 18.
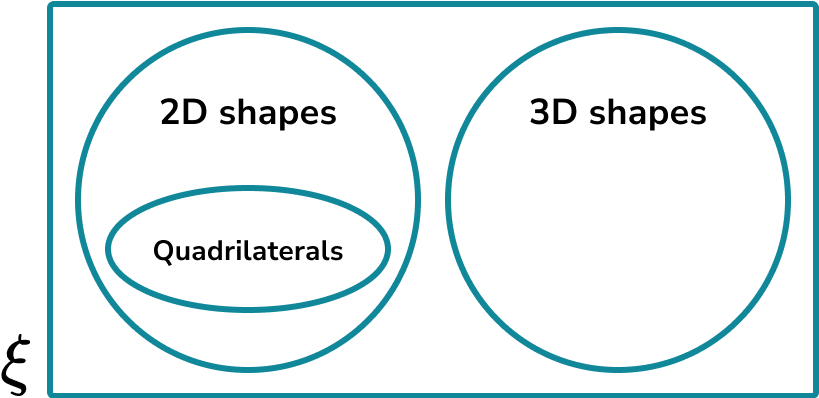
Leonhard Euler (1707-1783) was a pioneering Swiss mathematician who has greatly influenced today’s fundamental understanding of mathematics in areas such as fluid mechanics, complex analysis and calculus. An Euler diagram (sometimes referred to as Eulerian circles) is different to a Venn diagram because they only show relevant relationships, whereas a Venn diagram shows all possible relationships.
Take for example the set of 2D shapes and 3D shapes. These two sets cannot overlap as a 2D shape cannot be a 3D shape, however Quadrilaterals are a subset of 2D shapes and so they are contained entirely within the set of 2D shapes.
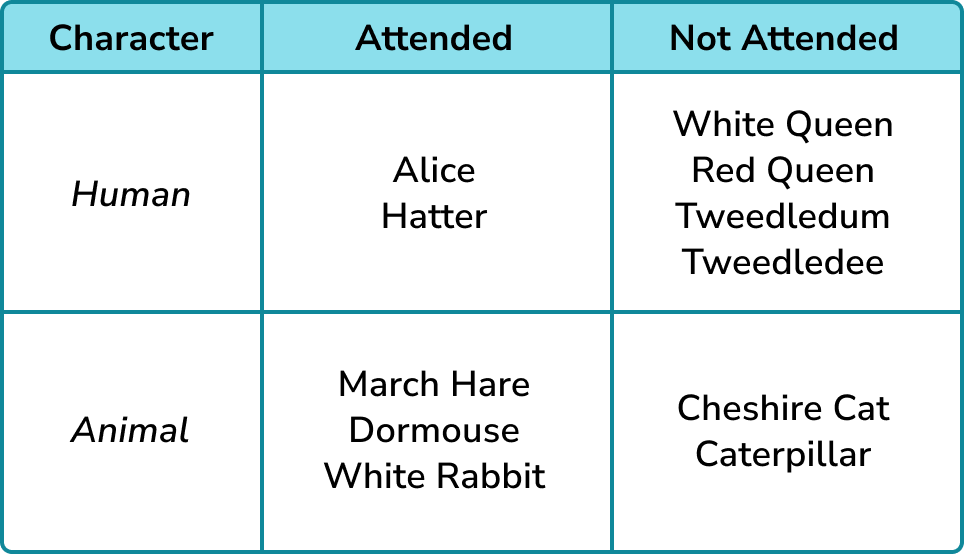
A Carroll diagram (named after the author and mathematician Lewis Carroll) is similar to a two-way table which categorises items within a set into smaller subsets.
For example, below is a Carroll diagram showing the Humans and Animals that did/not attend the tea party in the book ‘Alice in Wonderland’:
Note: A Venn diagram is named after John Venn and so ‘Venn’ should be capitalised (this is the same for Euler diagrams and Carroll diagrams as they are named after Leonhard Euler, and Lewis Carroll respectively).
Still stuck?
Prepare your KS4 students for maths GCSEs success with Third Space Learning. Weekly online one to one GCSE maths revision lessons delivered by expert maths tutors.

Find out more about our GCSE maths tuition programme.