GCSE Tutoring Programme
Our chosen students improved 1.19 of a grade on average - 0.45 more than those who didn't have the tutoring.
This topic is relevant for:

Venn Diagram Probability
Here we will learn about Venn diagram probability, including how to calculate a probability using a Venn diagram.
You can also download the following free venn diagram probability resources all suitable for those following Edexcel, AQA or OCR exam boards:
What is Venn diagram probability?
Venn diagram probability is used to state the probability of or predict the possible outcomes of one or more event(s) occurring.
To do this we need to have a completed Venn diagram to be able to calculate probabilities from.
E.g.
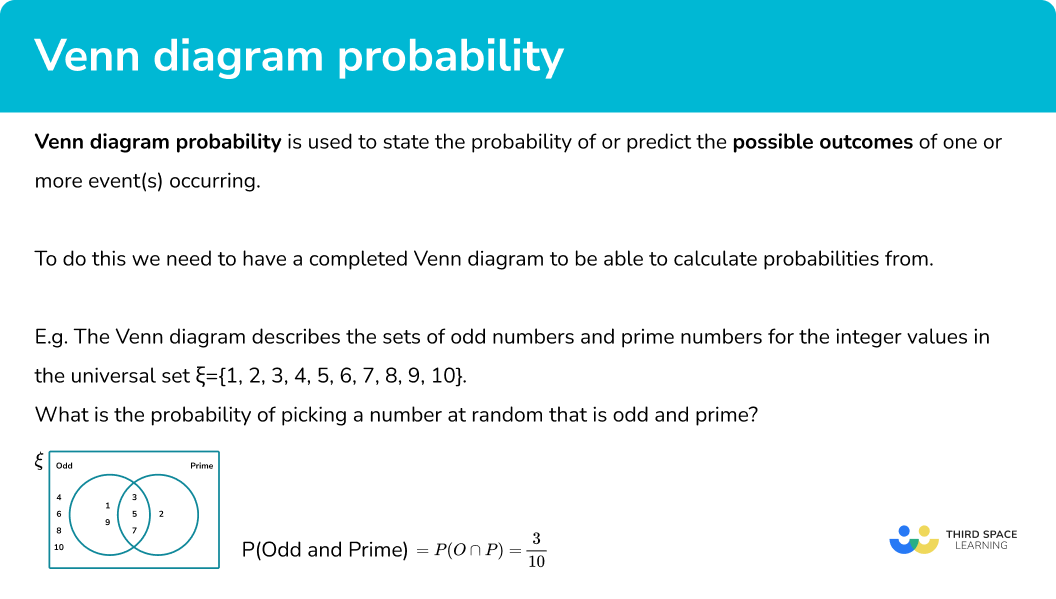
Below is a Venn diagram describing the sets of odd numbers and prime numbers for the integer values in the universal set \xi ={1, 2, 3, 4, 5, 6, 7, 8, 9, 10} .
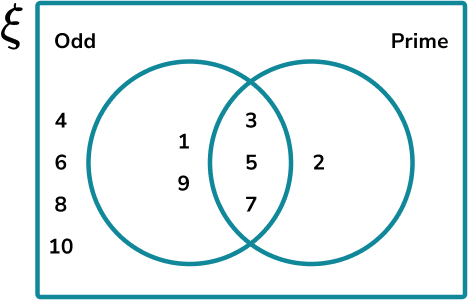
There are 5 odd numbers. 3 of these odd numbers are also prime numbers. The probability of selecting a number from the universal set that is odd, and prime, is 3 out of the total number of values in the universal set, 10 . The solution is therefore:
P(Odd and Prime) = P(O\cap{P}) = \frac{3}{10}.
Remember, because we are looking for a probability. This is usually expressed as a fraction or a decimal.
You must be aware of all of the set notation and symbols used for Venn diagrams.
What is a Venn diagram probability?
Conditional probability
When calculating probabilities from a Venn diagram, there may be conditions that need to be considered.
E.g. Let’s use the previous Venn diagram for the sets of odd numbers and prime numbers for the integer values in the universal set \xi={1, 2, 3, 4, 5, 6, 7, 8, 9, 10}.
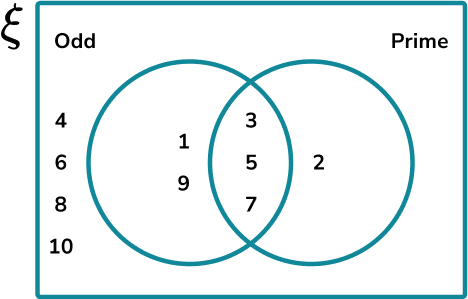
If we wanted to calculate the probability of a prime number, given that the number is odd, we need to know the frequency of numbers that are prime and odd ( 3 ), out of the total number of odd numbers ( 5 ). The probability is therefore \frac{3}{5} .
The condition we had was that the probability was out of another set, rather than the universal set (all of the values).
The questions in the exams will tend to use the word given to show that they are asking for a conditional probability.
In A level mathematics we use a the symbol | to represent the conditional probability in which we say given.
The formula for calculating a conditional probability is:
P(A\mid{B})=\frac{P(A\cap{B})}{P(B)}
The knowledge of this formula is not required for GCSE.
How to calculate probabilities from a Venn diagram
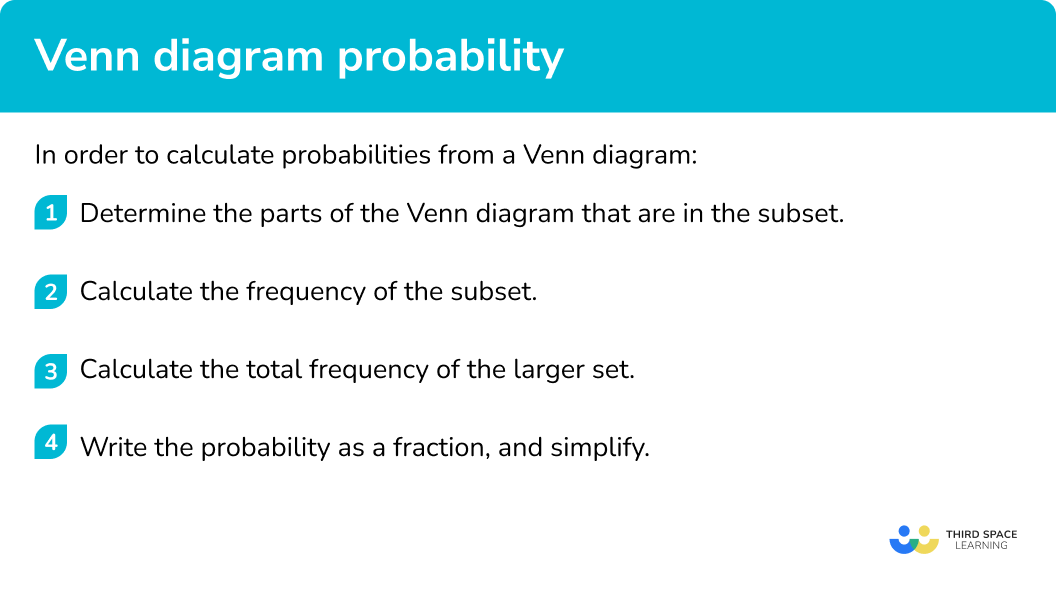
In order to calculate probabilities from a Venn diagram:
- Determine the parts of the Venn diagram that are in the subset.
- Calculate the frequency of the subset.
- Calculate the total frequency of the larger set.
- Write the probability as a fraction, and simplify.
Explain how to calculate probabilities from a Venn diagram
Venn diagram worksheet (includes Venn diagram probability)
Get your free venn diagram probability worksheet of 20+ Venn diagram questions and answers. Includes reasoning and applied questions.
DOWNLOAD FREE Venn diagram worksheet (includes Venn diagram probability)
Get your free venn diagram probability worksheet of 20+ Venn diagram questions and answers. Includes reasoning and applied questions.
DOWNLOAD FREERelated lessons on Venn diagram symbols
Venn diagram probability is part of our series of lessons to support revision on how to calculate probability. You may find it helpful to start with the main Venn diagram lesson for a summary of what to expect, or use the step by step guides below for further detail on individual topics. Other lessons in this series include:
Venn diagram probability examples
Example 1: two set Venn diagram
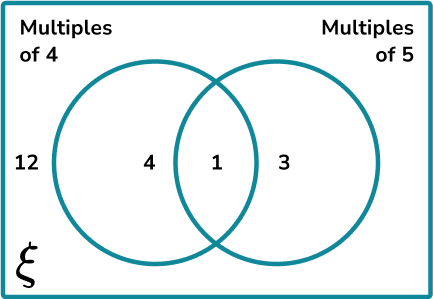
The universal set \xi=\{0<x\leq20, \ x is an integer \} . What is the probability of picking a number from the universal set that is a multiple of 4 , but not a multiple of 5 ?
- Determine the parts of the Venn diagram that are in the subset.
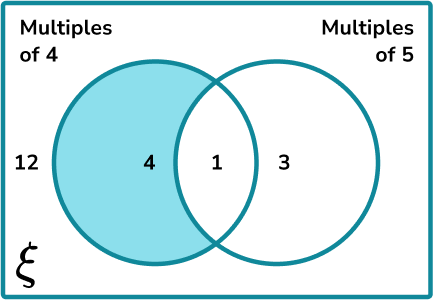
The subset of the multiples of 4 that are not a multiple of 5 is the crescent of the left circle:
2Calculate the frequency of the subset.
The frequency of numbers within this subset is 4 .
3Calculate the total frequency of the larger set.
The larger set is the universal set. The total frequency is therefore: 12+4+1+3=20.
4Write the probability as a fraction, and simplify.
\frac{4}{20}=\frac{1}{5} .
The probability of picking a multiple of 4 that is not a multiple of 5 from the universal set is \frac{1}{5} .
Example 2: two set Venn diagram using symbols
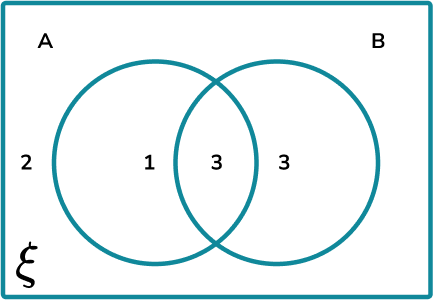
The universal set \xi = {Quadrilaterals} . The Venn diagram shows the frequencies of quadrilaterals that belong to the two sets A= {rotational symmetry}, and B= {at least 1 line of symmetry}. Calculate P(A\cup{B}) .
The subset of the union of A and B every item within both circles:
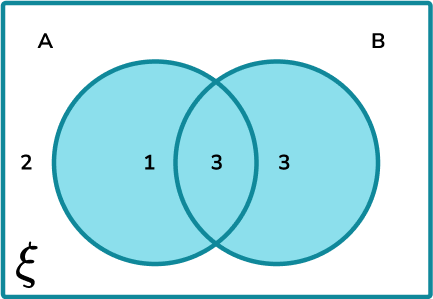
The frequency of numbers within this subset is 1+3+3=7.
The larger set is the universal set. The total frequency is therefore: 2+1+3+3=9.
\frac{7}{9}
P(A\cup{B})=\frac{7}{9}.
Example 3: two set Venn diagram using symbols
The universal set \xi = {Students in Year 10 }. The Venn diagram shows the frequencies of students that belong to the two sets depending on which GCSE they study: G= {Geography}, and H= {History}. Calculate P((G∩H)') .
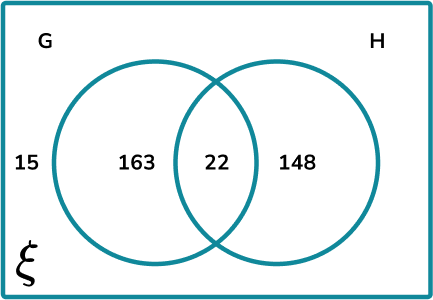
The complement to the intersection of G and H is the region:
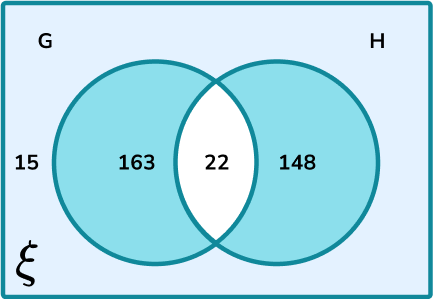
The frequency of numbers within this subset is 15+163+148=326.
The larger set is the universal set. The total frequency is therefore: 15+163+148+22=348.
\frac{326}{348}=\frac{163}{174}.
P(G\cap{H})=\frac{163}{174}.
Example 4: three set Venn diagram
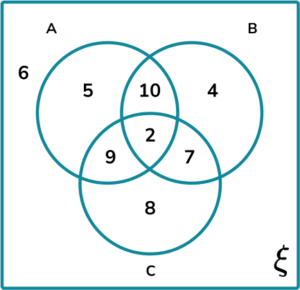
100 people in a community group were asked about which of the three hobbies they enjoy. The three hobbies were Sewing, Pottery and Painting. The results are displayed in a three circle Venn diagram below.
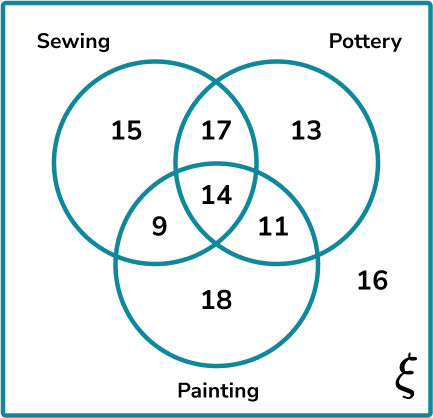
What is the probability of picking a person at random that enjoys two or more hobbies?
As we are being asked about the frequency of two or more hobbies, we need to look at all of the values within the intersections of each circle.
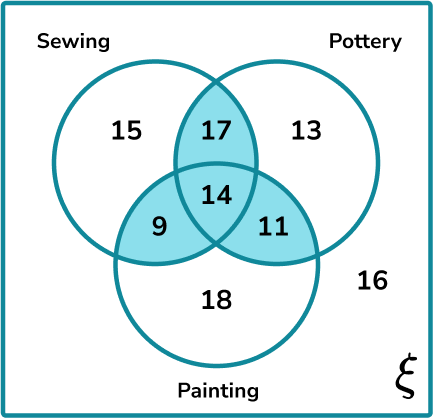
17+14+9+11=51
15+17+13+9+14+11+18+16=113
P (two or more hobbies) =\frac{51}{113}
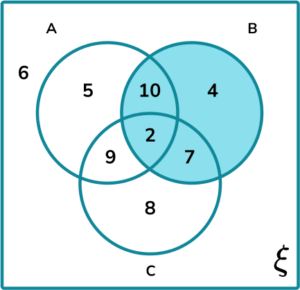
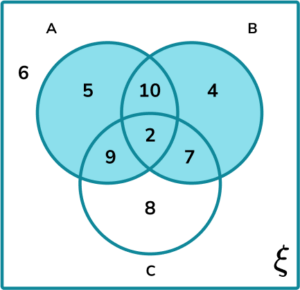
Example 5: three set Venn diagram using symbols
A clothes shop is carrying out some market research. They want to find out what accessories people wear when the weather turns cold. The results are shown below in a Venn diagram.

Calculate P(S\cup(H\cap{G})) .
We want all the frequencies in the group S , or those in the intersection of H and G :
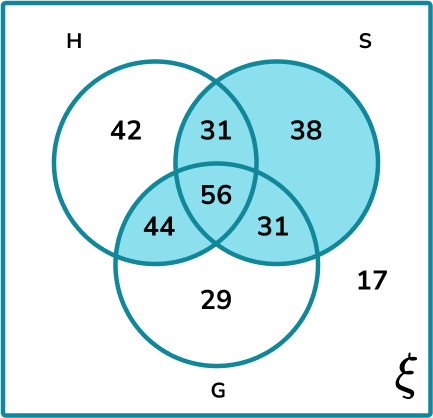
31+56+31+38+44=200
42+31+38+56+44+31+29+17=288
P(S\cup(H\cap{G})) =\frac{200}{288}=\frac{25}{36}.
Example 6: conditional probability
100 students were asked if they had a computer or a games console. The results were recorded in the Venn diagram.
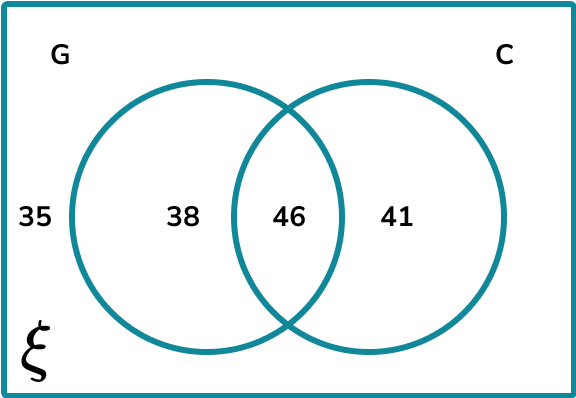
Calculate P(C given that G’) .
We need to identify the two subsets that are:
C\cap{G’}:
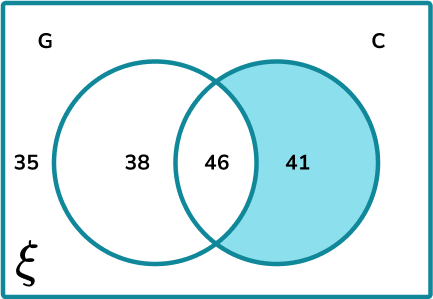
{G’}:
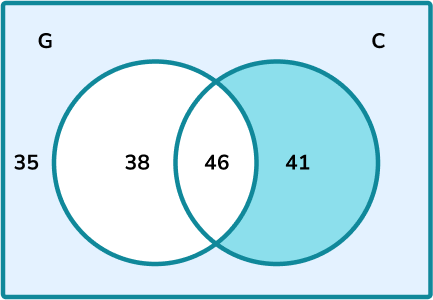
The frequency of values in the subset C\cap{G’} is 41.
The frequency of values in the subset G’ is 41+35=76.
P(C given that G’) = \frac{41}{76}.
Common misconceptions
- Missing values
Make sure that each frequency required within the subset is included within the probability. This also includes values that are in the universal set and not in any other set.
- The probability is not a fraction
The probability is written as a total frequency instead of a fraction of the larger set.
- Using probability terminology incorrectly
The set of A is written as A which consists of a list of items or a frequency.
The probability of A is written as P(A) and is a fraction. These two should not be confused.
- Conditional probability
The fraction is written out of the frequency of the universal set rather than the subset.
- Duplicated values
The items that are placed in the intersection are incorrectly added twice as it is assumed that the values are doubled as they belong to two sets. They only need to be counted once within a new subset.
Practice Venn diagram probability questions
1. The Venn diagram below shows the frequency of people who like certain genres of films. Using the Venn diagram below, calculate the probability of choosing someone at random who likes comedy films.
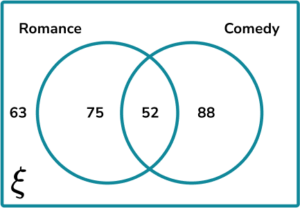


The frequency of people who like comedy films is 52 + 88 = 140.
The total number of people asked is 63+75+52+88=278.
The probability of choosing someone at random who likes comedy films is therefore \frac{140}{278}.
2. The Venn diagram below shows the frequency of people who like H= {ham} or C= {cheese} in a toasted sandwich.
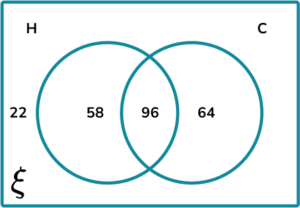
Calculate P(H\cap{C}).
H\cap{C} is the intersection of H and C (the overlapping section):
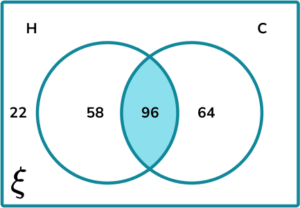
The frequency of people who like ham and cheese fillings is 96.
The total number of people asked is 22+58+96+64=240.
The probability of choosing someone at random who likes ham and cheese toasties is therefore \frac{96}{240}=\frac{2}{5}.
3. The Venn diagram below shows the frequency of people who have a B= {bath} or S= {shower} their main bathroom.
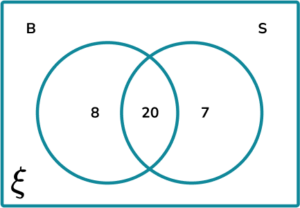
Calculate P(B' \cup{S'}).
B' \cup{S'} is the union of items not in the set of B or not in the set of S:
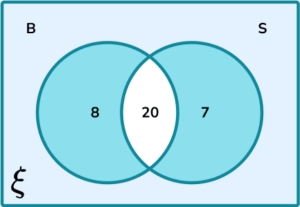
The frequency of people who have a bath or a shower but not both is 8 + 7 = 15.
The total number of people asked is 8+20+7=35.
The probability of choosing someone at random who likes ham and cheese toasties is therefore \frac{15}{35}=\frac{3}{7}
4. A couple want to buy a horse. They would like to buy a horse that is A= {athletic}, B= {blue eyes}, C= {piebald cob}. They record the frequencies of their search into a Venn diagram.
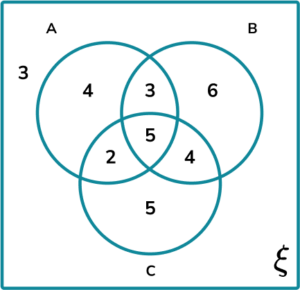
Calculate the probability of them buying a horse that has only one of the three requirements.
The subsets within the Venn diagram that contain only one of the three requirements are:
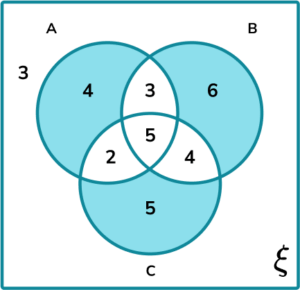
The frequency of horses in the subset is 4+6+5=15.
The total number of horses is 3+4+3+6+2+5+4+5=32.
The probability of buying a horse that has at least one of the three requirements is therefore \frac{15}{32}.
5. A vexillologist collects flags. He wants to analyse the contents of the flags in his collection into the following three sets:
- A= {Stars}
- B= {Stripes}
- C= {An Image}
He writes up his findings in a Venn diagram.
Calculate P(B \text{ given } (A\cup{B}).
The frequencies in each subset are:
B\cap{(A\cup{B})}:
A\cup{B}:
We therefore have:
P(B \text{ given } {(A\cup{B})})=\frac{P(B\cap{(A\cup{B})})}{P(A\cup{B})}=\frac{23}{37}.
6. A cafe serves breakfast butties. They count the frequency of butties that were made throughout the week with each ingredient:
- B= {Bacon}
- E= {Egg}
- S= {Sausage}
The results are written into a Venn diagram.
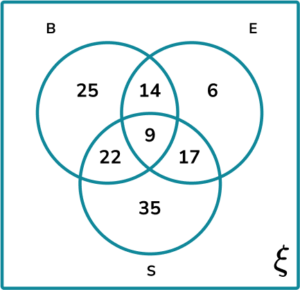
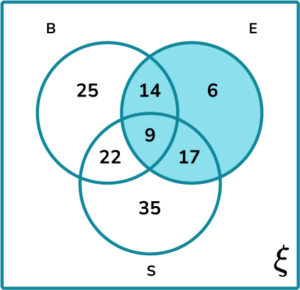
Calculate the probability the butties contain bacon and eggs given that they contain eggs.
The frequencies in each subset are:
(B\cap{E})\cap{E}:
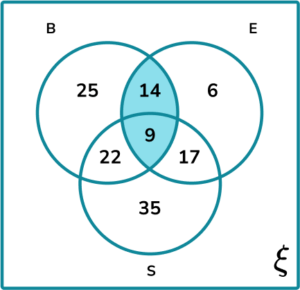
E:
We therefore have:
P(B\cap{E}\text{ given }{E})=\frac{P((B\cap{E})\cap{E})}{P(E)}=\frac{14+9}{14+9+17+6}=\frac{23}{46}=\frac{1}{2}.
Venn diagram probability GCSE questions
1. A reptile house records the toxicity of their 121 different species of wildlife into the Venn diagram below. The two sets represent whether the animal is V= {venomous} or P= {poisonous}.
The Asian Tiger snake is the only animal that is both venomous and poisonous.
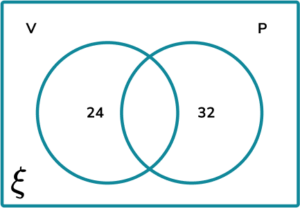
(a) Complete the Venn diagram.
(b) An animal breaks out of a vivarium. What is the probability that this species is venomous?
(3 marks)
(a)
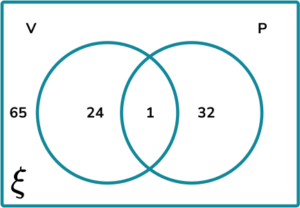
1 written in the intersection
(1)
65 written in the universal set
(1)
(b)
\frac{25}{121}
(1)
2. (a) A car salesman is researching the number of cars in the area that are either E= {Electric} or P= {Petrol}. He displays the results into the Venn diagram.
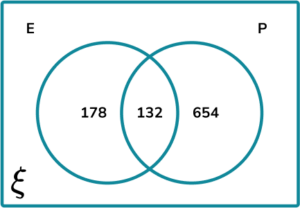
How many cars were recorded in the Venn diagram?
(b) Calculate the probability of P\cap{E} given P. Write your answer as a fraction in the simplest form.
(5 marks)
(a)
178 + 132 + 654 = 964
(1)
(b)
P(P\cap{E}\text{ given }{P})=\frac{P((P\cap{E})\cap{P})}{P(P)}
(1)
(P\cap{E})\cap{P}=132\text{ and }P=654+132=786(1)
P(P\cap{E}\text{ given }{P})=\frac{132}{786}(1)
\frac{132}{786}=\frac{22}{131}(1)
3. 20,000 people participated in a local marathon. The Venn diagram below splits all of the participants into the three sets: C= {Completed}, F= {Fancy Dress} and R= {Ran all of the way}.
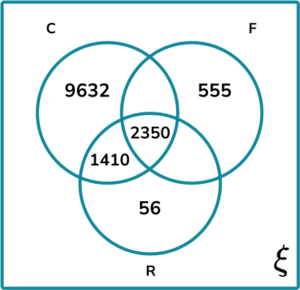
(a) Given that 40\% of participants wore fancy dress, and 90\% of all runners completed the marathon, complete the Venn diagram.
(b) Calculate P(C\text{ given } {F}\cap{R}) correct to 2 decimal places.
(7 marks)
(a)
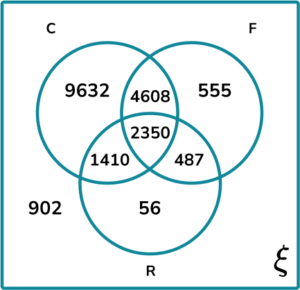
4608 written in the intersection of Completed and wore Fancy dress
(1)
487 written in the intersection of Fancy dress and Ran
(1)
902 written in the universal set outside of set C, F, and R
(1)
(b)
P(C\text{ given } {F}\cap{R})=\frac{P(C\cap(F\cap{R}))}{P(F\cap{R})}
(1)
C\cap(F\cap{R})=2350\text{ and }F\cap{R}=2350+487=2837
(1)
P(C\text{ given }{F}\cap{R})=\frac{2350}{2837}
(1)
\frac{2350}{2837}=0.83\text{ (2dp)}
(1)
Learning checklist
You have now learned how to:
The next lessons are
Still stuck?
Prepare your KS4 students for maths GCSEs success with Third Space Learning. Weekly online one to one GCSE maths revision lessons delivered by expert maths tutors.

Find out more about our GCSE maths tuition programme.