GCSE Tutoring Programme
Our chosen students improved 1.19 of a grade on average - 0.45 more than those who didn't have the tutoring.
In order to access this I need to be confident with:
Coordinates maths Substitution Arithmetic Reciprocal mathsThis topic is relevant for:

Linear Graph
Here we will learn about linear graphs, including plotting linear graphs, using the equation of a straight line and parallel and perpendicular lines.
You can also download the following free linear graph resources all suitable for those following Edexcel, AQA or OCR exam boards:
What is a linear graph?
A linear graph is a straight line graph which represents a linear relationship between two variables. Linear graphs help us to illustrate how the relationship between these variables changes over time.
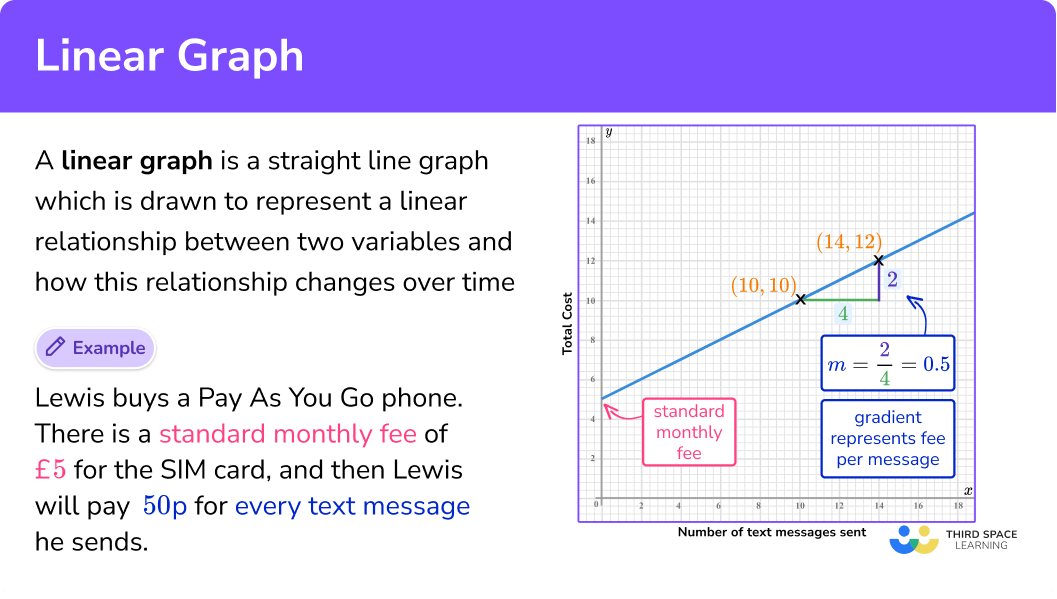
For example, Lewis buys a pay as you go phone. There is a standard monthly fee of £5 for the SIM card, and then Lewis will pay 50p for every text message he sends. This can be represented as a linear graph.
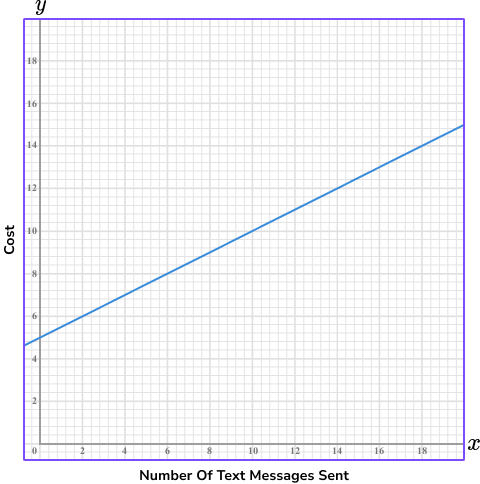
The standard monthly fee of £5 is the y -intercept and the 50p charge per text message is the gradient (slope) of the line.
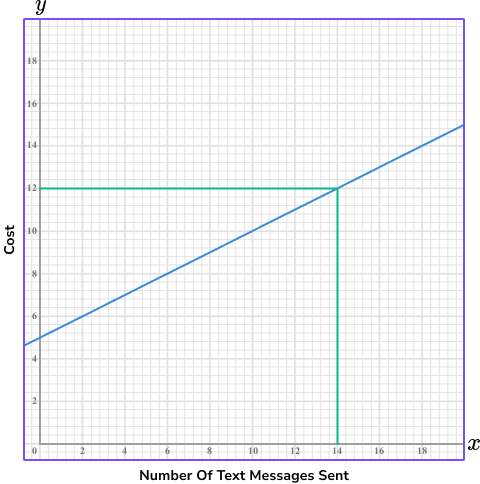
From this graph, we can predict Lewis’ monthly phone bill using the number of text messages he sends.
For example, if Lewis sends 14 text messages, he will pay a total of £12.
What is a linear graph?
Drawing linear graphs
In order to draw linear graphs (also known as graphs of linear equations) we need to generate pairs of coordinates to plot onto a set of axes.
To generate these we substitute given x values into the equation of the linear graph to work out the corresponding y values. Once we have generated the coordinates, we plot these as a graph.
For example,
y=x+2.

Step-by-step guide: Equation of a line
How to draw a linear graph
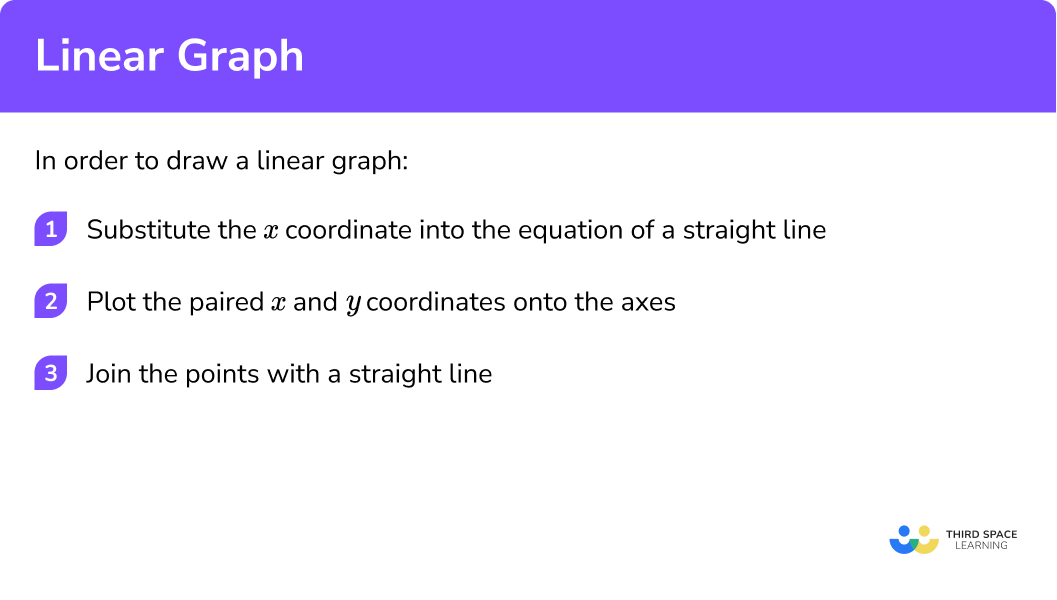
In order to draw a linear graph:
- Substitute the \textbf{x} coordinate into the equation of a straight line.
- Plot the paired \textbf{x} and \textbf{y} coordinates onto the axes.
- Join the points with a straight line.
Explain how to draw a linear graph
Straight line graph worksheet (includes linear graph)
Get your free linear graph worksheet of 20+ straight line graph questions and answers. Includes reasoning and applied questions.
DOWNLOAD FREE Straight line graph worksheet (includes linear graph)
Get your free linear graph worksheet of 20+ straight line graph questions and answers. Includes reasoning and applied questions.
DOWNLOAD FREERelated lessons on straight line graphs
Linear graph is part of our series of lessons to support revision on straight line graphs. You may find it helpful to start with the main straight line graphs lesson for a summary of what to expect, or use the step by step guides below for further detail on individual topics. Other lessons in this series include:
Linear graph examples
Example 1: drawing linear graphs
Draw the graph of the equation y=3x+1 for all values of x from -2 to 2.
- Substitute the \textbf{x} coordinate into the equation of a straight line.

2Plot the paired \textbf{x} and \textbf{y} coordinates onto the axes.
3Join the points with a straight line.
Example 2: drawing linear graphs
Draw the graph of the equation y=2x-3 for all values of x from -2 to 2.


Example 3: drawing linear graphs
Draw the graph of the equation y=5-x for all values of x from -2 to 2.

Gradient of a linear graph
The gradient of a linear graph tells us how steep the line is. The higher the gradient, the steeper the line. If the gradient is positive, the line goes up, from left to right. If the gradient is negative, the line goes down, from left to right.
For example, the linear graph below has a positive gradient. It moves in an upward direction, from left to right.
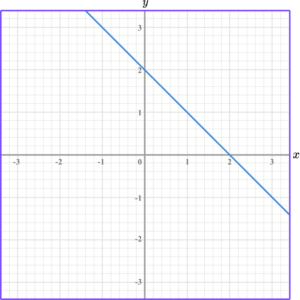
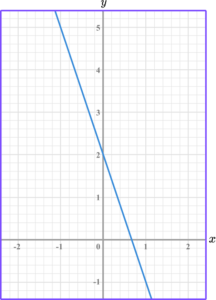
This linear graph has a negative gradient. It moves in a downwards direction, from left to right.
Step-by-step guide: Gradient of a line
How to find the gradient from a linear graph
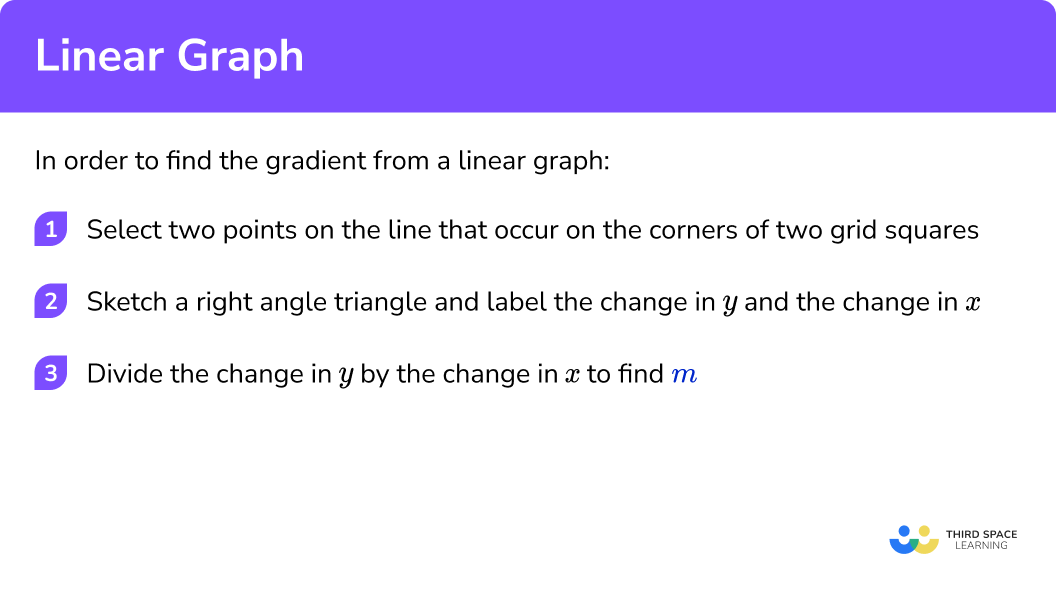
In order to find the gradient from a linear graph:
- Select two points on the line that occur on the corners of two grid squares.
- Sketch a right angle triangle and label the change in \textbf{y} and the change in \textbf{x}.
- Divide the change in \textbf{y} by the change in \textbf{x} to find \textbf{m}.
Explain how to find the gradient from a linear graph
Gradient of a linear graph examples
Example 4: gradient of a positive linear graph
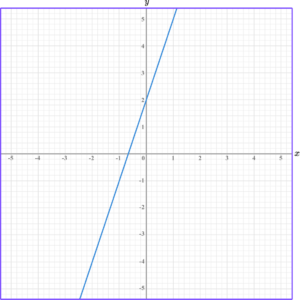
Find the gradient of the linear graph below.
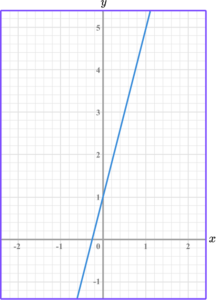
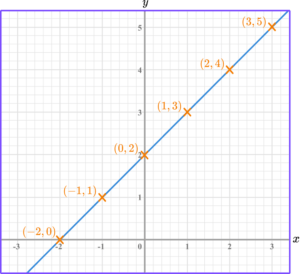
Find two coordinates, that are integers (whole numbers), and lie on the straight line.
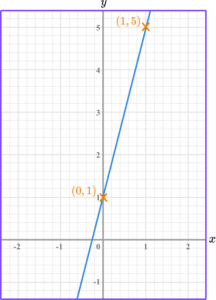
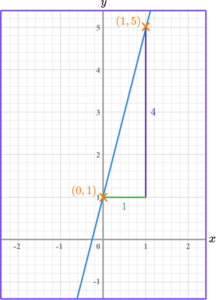
The change in y is y_2-y_1=5-1=4.
The change in x is x_2-x_1=1-0=1.
The formula for the gradient of a linear graph is
\text { gradient }=\frac{y_2-y_1}{x_2-x_1}.
So, we do the change in y \ \div change in x.
For this linear graph, the gradient is 4 \div 1=4.
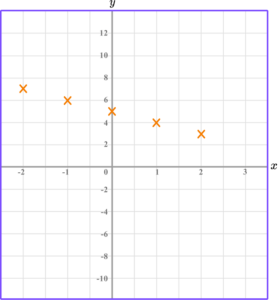
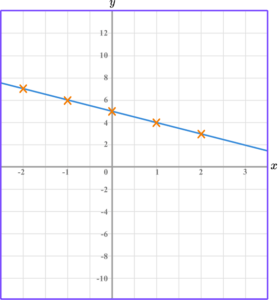
Example 5: gradient of a negative linear graph
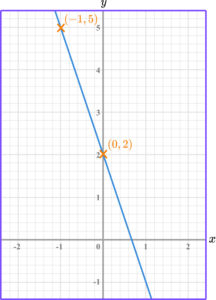
Find the gradient of the linear graph below.
Find two coordinates, that are integers (whole numbers), and lie on the straight line.
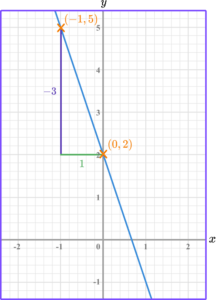
The change in y is y_2-y_1=2-5=-3.
The change in x is x_2-x_1=0--1=1.
The formula for the gradient of a linear graph is
\text { gradient }=\frac{y_2-y_1}{x_2-x_1}.
So, we do the change in y \ \div change in x.
For this linear graph, the gradient is -3 \div 1=-3.
Equation of a linear graph
A linear graph is a visual representation of a linear function. All linear graphs can be written as linear equations. These equations take the general form
y=mx+c.
Where m is the gradient of the line and c is the \textbf{y} -intercept.
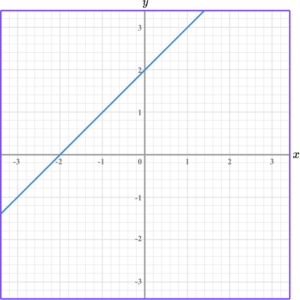
For example,
y=3x+2.
Here we can see that the gradient is 2, and the y -intercept is at +2.
The graph of this equation would look like this,
Step-by-step guide: Equation of a line
How to find the equation of a linear graph
In order to find the equation of a linear graph:
- Calculate the gradient of the line.
- State the \textbf{y} -intercept of the straight line.
- Write the equation of the line in the form \bf{y=mx+c.}
Explain how to find the equation of a linear graph
Finding the equation of a linear graph examples
Example 6: finding the equation of a linear graph
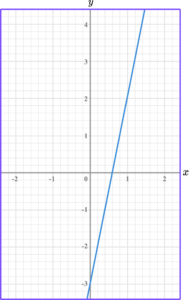
Write the equation of the linear graph below in the form y=mx+c.
The formula for the gradient of a linear graph is
\text { gradient }=\frac{y_2-y_1}{x_2-x_1}
So, we do the change in y \ \div change in x.
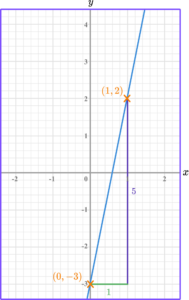
For this linear graph, the gradient is 5 \div 1=5.
The y -intercept is where the linear graph crosses the y -axis.
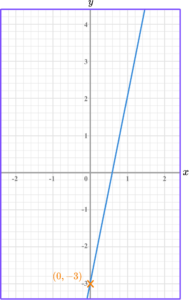
In this instance, the linear graph crosses the y -axis at -3.
Equations of linear graphs take the general form y=mx+c.
Where m is the gradient of the line and c is the y -intercept.
Hence, the equation of the line is y=5x-3.
Parallel and perpendicular lines
Parallel lines are lines that travel in exactly the same direction, remaining equidistant from each other, therefore never meet. The gradients of parallel lines are equal.
For example,
Perpendicular lines are lines that intersect at 90 \degree to each other. The gradients of perpendicular lines are the negative reciprocals of each other. In other words, they multiply together and give a product of -1.
For example,
Step-by-step guide: Parallel and perpendicular lines
How to identify lines parallel or perpendicular to a linear graph
In order to identify lines that are parallel or perpendicular to a linear graph:
- Calculate the gradient of both lines.
- Compare the gradients.
- State whether the lines are parallel, perpendicular or neither.
Explain how to identify lines parallel or perpendicular to a linear graph
Identifying parallel and perpendicular examples
Example 7: identifying parallel lines
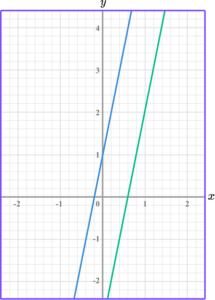
Show that the linear graphs below are parallel.
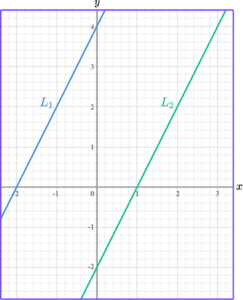
The gradient of L_1 is 4 \div 2=2.
The gradient of L_2 is 4 \div 2=2.
Both lines have the same gradient, 2.
Hence, lines L_1 and L_2 are parallel.
Example 8: identifying perpendicular lines
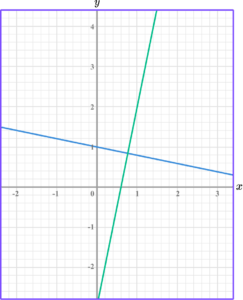
Show that the linear graphs below are perpendicular.
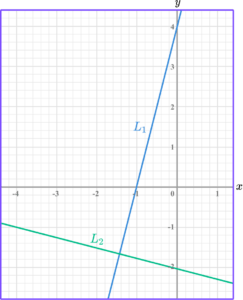
The gradient of L_1 is 4 \div 1=4.
The gradient of L_2 is -1 \div 4=-\frac{1}{4}.
The gradients are not the same, so the lines are not parallel.
4 \times -\frac{1}{4}=-1
Hence, lines L_1 and L_2 are perpendicular.
Common misconceptions
- Confusing \textbf{x} and \textbf{y} coordinates
When plotting coordinates, they are in the form (x, \ y).
For example, the coordinate (4, \ 3) would be plotted at the point where 4 on the x -axis and 3 on the y -axis intersect.
- Recognising algebraic notation
When substituting values to generate the coordinates for plotting linear graphs, remember 3x = 3 \times x. Inversely, \frac{x}{3}=x \div 3.
Practice linear graph questions
1. Complete the table of values to generate the coordinates for a linear graph with the equation y=4x+2.


y=4x+2 is the equation of the linear graph.
Substituting the x values into the equation, generates the corresponding y values.
\begin{aligned} &y=(4 \times -2)+2=-6 \\\\ &y=(4 \times -1)+2=-2 \\\\ &y=(4 \times 0)+2=2 \\\\ &y=(4 \times 1)+2=6 \\\\ &y=(4 \times 2)+2=10 \end{aligned}
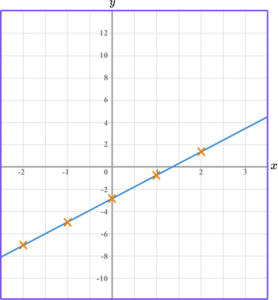
2. Complete the table of values to generate the coordinates for a linear graph with the equation y=2x-1.


y=2x-1 is the equation of the linear graph.
Substituting the x values into the equation, generates the corresponding y values.
\begin{aligned} &y=(2 \times -2)-1=-5\\\\ &y=(2 \times -1)-1=-3 \\\\ &y=(2 \times 0)-1=-1 \\\\ &y=(2 \times 1)-1=1 \\\\ &y=(2 \times 2)-1=3 \end{aligned}
3. Find the gradient of the linear graph below.
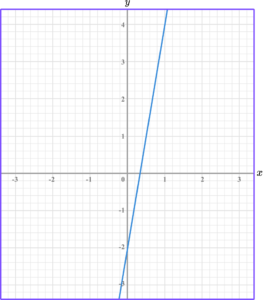
The change in y is y_2-y_1=4- -2=6.
The change in x is x_2-x_1=1-0=1.
The formula for the gradient of a linear graph is
\text { gradient }=\frac{y_2-y_1}{x_2-x_1}.
So, we do the change in y \ \div change in x.
For this linear graph, the gradient is 6 \div 1=6.
4. Write the equation of the linear graph below in the form y=mx+c.
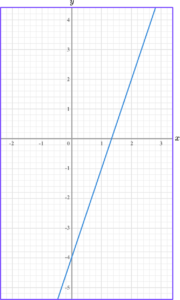
The y -intercept is -4.
The gradient is 3.
The equation of the linear graph is y=3x-4.
5. Write the equation of the linear graph below in the form y=mx+c.
The y -intercept is 5.
The gradient is 2.
The equation of the linear graph is y=2x+5.
6. Which equation of a linear graph is parallel to y=6x-1?
Parallel lines have the same gradient. The gradient of the linear graph y=6x-1 is 6, so the equation which is parallel from the line is y=6x+10.
Linear graph GCSE questions
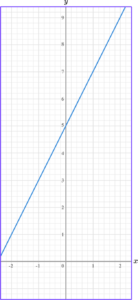
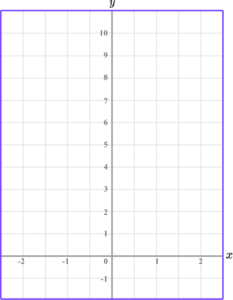
1. (a) Complete the table of values for y=2x+5.

(b) On the grid, draw the graph of y=2x+5 for values of x from -2 to 2.
(4 marks)
(a)

1 correct value.
(1)
All 3 correct values.
(1)
(b)
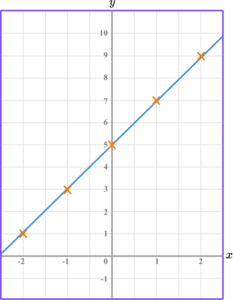
All coordinates plotted correctly.
(1)
Straight line drawn connecting all coordinates.
(1)
2. Write the equation of the linear graph below in the form y=mx+c.
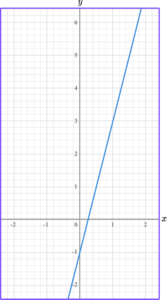
(3 marks)
Gradient identified as 4.
(1)
y -intercept identified as -1.
(1)
y=4x-1(1)
3. Write down the equation of a line parallel to y=3x+2.
(1 mark)
Any equation written in the form y=mx+c starting y=3x.
(1)
Learning checklist
You have now learned how to:
The next lessons are
Still stuck?
Prepare your KS4 students for maths GCSEs success with Third Space Learning. Weekly online one to one GCSE maths revision lessons delivered by expert maths tutors.

Find out more about our GCSE maths tuition programme.