GCSE Tutoring Programme
Our chosen students improved 1.19 of a grade on average - 0.45 more than those who didn't have the tutoring.
In order to access this I need to be confident with:
Arithmetic 2D shapes Types of triangles Types of quadrilaterals Negative numbersThis topic is relevant for:

Coordinates Maths
Here we will learn about coordinates, including the general form of a coordinate, plotting coordinates on different types of axes, determining the coordinates of a point on a coordinate plane, and using coordinates to construct polygons over the four quadrants.
You can also download the following free coordinates maths resources suitable for those following Edexcel, AQA or OCR exam boards:
What are coordinates?
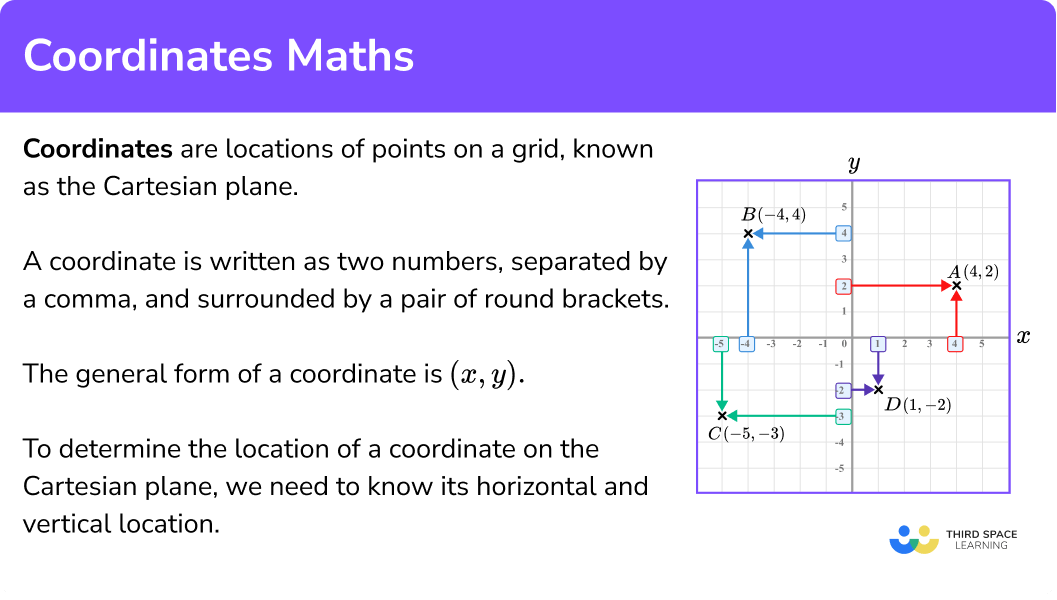
Coordinates are locations of points on a grid known as the cartesian plane.
A coordinate is written as two numbers, separated by a comma, and surrounded by a pair of round brackets.
The general form of a coordinate is (x,y) where the value for x represents the horizontal position of the coordinate, and the value for y represents the vertical position of the coordinate.
For example, the coordinate (3,5) has a horizontal position of 3, and a vertical position of 5.
The \bf{x} -axis and \bf{y} -axis meet at the origin, (0,0) where,
- the x -axis (the horizontal axis) is positive to the right of the origin, and negative to the left of the origin;
- the y -axis (the vertical axis) is positive above the origin, and negative below the origin.
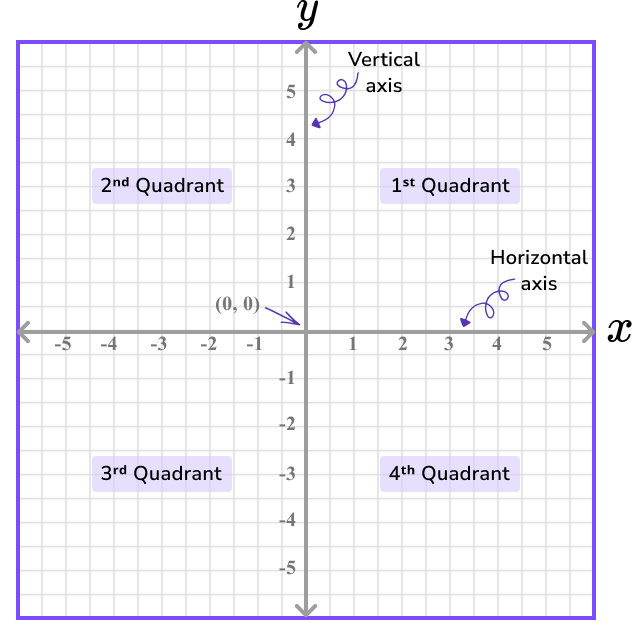
The x -axis is drawn as a horizontal line with an arrow at both ends and is labelled with an x to the right of the grid.
The y -axis is drawn as a vertical line with an arrow at both ends and is labelled with a y at the top of the grid.
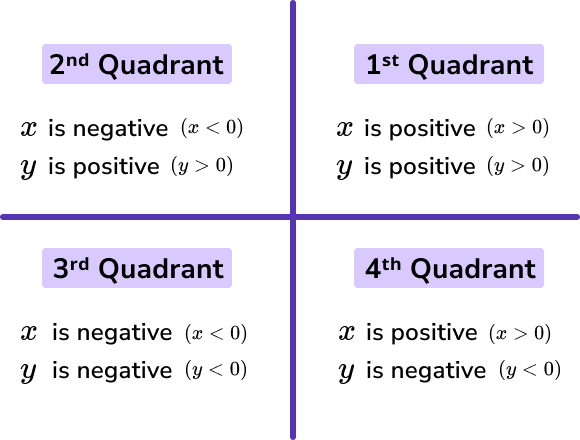
The values of x and y are different in each quadrant.
Below is a description of the polarity of x and y within each quadrant.
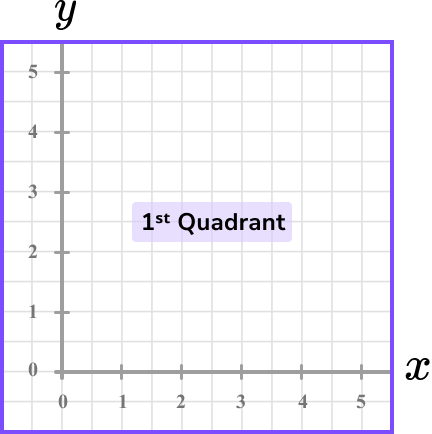
Sometimes we only use the first quadrant. This is informally known as an L -shaped set of axes as the lines for each axis create a capital L.
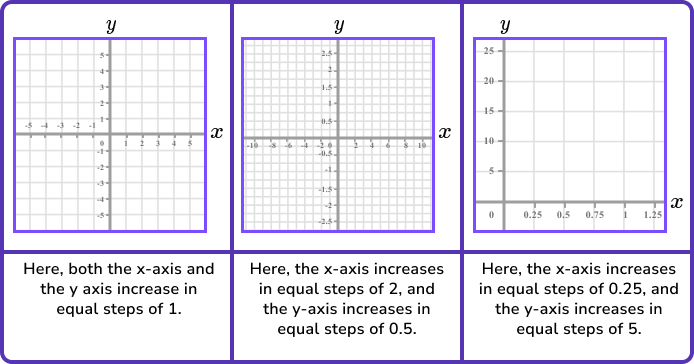
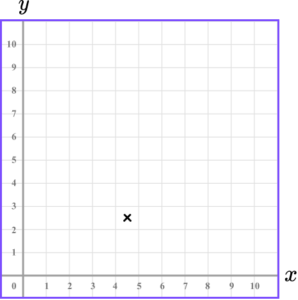
For any set of axes, a scale must be accurately drawn on each axis. The scale must increase in equal steps, but the scale does not have to be the same for each axis.
Here are a few examples of different axes with varying scales,
To determine the location of a coordinate on the cartesian plane, we need to know its horizontal and vertical location. We then express this as an ordered pair of coordinates (x,y).
A coordinate is marked using a cross where the centre of the x is the required point. If the coordinate has been given a label, such as point A, the coordinate is labelled with an A, or an A followed by the coordinate.
Let’s look at an example.
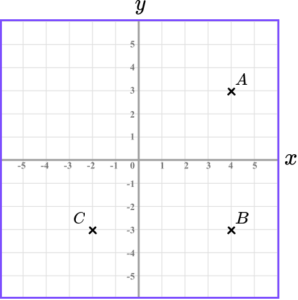
Below is the location of four coordinates on a set of axes, A(4,2), \ B(-4,4), \ C(-5,-3), and D(1,-2). Notice that the first number in the coordinate matches the value on the horizontal axis, and the second number in the coordinate matches the value on the vertical axis.
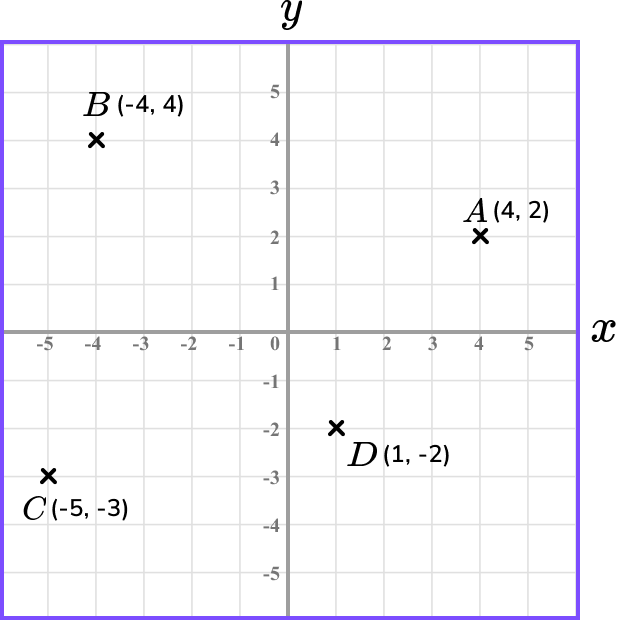
Remember x comes before y in the alphabet and so we write the x -coordinate before the y -coordinate.
What are coordinates?
Plot coordinates
Alongside locating the position of a coordinate, we also need to be able to plot coordinates within all four quadrants.
To do this, we determine the horizontal and vertical position of the coordinate on the set of axes, and follow these values until the two values meet.
For example,
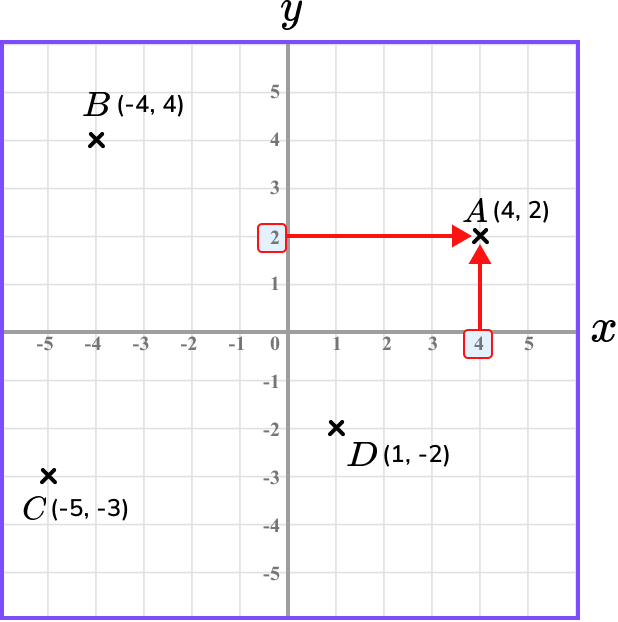
To draw the point A(4,2) we locate 4 in the horizontal x -direction, and then 2 in the vertical y -direction. Following straight lines from these points on the coordinate grid will get us to the coordinate A(4,2).
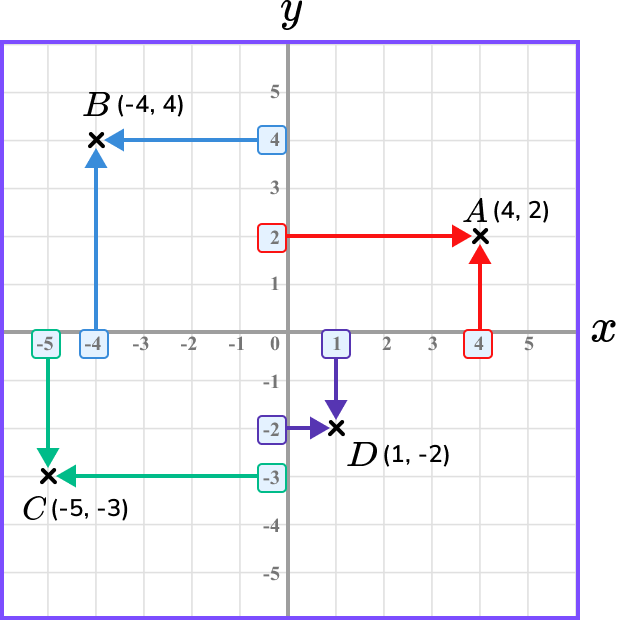
Repeating this process for the other coordinates B, C, and D, we have
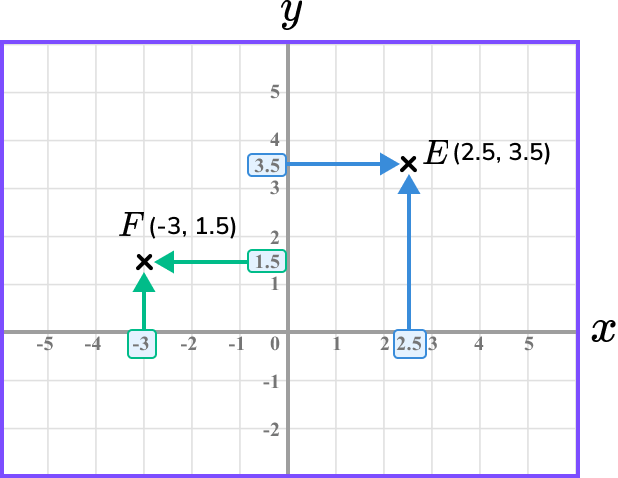
Note, coordinates can have decimal values. It is common to only see integer coordinates that lie on a grid line however, we can also plot coordinates that have a decimal value, such as E(2.5,3.5) and F(-3,1.5). These would lie within or on the edge of a grid square.
Plotting shapes
We can draw 2D objects by plotting a set of coordinates.
For example,
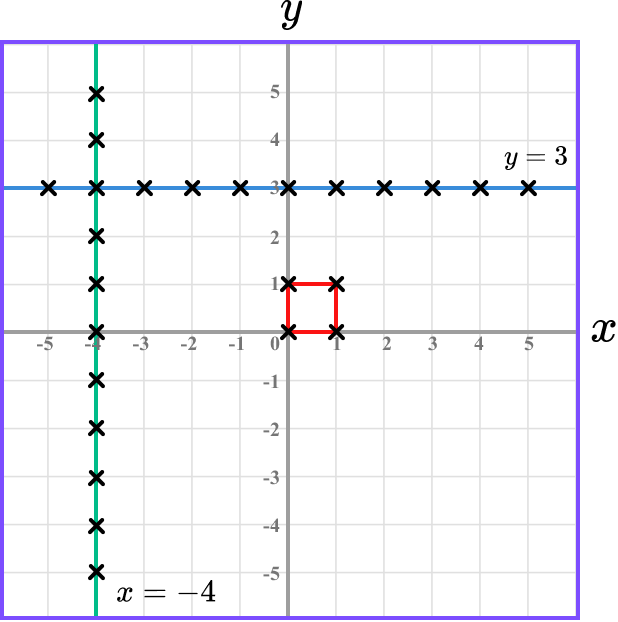
If we plot the coordinates (0,0), \ (1,0), \ (1,1) and (0,1), we get a square.
If we plot points where the y values are equal to 3, we get the straight line y=3 (which is a horizontal line).
If we plot points where the x values are all equal to -4, we get the straight line x=-4 (which is a vertical line).
Joining coordinates that follow a rule can create many different types of graphs, including straight line graphs, reciprocal graphs, parabolas and cubic graphs.
Step-by-step guide: Straight line graphs
Coordinate problem
Sometimes you may be asked to solve problems on a coordinate axes. This could involve plotting points to construct a 2D polygon, finding the midpoint of a line, or calculating the length of a line using Pythagoras’ theorem. All of these can involve a set of axes using all four quadrants and so you need to be confident with locating and plotting coordinates.
Step-by-step guide: Pythagoras’ theorem
Point on a line
A straight line is constructed by joining an infinite number of points that follow a rule (the equation of the straight line).
For example, the points (2,3), \ (4,7) and (10, 19) all lie on the line y=2x-1.
When we draw straight line graphs, every point on the line has an x and y value which obey the rule (equation) of the line.
Given either the x coordinate or the y coordinate of a point on the line, the other coordinate can be found using the equation of the line. We can use this to create a table of pairs of coordinates which can be plotted to form the line.
The point of intersection of two or more lines is the location of the coordinate where the graphs meet.
We can determine this point using a graphical method, however if the grid or scale is not provided, we can solve the equations simultaneously to determine the location of the point of intersection.
Step-by-step guide: Simultaneous equations
How to plot coordinates
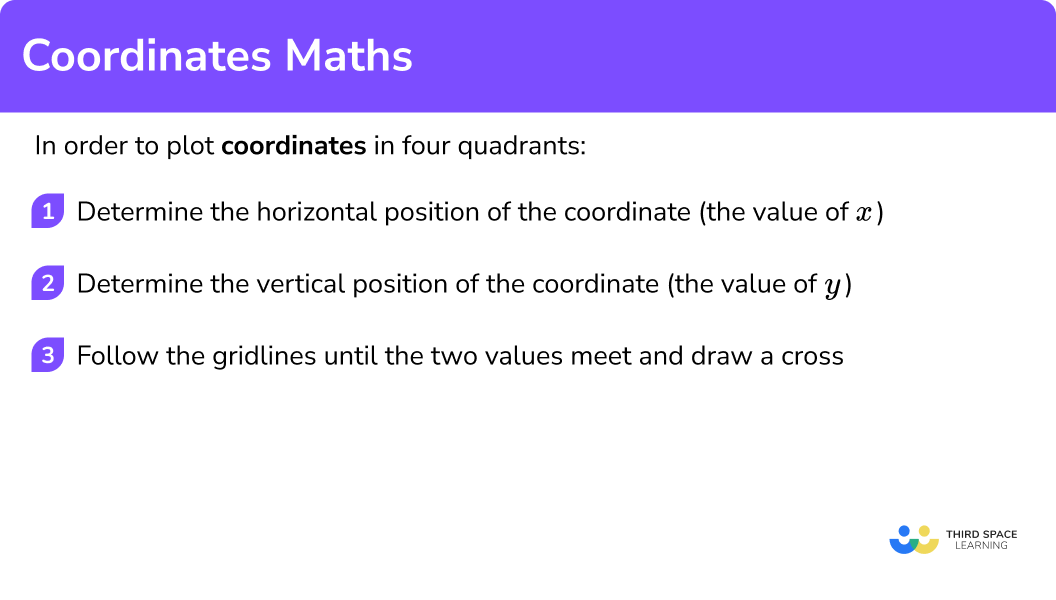
In order to plot coordinates in four quadrants:
- Determine the horizontal position of the coordinate (the value of \bf{x} ).
- Determine the vertical position of the coordinate (the value of \bf{y} ).
- Follow the gridlines until the two values meet and draw a cross.
Explain how to plot coordinates
Coordinates maths worksheet
Get your free coordinates maths worksheet of 20+ questions and answers. Includes reasoning and applied questions.
DOWNLOAD FREE Coordinates maths worksheet
Get your free coordinates maths worksheet of 20+ questions and answers. Includes reasoning and applied questions.
DOWNLOAD FREERelated lessons on straight line graphs
Coordinates maths is part of our series of lessons to support revision on straight line graphs. You may find it helpful to start with the main straight line graphs lesson for a summary of what to expect, or use the step by step guides below for further detail on individual topics. Other lessons in this series include:
Coordinates maths examples
Example 1: plotting coordinates in the first quadrant
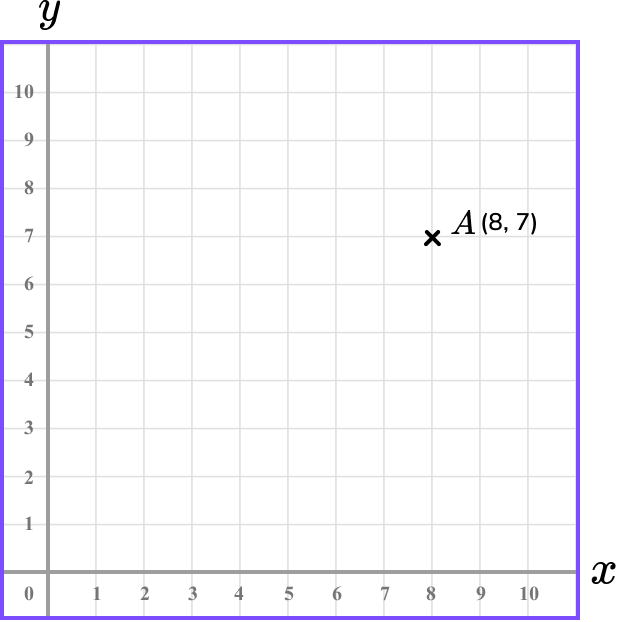
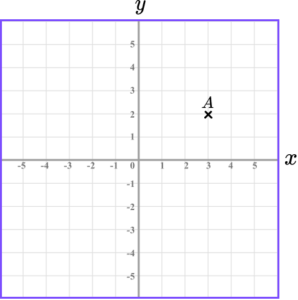
Plot the coordinate A(8,7) on the set of axes below.
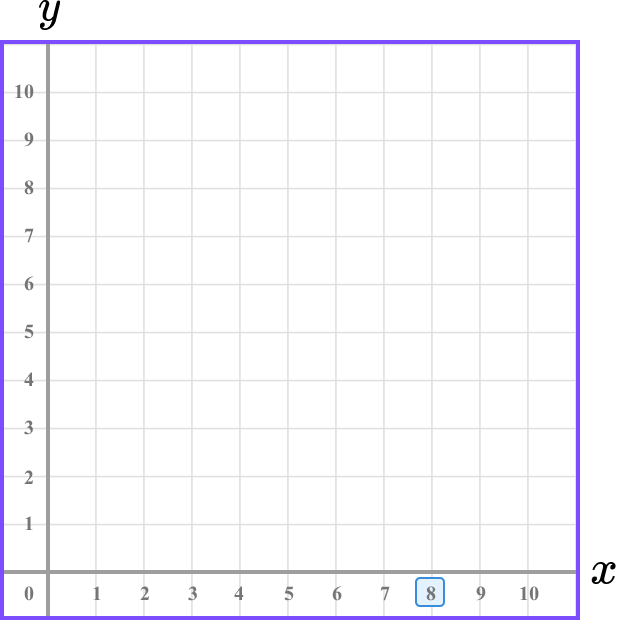
- Determine the horizontal position of the coordinate (the value of \bf{x} ).
The x value is 8 and so we need to locate 8 on the x -axis.
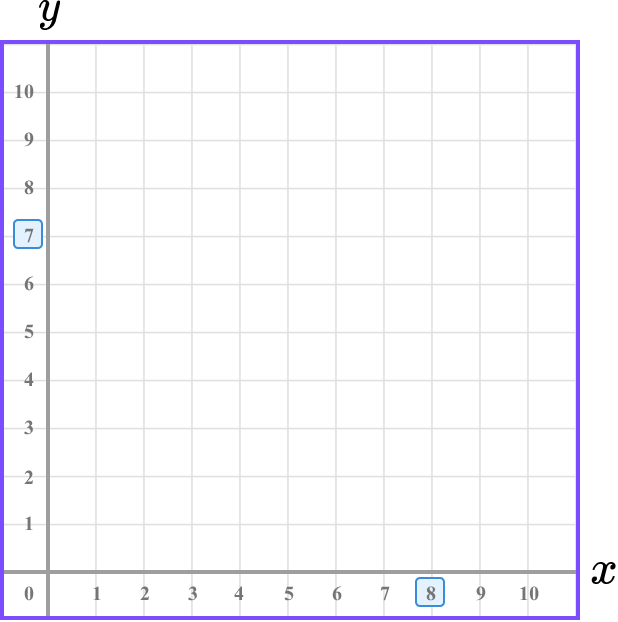
2Determine the vertical position of the coordinate (the value of \bf{y} ).
The y value is 7 and so we need to locate 7 on the y -axis.
3Follow the gridlines until the two values meet and draw a cross.
Following the gridlines, we have
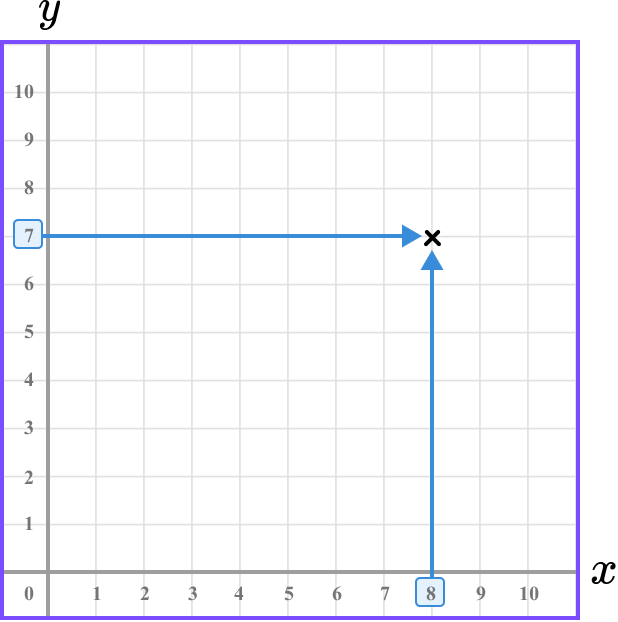
This gives us the final solution.
Example 2: plotting coordinates on the x -axis
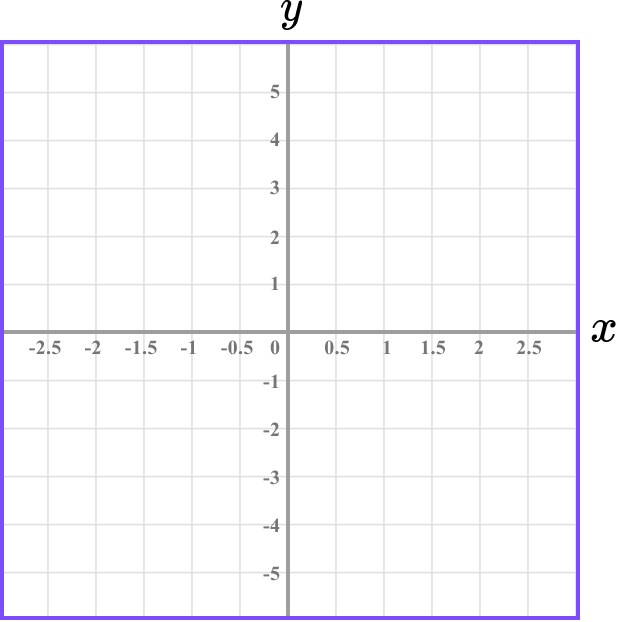
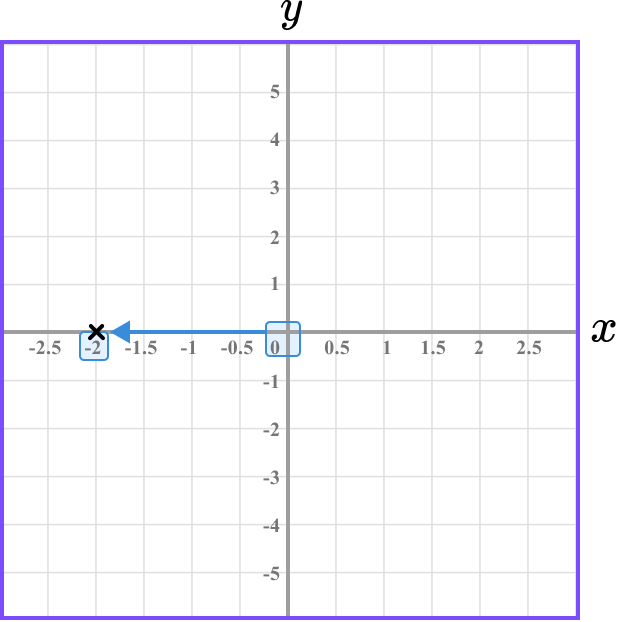
Plot the coordinate B(-2,0) on the set of axes below.
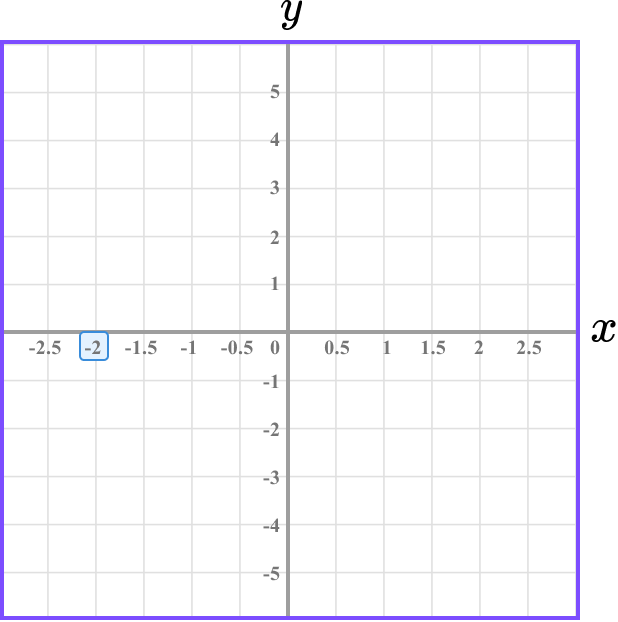
The x value is -2 and so we need to locate -2 on the x -axis.
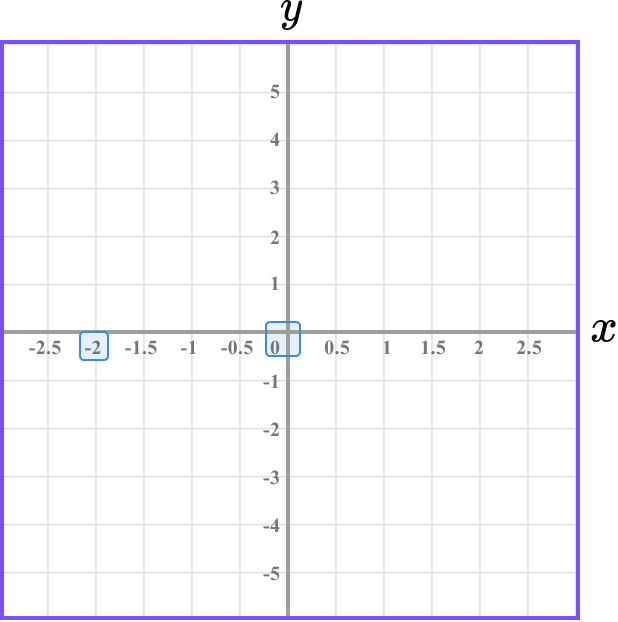
The y value is 0 and so we need to locate 0 on the y -axis.
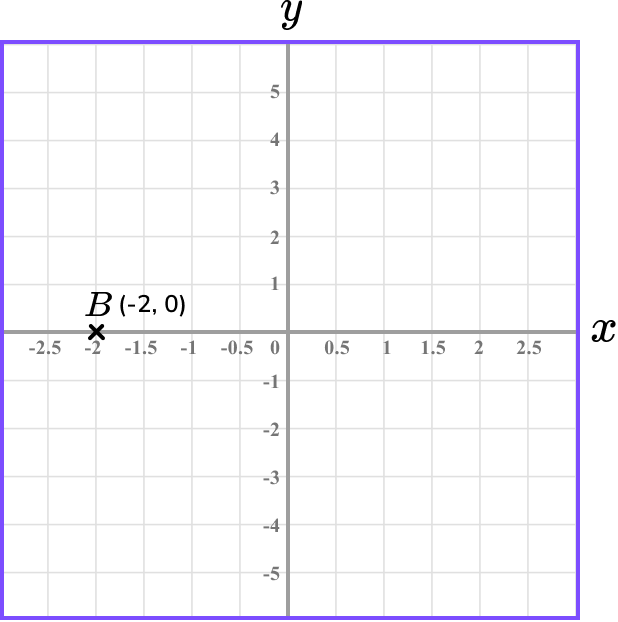
Following the gridlines, we have
This gives us the final solution.
Example 3: plotting coordinates on the y -axis
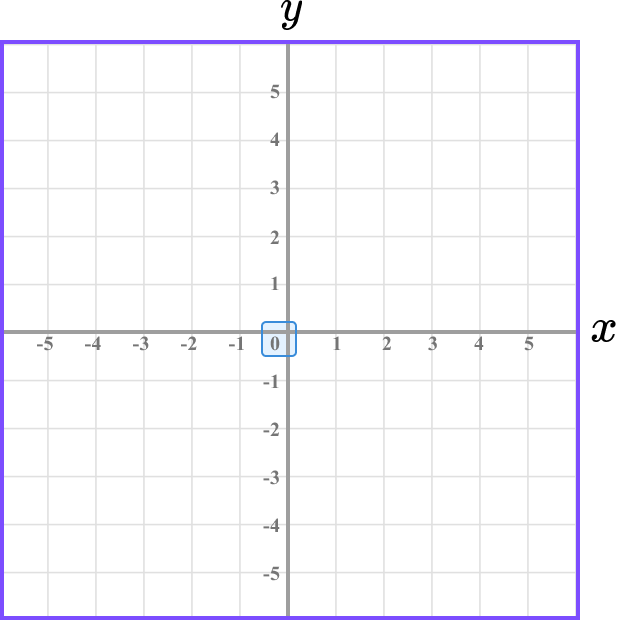
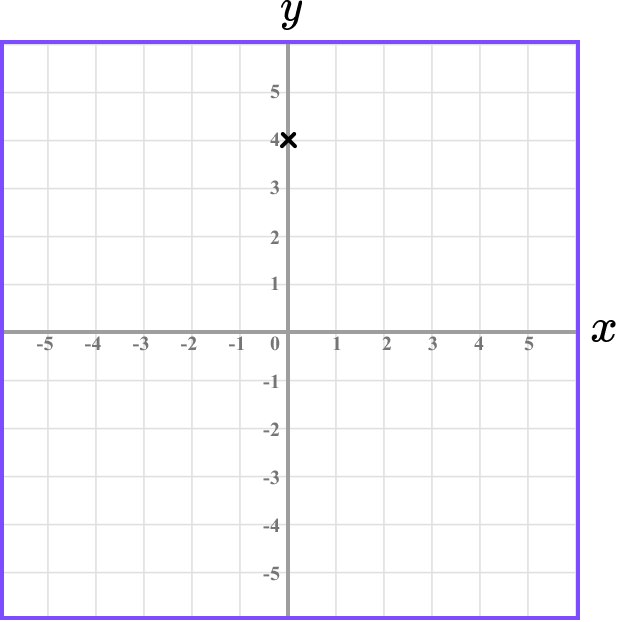
Plot the coordinate C(0,4) on the set of axes below.

The x value is 0 and so we need to locate 0 on the x -axis.
The y value is 4 and so we need to locate 4 on the y -axis.
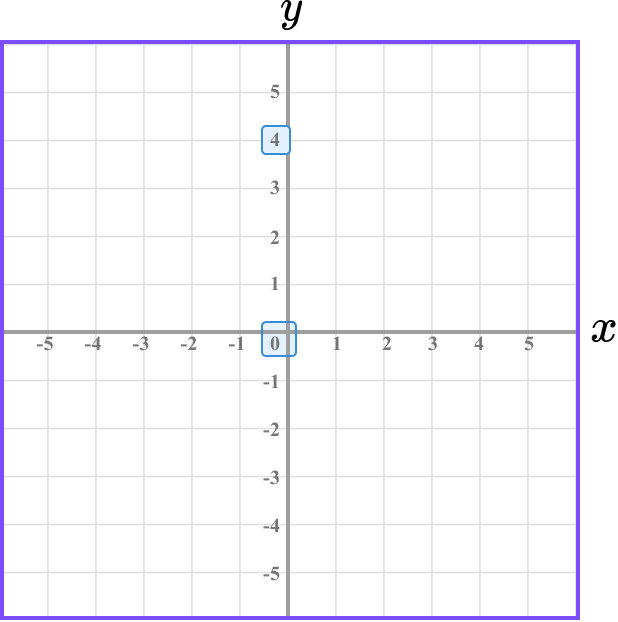
Following the gridlines, we have
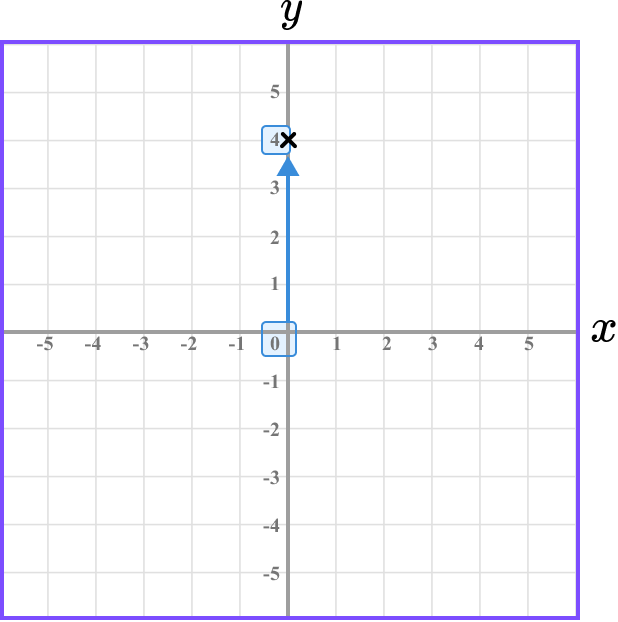
This gives us the final solution.
Example 4: plotting coordinates in three quadrants
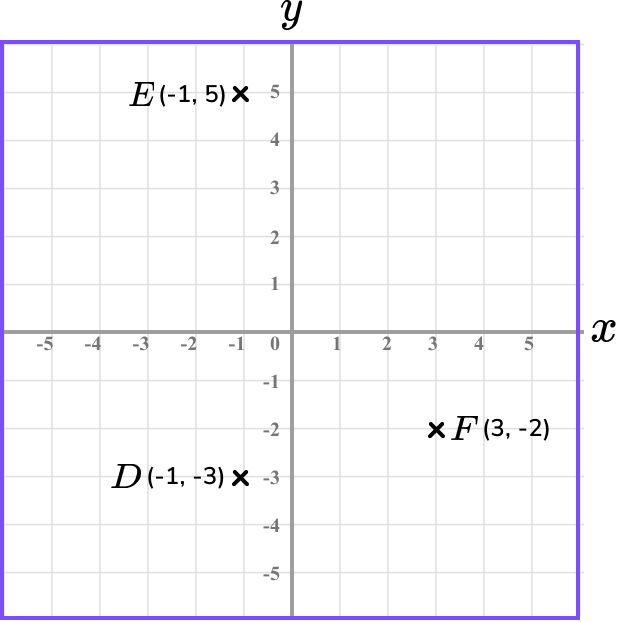
Plot the coordinate D(-1,-3), \ E(-1,5) and F(3,-2) on the set of axes below.

As there are three coordinates to plot, we will plot each point, one at a time.
The x value of the point D is -1 and so we need to locate -1 on the x -axis.
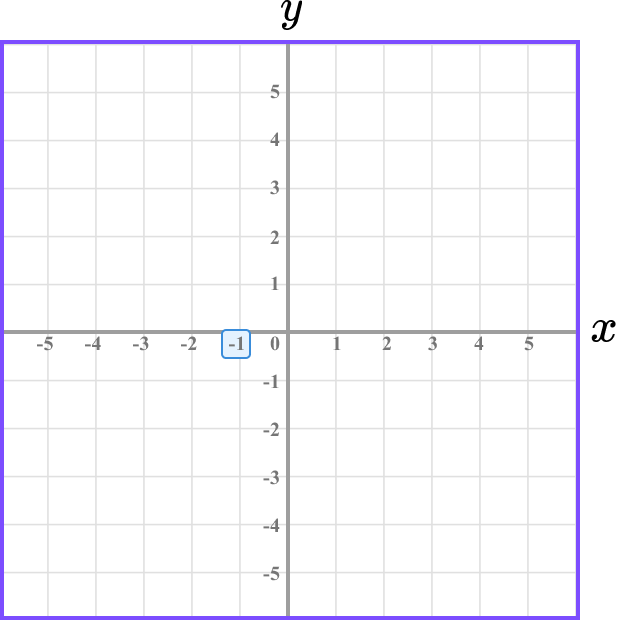
The y value value of the point D is -3 and so we need to locate -3 on the y -axis.
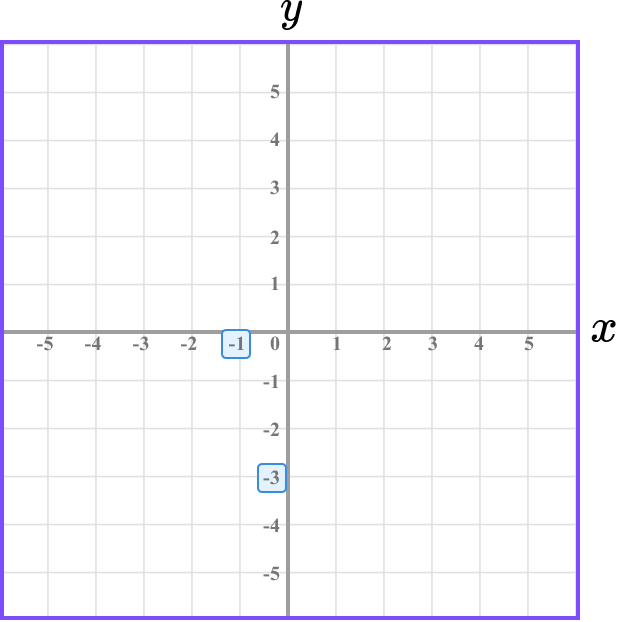
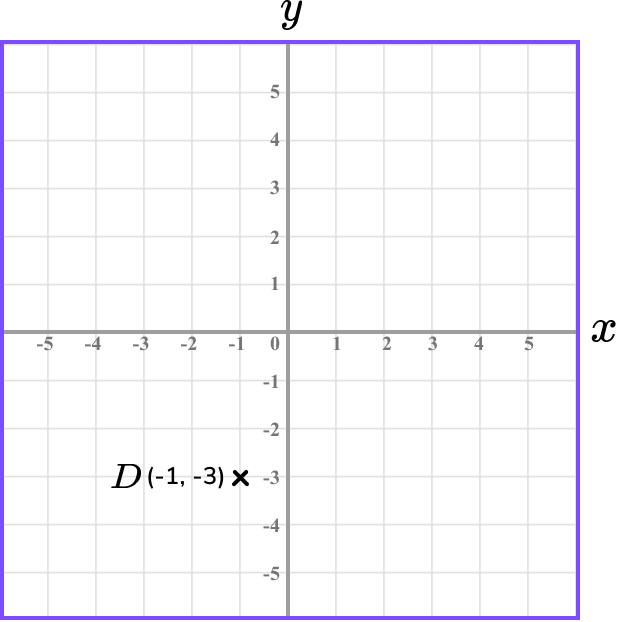
Following the gridlines, we have
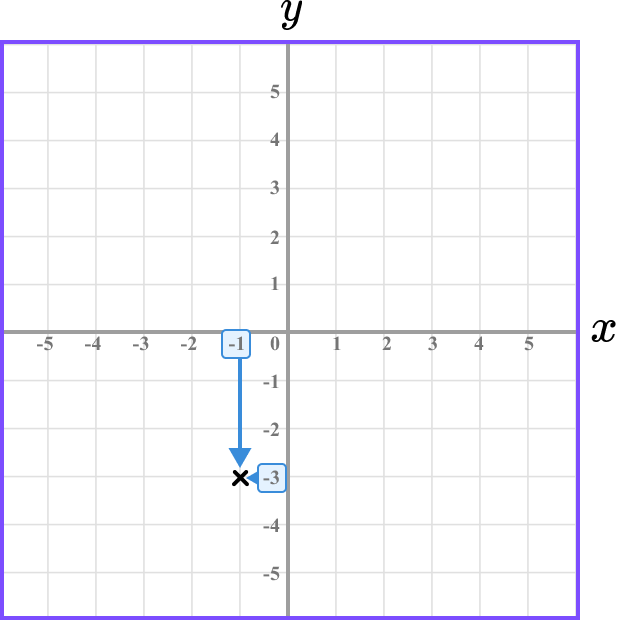
The point D is located here.
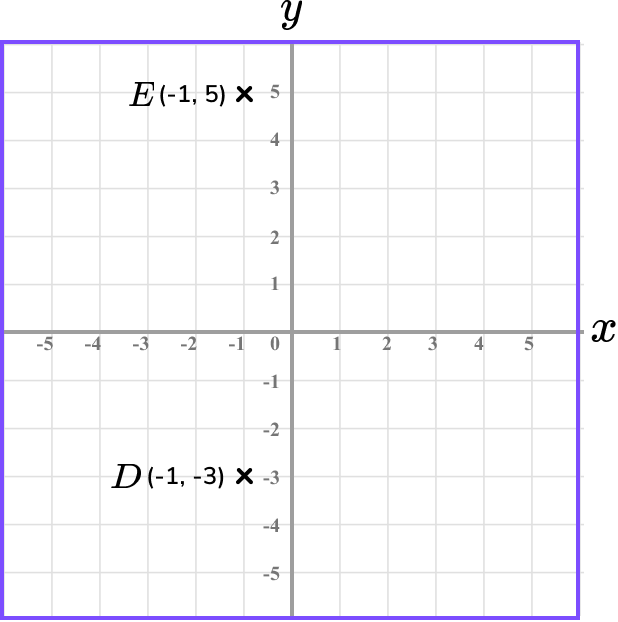
Repeating this process for the point E, we have
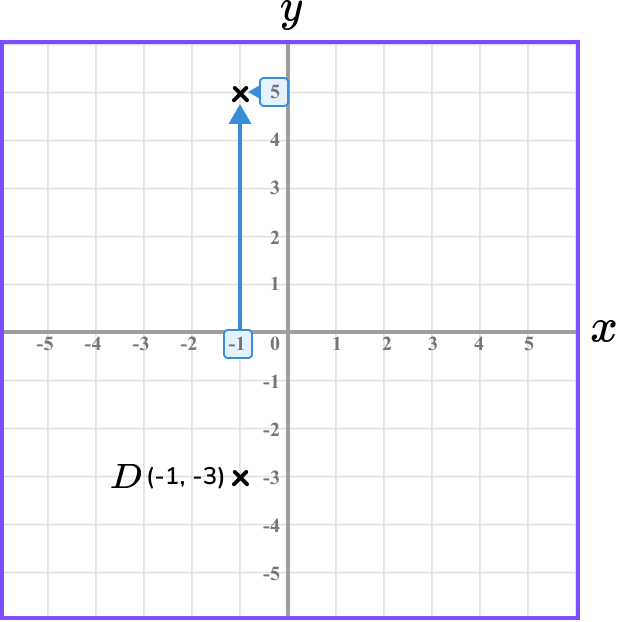
We now have the location of the points D and E.
Repeating the process for the point F, we have
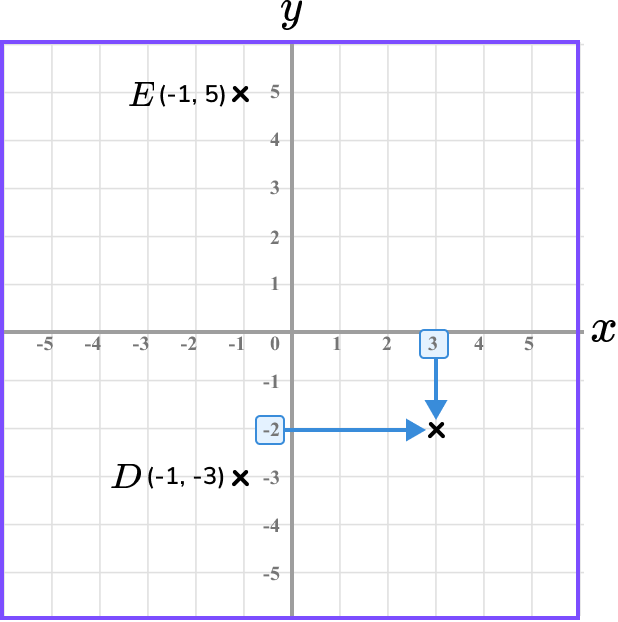
This gives us the final solution.
How to determine the position of a vertex of a polygon on a coordinate axis
In order to determine the position of a vertex of a polygon on a coordinate axis:
- Plot all known coordinates.
- Recall the properties of the polygon.
- Use the properties to locate the required coordinate on the grid.
- State/label the coordinate.
Explain how to determine the position of a vertex of a polygon on a coordinate axis
Example 5: coordinates in the first quadrant (polygon)
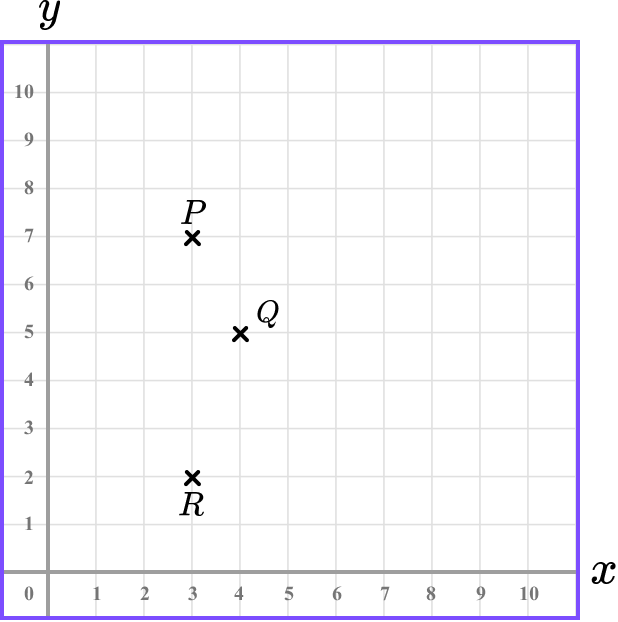
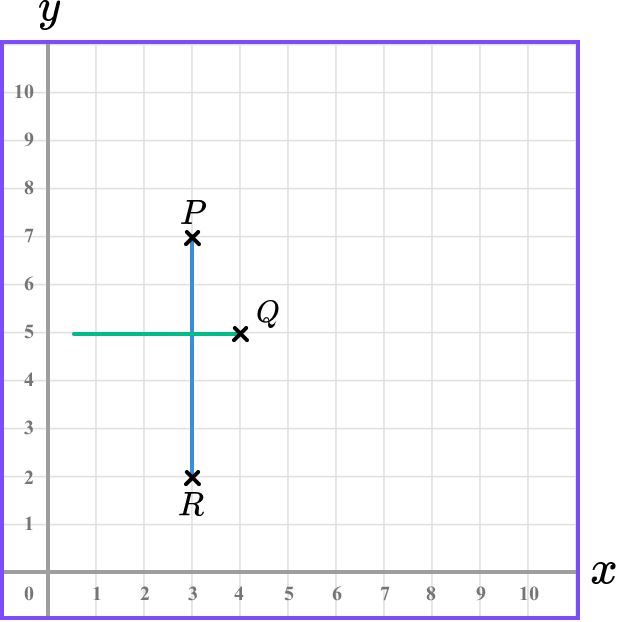
The vertices of a kite are plotted at the coordinates P(3,7), \ Q(4,5), \ R(3,2), and S(x,y). Determine the location of the point S. Use the axes below to help you.

Plotting the three points of P, Q and R, we have
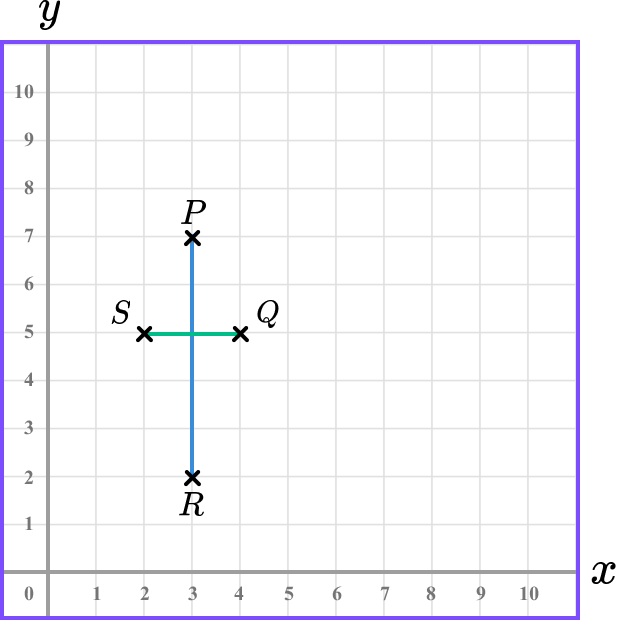
A kite has two pairs of equal sides, two equal angles, one line of symmetry and the diagonals meet at 90 degrees.
Drawing the diagonals onto the grid, we have
As a kite has one line of symmetry, here the line of symmetry must be vertical through the points P and R and so the point S must be the same distance as the point Q from the line of symmetry, along the horizontal diagonal.
This gives us the kite,
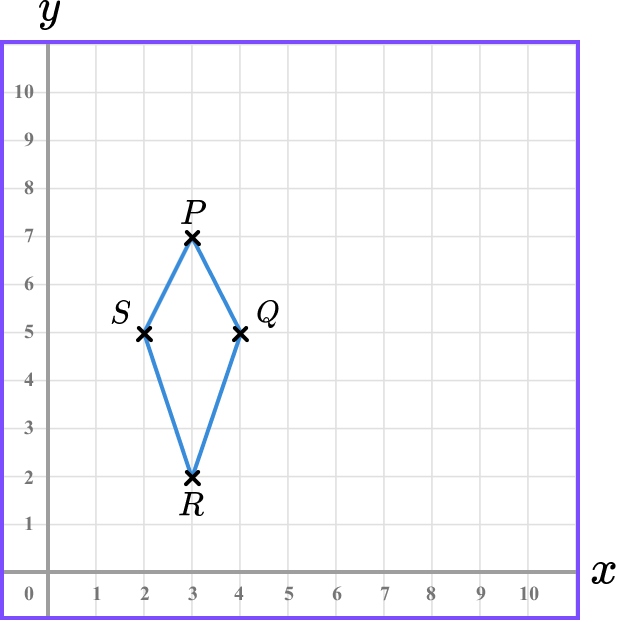
The x value of the coordinate S can be found by looking at the location of the point above the x -axis. Here, we have
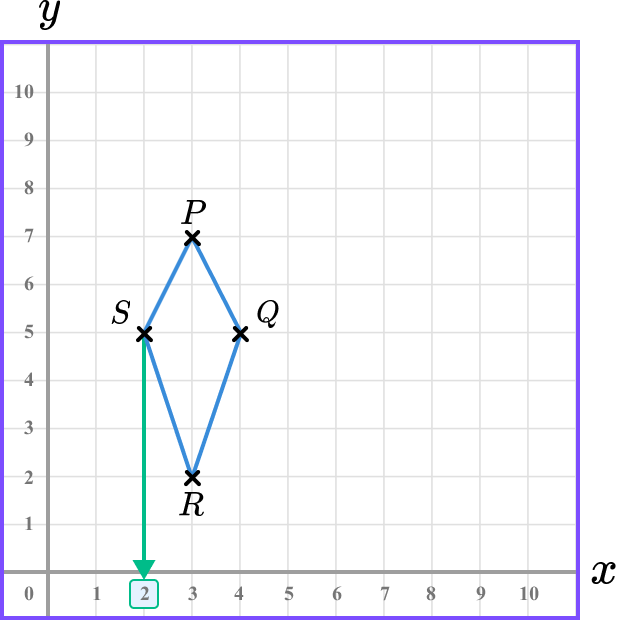
The x value of the coordinate S is 2.
The y value of the coordinate S can be found by looking at the location of the point along the y -axis. Here, we have
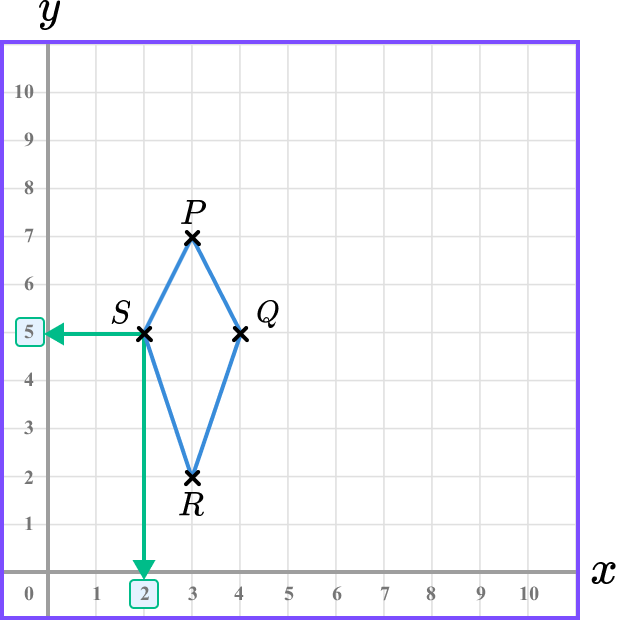
The y value of the point S is 5.
This means that the coordinate of S is S(2,5).
Example 6: coordinates in the first quadrant (polygon)
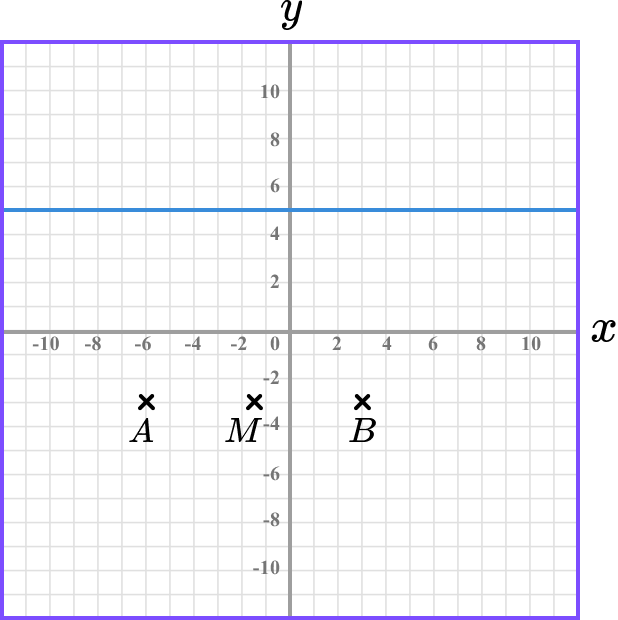
ABC is an isosceles triangle. Given that the three vertices of ABC are A(-6,-3), \ B(3,-3), and C(x,5), determine the value of x at the vertex at C. Use the coordinate axes below to help you.
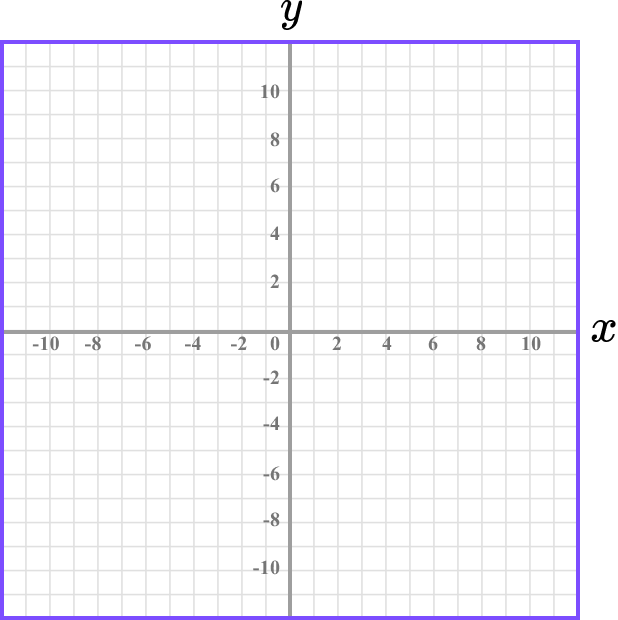
Plotting the two coordinates of A and B we have
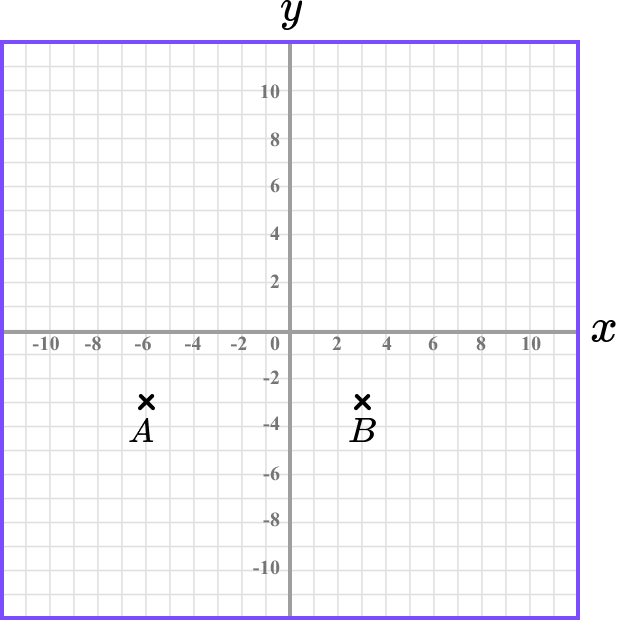
An isosceles triangle has two equal sides, two equal angles and one line of symmetry.
As the y value of the coordinate C is 5, we are looking for a point that lies on the line y=5.
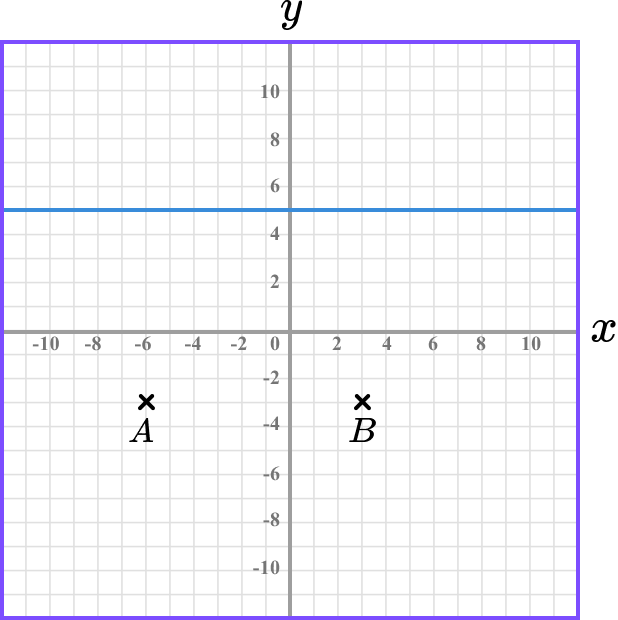
As an isosceles triangle has 1 line of symmetry, if we find the midpoint of the two coordinates A and B, we can see where the line of symmetry and the line y=5 meet.
On the grid, we can see that the midpoint of the two points A and B is the point M(-1.5,-3).
Drawing a vertical line from this point, through the line y=5, we have
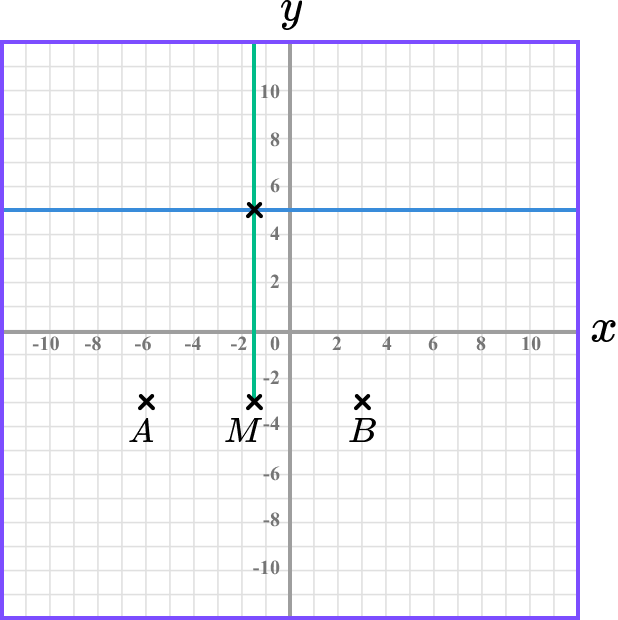
This gives us the location of the point C.
Looking at the values for x and y on each axis, we have to interpret these values as they are not directly labelled.
Each grid square on the x-axis increases in steps of 1. The arrow pointing towards the x -axis is halfway between the two grid squares (-1 and -2) and so this is the value -1.5. The value for x is -1.5.
The arrow pointing towards the y -axis is on the grid line between 4 and 6 and so the value for y is 5.
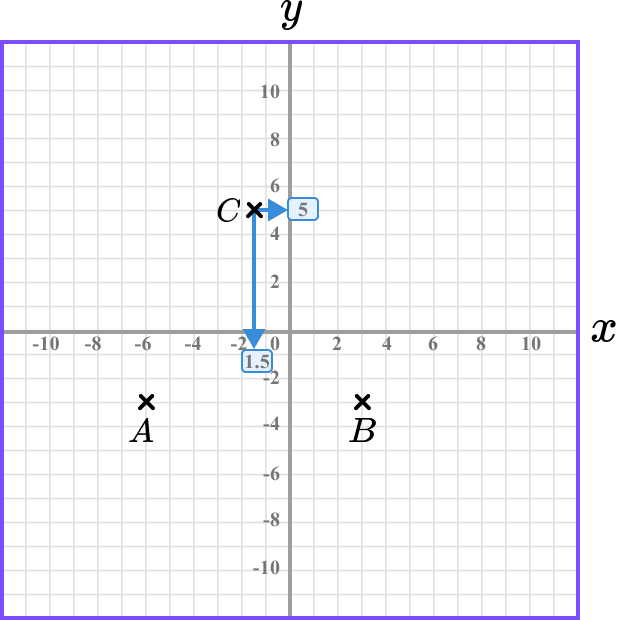
The coordinate of C is C(-1.5, 5).
Common misconceptions
- Mixing up the values in the coordinate
The general form of a coordinate is (x,y) but the coordinate is sometimes misinterpreted as (y,x). In most cases, this will affect the location of the coordinate.
- Between the gridlines
Each axis must contain a scale that increases in equal steps. If a coordinate lies within a grid square, rather than on a gridline, the value is sometimes mistakenly assumed to be the nearest whole number, rather than the decimal value. Remember coordinates can contain decimal values.
- Not using brackets and a comma
The brackets and the comma are required when writing a coordinate. Coordinates can be incorrectly written as 3,2 without the brackets, this is just a list of numbers; (3,2) is a coordinate.
Practice coordinates maths questions
1. Determine the location of the coordinate in the grid below.
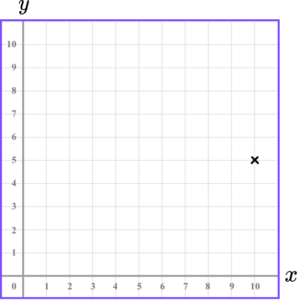


The x value of the coordinate is 10.
The y value of the coordinate is 5.
2. Determine the location of the coordinate in the grid below.
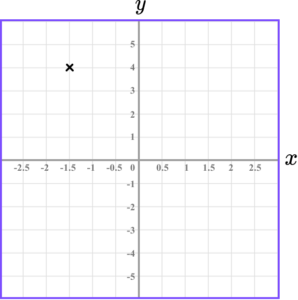
The x value of the coordinate is -1.5.
The y value of the coordinate is 4.
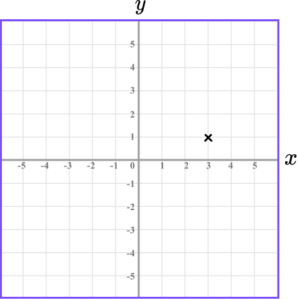
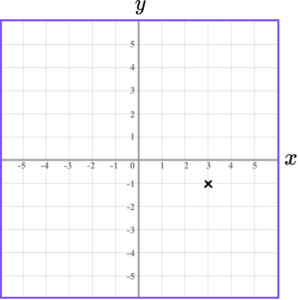
3. Which diagram correctly shows the location of the point (2.5,4.5)?

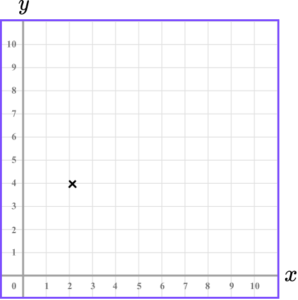

The x value of the coordinate is 2.5 so we go along the x -axis to the point 2.5.
The y value of the coordinate is 4.5 so we go along the y -axis to the point 4.5.
4. Which diagram correctly shows the location of the point A(-3,1)?


The x value of the coordinate is -3 so we go along the x -axis to the point -3.
The y value of the coordinate is 1 so we go along the y -axis to the point 1.
5. ABCD is a square.
Write down the coordinates of the point D.
A square has two parallel sides of equal length.
The coordinate is the intersection of the two lines.
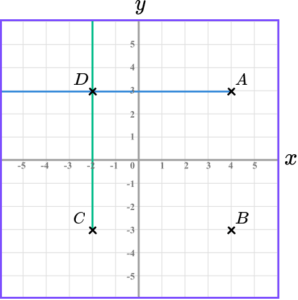
The point D(-2,3).
6. The points A(-1.5, 2), \ B(2, 2), \ C(1,-3) and D(x, -3) form the parallelogram ABCD.
What is one possible value of x?
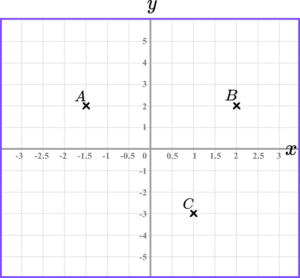
A parallelogram has two pairs of parallel sides.
Begin by plotting the points A, B and C.
Next, draw a line parallel to the line BC starting at A and draw a horizontal line through -3 on the y axis.
The point D is (-2.5,-3).
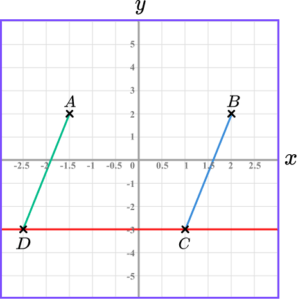
The point D(-2.5,-3).
Coordinates maths GCSE questions
1. Draw and label two points, A and B, that lie on the straight line x=4 and occur in two different quadrants.

(2 marks)
(1)
B(4,[-5,0])(1)
2. (a) Draw the points E and F such that ABCDEF is a hexagon with 2 lines of symmetry.
(b) What is the coordinate of the centre of the hexagon?
(3 marks)
(a)
E(7,4)
(1)
F(3,4)(1)
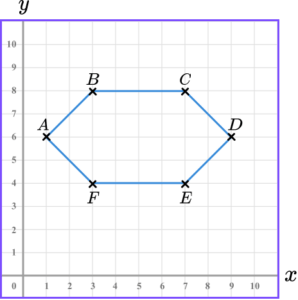
(b)
(5,6)
(1)
3. Harry wants to draw a square with a side length of 4cm on a centimetre square grid. He plots the first point A(3,2).
All of the points must lie on the coordinate grid that Harry has drawn. What are the coordinates of the other three vertices; B, C, and D?
(2 marks)
(1)
(-1,-2)(1)
(-1,2)(1)
Learning checklist
You have now learned how to:
The next lessons are
Still stuck?
Prepare your KS4 students for maths GCSEs success with Third Space Learning. Weekly online one to one GCSE maths revision lessons delivered by expert maths tutors.

Find out more about our GCSE maths tuition programme.