GCSE Tutoring Programme
Our chosen students improved 1.19 of a grade on average - 0.45 more than those who didn't have the tutoring.
In order to access this I need to be confident with:
Algebraic notation Substitution Coordinates mathsThis topic is relevant for:

Types Of Graphs
Here we will learn about types of graphs, including straight line graphs, quadratic graphs, cubic graphs, reciprocal graphs, exponential graphs and circle graphs.
You can also download the following free types of graphs resources all suitable for those following Edexcel, AQA or OCR exam boards:
What are types of graphs?
Types of graphs include different types of straight and curved graphs.
We need to be able to recognise and distinguish between the main types of graphs.
What are types of graphs?
Straight line graphs
Straight line graphs are graphs of linear functions and are of the form:
y=mx+c
Where m is the gradient and c is the y -intercept (where the line crosses the y -axis).
The graphs look like this:

Step-by-step guide: Straight line graphs
See also: Gradient of a line
Quadratic graphs
Quadratic graphs are graphs of a quadratic function and can be recognised as they include an squared term.
E.g.
An x^2 term.
The shape of a quadratic graph is a parabola.
The graphs have one tuning point – a minimum point or a maximum point.

Step-by-step guide: Quadratic graphs
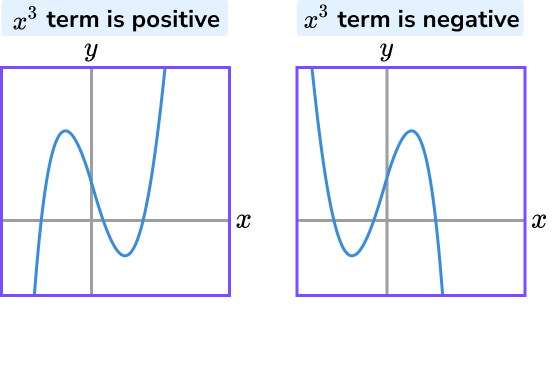
Cubic graphs
Cubic graphs are graphs of a cubic function and can be recognised as they include a cubed term.
E.g.
An x^3 term.
The graphs often have two turning points – a minimum point and a maximum point.
Step-by-step guide: Cubic graphs
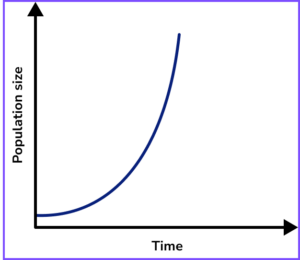
Exponential graphs
Exponential graphs are graphs of an exponential function and can be recognised as they include a k^x term where k is the base and x is the exponent (power).
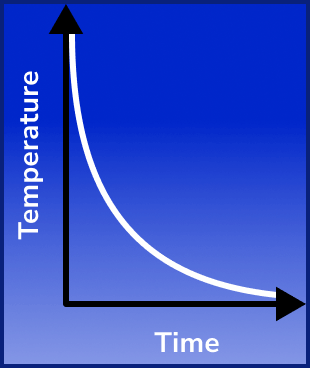
The graphs can be a growth curve when k is greater than 1 or a decay curve when k is less than 1 .

More complex exponential curves are of the form:
y=ab^x
Step-by-step guide: Exponential graphs
Reciprocal graphs
Reciproccal graphs are graphs of a reciprocal function and can be recognised as they include a \frac{1}{x} term.
The graphs can be recognised as they have two separate parts, often in different quadrants of the coordinate grid.

Step-by-step guide: Reciprocal graphs
Circle graphs
Circle graphs at GCSE are graphs of a circle with centre (0,0) .
They are of the form:
x^2+y^2=r^2
Where r is the radius of the circle.
Step-by-step guide: Circle graphs
Plotting graphs
At GCSE you may be asked to plot graphs. You may be asked to plot a straight line graph, a quadratic graph or a cubic graph. This involves finding coordinates and plotting these on a x-y axes and joining them.
You can find out more about plotting graphs here:
Step-by-step guide: Plotting graphs
Sketching graphs
We need to be able to sketch the different types of graphs and provide enough information on the coordinate grid to be able to distinguish the graph from others. This includes providing a rough drawing of the type of graph (a straight line, a parabola, a cubic etc), labelling key coordinates / axis values, labelling the line with an equation, and drawing any asymptotes.
Step-by-step guide: Sketching graphs (coming soon)
Graphs of real-world contexts
The graphs of algebraic equations can also be used to model real-world situations. For example, part of an exponential curve may be used to model how a population of rabbits in a field is growing over time.
Exponential curves may also be used to model how a hot drink cools over time.
Interpret graph
A question may ask you to interpret a graph. Make sure you look at the key information on the graph. You may be asked to read a value from the graph or find the gradient at a point.
If the graph is a real-life graph, the interpretation needs to include the situation.
For example,
This graph represents the calculation of the cost of a taxi ride.
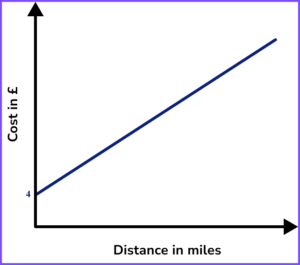
The 4 on the vertical axis can be interpreted as the fixed charge when hiring a taxi. We have to pay £4 to hire the taxi, no matter what distance we travel.
Graphical misrepresentation
Graphs can be misleading depending on subtle changes in the axes.
The standard set of axes for most graphical representations of a function are plus-shaped with a horizontal x-axis, and a vertical y-axis, both containing the same sized scale and intersecting at the origin (0,0).
E.g.
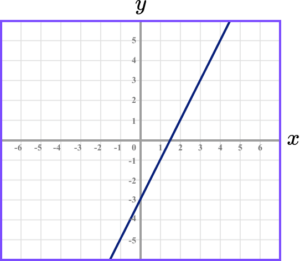
This is the graph of y=2x-3 plotted onto a standard set of axes.
If the scale of the y-axis is changed so that each square represents 2, the gradient of the line stays the same. However visually the graph looks shallower than on the set of axes above.
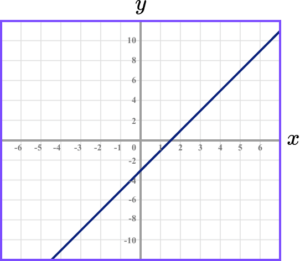
This graph could therefore be considered to be misleading as the scale on the x-axis is different to the scale on the y-axis.
For more information about graphical misrepresentation within statistical analysis, click the link below.
Step-by-step guide: Representing data
How to recognise types of graphs
In order to recognise and discriminate the types of graphs:
- Identify linear or quadratic.
- Identify if there is a circle graph.
- Identify other curves by looking at the features such as growth, or vertices.
- Identify all the graphs clearly.
Types of graphs worksheet
Get your free types of graphs worksheet of 20+ questions and answers. Includes reasoning and applied questions.
DOWNLOAD FREE Types of graphs worksheet
Get your free types of graphs worksheet of 20+ questions and answers. Includes reasoning and applied questions.
DOWNLOAD FREERecognising types of graphs examples
Example 1: recognise the types of graphs
Match the graph with its equation
- Identify linear or quadratic.
There is no straight line graph, so there is no linear function.
There is a parabola graph, so this is the graph of a quadratic function which has an x^2 term.
Graph C is Equation 2
2Identify if there is circle graph.
There is a circle graph. It has centre (0,0) and radius 2 ; so its equation would be:
x^2+y^2=2^2
Graph D is Equation 3
3Identify other curves by looking at the features such as growth, or vertices.
Graph A has 2 vertices; it is very likely to be a cubic function.
Equation 4 is a cubic function with a y -intercept at −2 which is at the end of the equation for when x = 0 .
Graph B is a growth curve so its equation will have a term with x as an exponent (power); equation 1 has a term with x as an exponent.
4Identify all the graphs clearly.
Example 2: recognise the types of graphs
Match the graph with its equation
There is a straight line graph so this is the graph of a linear function which has no visible powers.
There is no parabola graph so there is no quadratic function.
Graph B is Equation 1
There is a circle graph. It has centre (0,0) so its equation would be:
x^2+y^2=r^2
Graph A is Equation 3
Graph C is not a growth curve but it is a decay curve so its equation will have a term with x as an exponent (power). Equation 4 has a term with x as an exponent.
Graph D is a curve which has 2 sections in different quadrants of the coordinate grid. It is likely to be a reciprocal graph with a \frac{1}{x} term. Equation 2 has a term with with x as a denominator of a fraction.
How to use types of graphs
In order to use different types of graph to solve an equation:
- Add a line to the coordinate grid.
- See where the line crosses the curve.
- Draw a straight vertical line from the curve to the x -axis.
- Read off the value on the x -axis.
Using types of graphs examples
Example 3: using types of graphs
Use the graph of y=1.5^x to find an approximate solution to the equation 1.5^x=7

Since the y in the equation of the curve has been replaced by the 7 , add the horizontal line y=7 to the coordinate grid.
Make sure you use a ruler and be as accurate as you can.

The line y=7 crosses the curve at one point.

Continue to use a ruler and try to be as accurate as you can.

Be careful with the scale on x -axis. The solution to the equation is only approximate, but try to be as accurate as you can.
x=4.8
Example 4: using types of graphs
Use the graph of y=\frac{1}{x} to find an approximate solution to the equation \frac{1}{x}=x+2

Since the y in the equation of the curve has been replaced by the x + 2 , add the horizontal line y = x + 2 to the coordinate grid.
Make sure you use a ruler and be as accurate as you can.

The line y = x + 2 crosses the curve at two points.

Continue to use a ruler and try to be as accurate as you can.

Be careful with the scale on x -axis. The solution to the equation is only approximate, but try to be as accurate as you can.
x=0.4 \quad \text{or} \quad x=-2.4
How to plot types of graphs
In order to plot different types of graphs:
- Complete the table of values.
- Plot the coordinates.
- Draw a smooth curve through the points.
Plotting types of graphs examples
Example 5: Plot types of graphs
Draw the curve for -2\leq{x}\leq2 :
y=x^3-2x+3
Substitute the values of x into the equation. Write the values of y in the table.
\begin{aligned} &x \quad \quad -2 \quad \quad -1 \quad \quad 0\quad \quad 1 \quad \quad 2 \\ &y \quad \quad -1 \quad \quad \quad 4 \quad \quad 3 \quad \quad 2 \quad \quad 7 \end{aligned}
It is best practice to use a pencil and plot the coordinates using small crosses.
The coordinates would be (-2,-1), (-1,4) and so on. Note that the y -interceptis

Use a pencil and turn the paper around if it makes it easier for you.

Example 6: Plot types of graphs
Draw the curve for 1\leq{x}\leq18 :
y=\frac{18}{x}
Substitute the values of x into the equation. Write the values of y in the table.
\begin{aligned}
&x \quad \quad 1 \quad \quad 2 \quad \quad 3 \quad \quad 6 \quad \quad 9 \quad \quad 18\\
&y \quad \quad 18 \quad \;\;9 \quad \quad 6 \quad \quad 3 \quad \quad 2 \quad \quad 1
\end{aligned}
It is best practice to use a pencil and plot the coordinates using small crosses.
The coordinates would be (1,18), (2,9) and so on.

Use a pencil and turn the paper around if it makes it easier for you.

Common misconceptions
- Smooth curve
Points should be joined with a smooth curve – NOT line segments like the example below.

- Points on the curve
All points should be on the curve. If there is a point that does not join up with the other points when you draw a smooth curve – go back and check the coordinate. In the example below there is a point that does not lie on the smooth curve so needs checking.

Practice types of graphs questions
1. Identify the correct equation for this graph:


The graph shows a growth curve. We need to look for an equation which has a term like k^x where x is the exponent (power).
2. Identify the correct equation for this graph:

The graph shows a curve with 2 vertices – a minimum point and a maximum point.
We need to look for an equation which has a x^3 term.
Also the y -intercept is positive, and the equation ends +1 for when x=0.
3. Identify the correct graph for this equation:
x^2+y^2=9


The equation is of the form:
x^2+y^2=r^2
So we are looking for a circle with centre (0,0).
\begin{aligned} r^2 &= 9 \\\\ r &= \sqrt{9} = 3 \end{aligned}
The radius of the circle is 3 .
So the circle will pass through 3 on the x-axis and the y-axis.
4. Identify the correct graph for this equation:
y=-x^3+2x+3


The equation is a cubic with a negative x^3 term.
So we look for a cubic graph which shows as x increases so does y but negatively.
So this is the approximate shape:

The equation also ends with +3 for when x=0.
So this tells us the y -intercept is also +3
5. Use the graph of y=4^x to find an approximate solution to:
4^x=3

Draw a horizontal line at y=3 and see where it crosses the line.
Then draw a vertical line down and read the value of the x-axis.

6. Use the graph of y=\frac{1}{x-2} to find an approximate solution to:
\frac{1}{x-2}=1.4

Draw a horizontal line at y=1.4 and see where it crosses the line.
Then draw a vertical line down and read the value of the x-axis.

Types of graphs GCSE questions
1. On the grid, sketch the curve with the equation
y=3^x
Give the coordinates of any points of intersection with the axes.

(2 marks)

for drawing a growth curve
(1)
for the y -intercept (0,1)
(1)
2. Here are three graphs:

Here are three equations:
y=\frac{1}{x} \quad \quad \quad y=x^2+2 \quad \quad \quad y=x^3
Match each graph to the correct equation
Graph A and y = ………………
Graph B and y = ………………
Graph C and y = ……………….
(3 marks)
Graph A and y=x^3
(1)
Graph B and y=x^{2}+2
(1)
Graph C and y=\frac{1}{x}
(1)
3. (a) Complete the table of values for y=x^{3}-6x+1
\begin{aligned} &x \quad \quad -3 \quad \quad -2 \quad \quad -1 \quad \quad 0 \quad \quad 1 \quad \quad 2 \quad \quad 3\\ &y \quad \quad -0 \quad \quad \quad \quad \quad \quad \;6 \quad \quad \quad \;\quad \quad \quad -3 \quad \quad 10 \end{aligned}
(b) On the grid, draw the graph of y=x^{3}-6x+1 for -3\leq{x}\leq3

(c) Use the graph to find an approximate solution for
x^{3}-6x+1=7
(5 marks)
(a)
Correct Values are: 5, 1 and -4
For 1 correct y -values
(1)
For all correct y -values
(1)
(b)

for plotting the points correctly
(1)
for the smooth curve
(1)
(c)
x=2.8
approximate solution
(1)
Learning checklist
You have now learned how to:
The next lessons are
Still stuck?
Prepare your KS4 students for maths GCSEs success with Third Space Learning. Weekly online one to one GCSE maths revision lessons delivered by expert maths tutors.

Find out more about our GCSE maths tuition programme.