GCSE Tutoring Programme
Our chosen students improved 1.19 of a grade on average - 0.45 more than those who didn't have the tutoring.
In order to access this I need to be confident with:
Negative numbers Substitution Coordinates ArithmeticThis topic is relevant for:

Plotting Graphs
Here we will learn about plotting graphs, including how to plot straight-line graphs and the graphs of curves including quadratic graphs and cubic graphs
You can also download this free Sketching Graphs Worksheet suitable for those following Edexcel, AQA or OCR exam boards.
What is plotting graphs?
Plotting graphs allows us to accurately plot coordinates onto a grid to produce the graph of a function.
We can plot a variety of different graphs. Linear functions which produce straight-line graphs but we can also plot other polynomials such as quadratic functions or cubic functions and exponential functions.
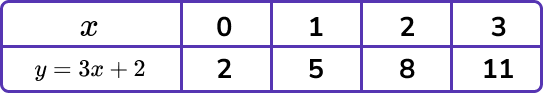
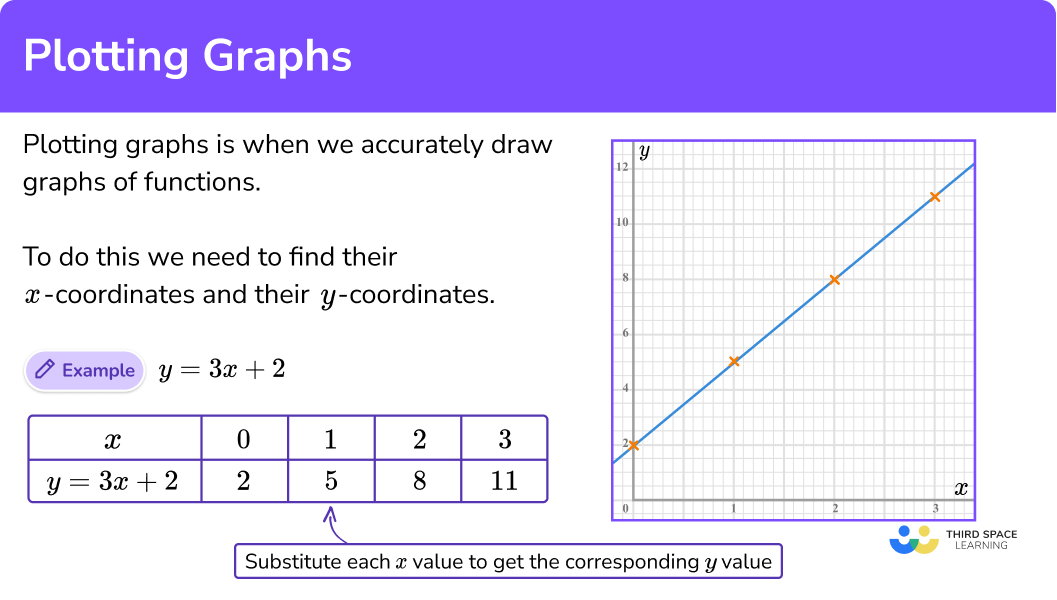
To do this we need to find x -coordinates and their y -coordinates.
These are plotted on x-y axes and the points are joined up.
For example,
y = 3x + 2

What is plotting graphs?
How to plot a graph
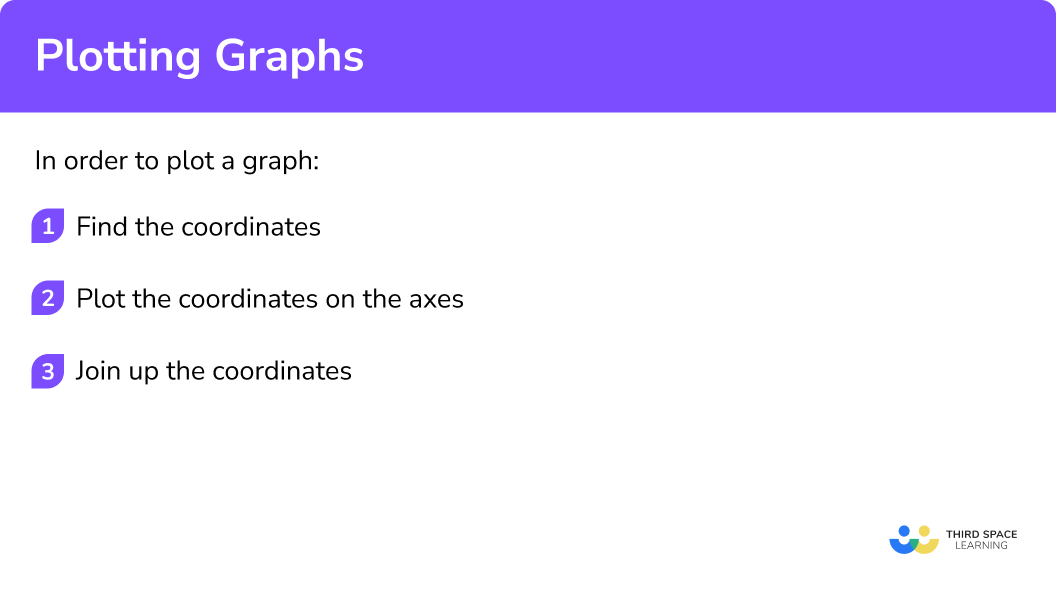
In order to plot a graph:
- Find the coordinates.
- Plot the coordinates on the axes.
- Join up the coordinates.
Explain how to plot a graph
Sketching graphs worksheet (includes plotting graphs)
Get your free plotting graphs worksheet of 20+ sketching graphs questions and answers. Includes reasoning and applied questions.
DOWNLOAD FREE Sketching graphs worksheet (includes plotting graphs)
Get your free plotting graphs worksheet of 20+ sketching graphs questions and answers. Includes reasoning and applied questions.
DOWNLOAD FREERelated lessons on interpreting graphs
Plotting graphs is part of our series of lessons to support revision on interpreting graphs. You may find it helpful to start with the main interpreting graphs lesson for a summary of what to expect, or use the step by step guides below for further detail on individual topics. Other lessons in this series include:
Plotting graphs examples
Example 1: straight-line graph in the form y = mx + c
Complete the table of values for y=2x+3 and then on the grid draw the graph of y=2x+3:
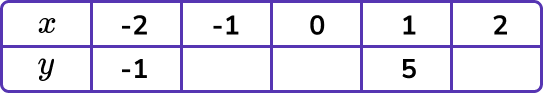

- Find the coordinates.
We need to find the missing y -coordinates. We do this by substituting the x -values into the equation.
For example,
When x = -1
When y = 2(-1) + 3 = -2 + 3 = 1
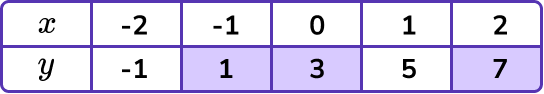
2Plot the coordinates on the axes.
The x -values and y -values in the table give coordinates to plot on the grid.
(-2,-1), \ (-1, 1) and so on. The points should be plotted with small crosses.
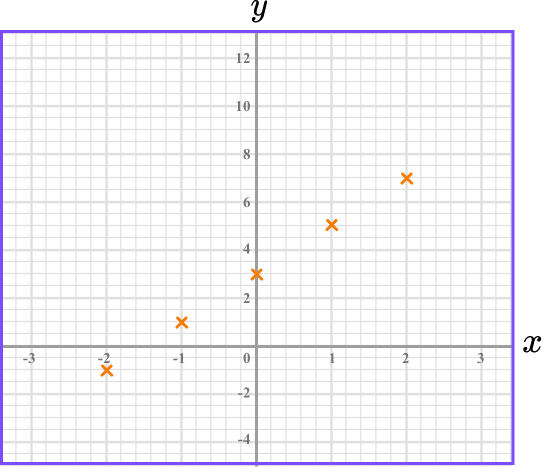
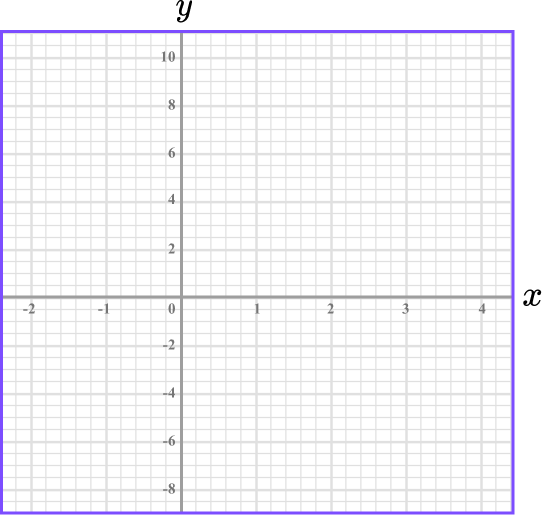
3Join up the coordinates.
The coordinates need to be joined up with a straight-line. The line can be extended beyond the first and last points.

Example 2: straight-line graph in the form y = mx + c , no table given
On the grid draw the graph of y=3x-4 for values of x from -2 to 4:
We need to make our own table. We can choose at least 3 \ x -values. Simple x -values such as 0, 1, and 2 will be sensible. We can then find the corresponding y -coordinates. We do this by substituting the x -values into the equation.
For example,
When x=1
y=3(1)-4=3-4=-1
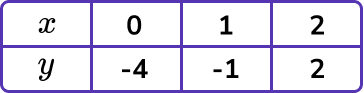
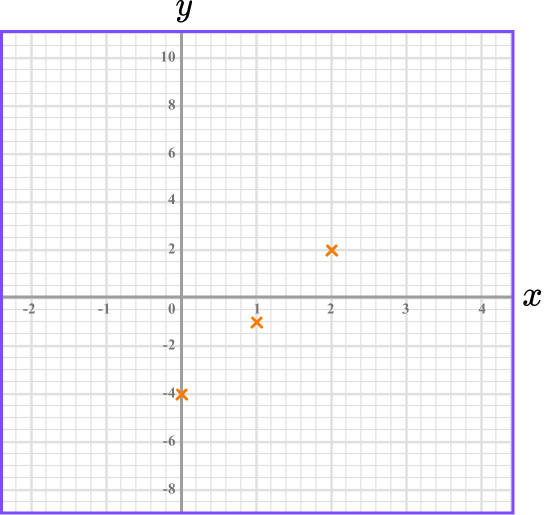
The x -values and y -values in the table give coordinates to plot on the grid.
(0,-4), \ (1, -1) and (2,2). The points should be plotted with small crosses.
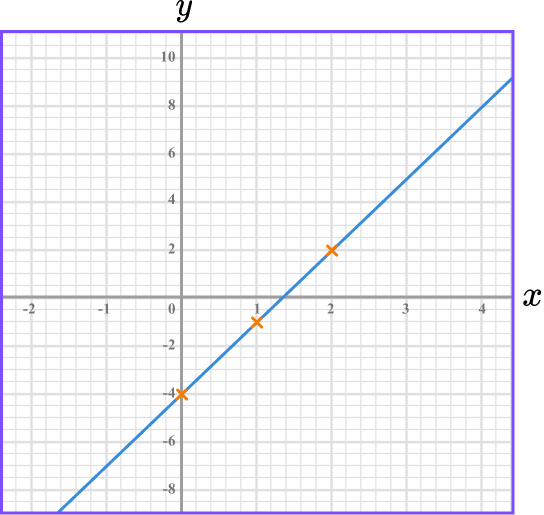
The coordinates need to be joined up with a straight-line. The line can be extended beyond the first and last points to cover the whole of the grid.
Example 3: quadratic function
Complete the table of values for y=x^{2}-3x and then on the grid draw the graph of y=x^{2}-3x.
We need to find the missing y -coordinates. We do this by substituting the x -values into the equation.
For example,
When x=-1
y=(-1)^2-3(-1)=1+3=4
The x -values and y -values in the table give coordinates to plot on the grid.
(-1,4), \ (0, 0) and so on. The points should be plotted with small crosses.
The coordinates need to be joined up with a single smooth curve. The curve can be extended beyond the first and last points.
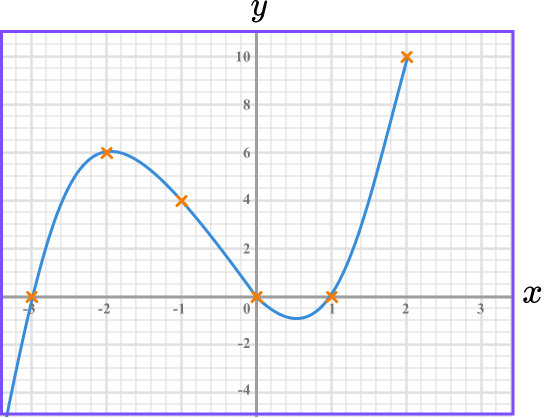
Example 4: cubic function
Complete the table of values for y=x^{3}+2x^{2}-3x and then on the grid draw the graph of y=x^{3}+2x^{2}-3x:
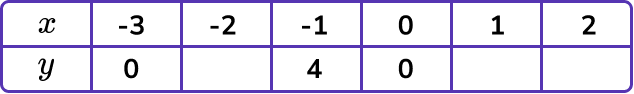
We need to find the missing y -coordinates. We do this by substituting the x -values into the equation.
For example,
When x=-2
y=(-2)^3+2(-2)^2-3(-2)=-8+8+6=6
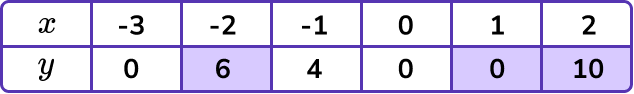
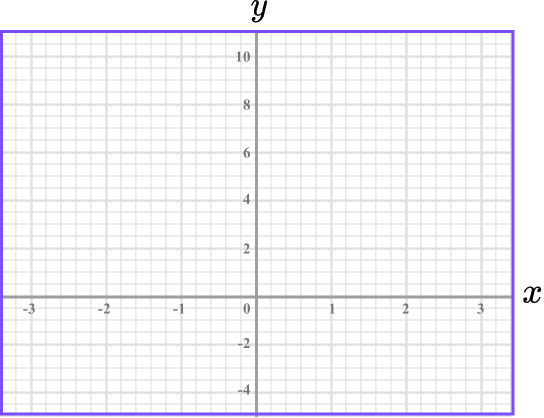
The x -values and y -values in the table give coordinates to plot on the grid.
(-3,0), \ (-2, 6) and so on. The points should be plotted with small crosses.
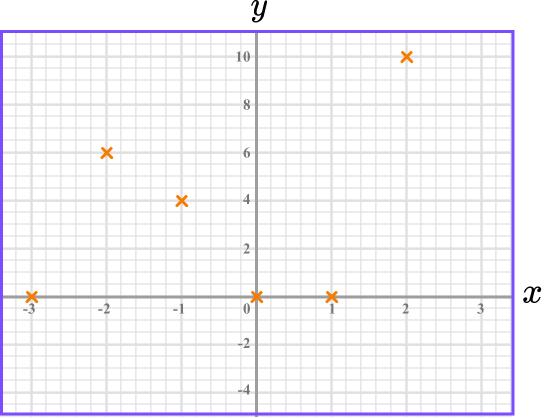
The coordinates need to be joined up with a single smooth curve. The curve can be extended beyond the first and last points.
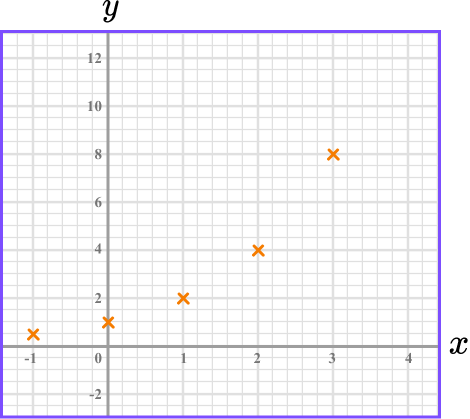
Example 5: exponential function
Complete the table of values for y=2^x and then on the grid draw the graph of y=2^x:
We need to find the missing y -coordinates. We do this by substituting the x -values into the equation.
For example,
When x=-1
y=2^{-1} = 0.5
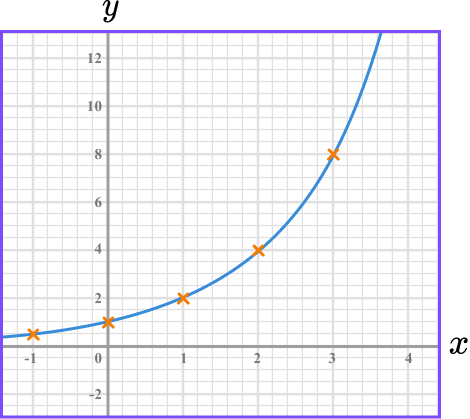
The x -values and y -values in the table give coordinates to plot on the grid.
(-1,0.5), \ (0, 1) and so on. The points should be plotted with small crosses.
The coordinates need to be joined up with a single smooth curve. The curve can be extended beyond the first and last points.
How to plot a straight line graph using the intercept method
In order to plot a straight line graph using the intercept method:
- Substitute \bf{x=0} to find the \textbf{y} -intercept.
- Substitute \bf{y=0} to find the \textbf{x} -intercept.
- Join the two points, then substitute the values of a third point to check your answer.
Explain how to plot a graph using the intercept method
Plotting graphs using the intercept method examples
Example 6: straight-line graph in the form ax + by = c
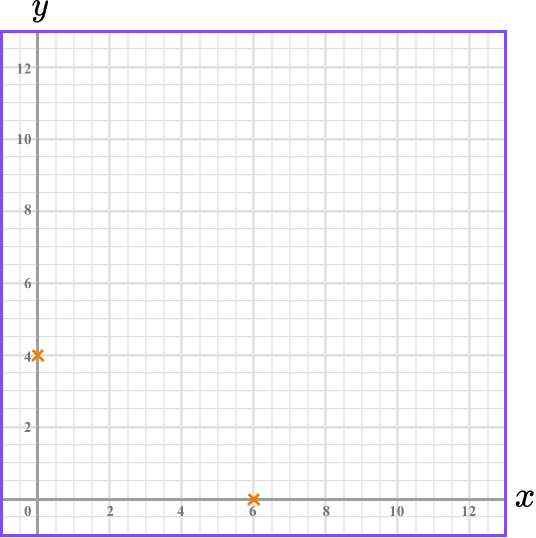
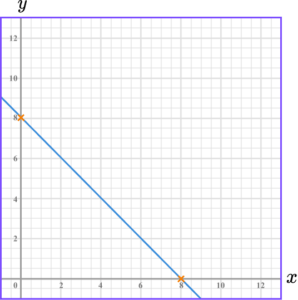
On the grid draw the graph of 2x+3y=12.
Because of the way the equation of the straight-line is written, it is simple to substitute x=0 to find where the line crosses the y -axis.
\begin{aligned} 2x+3y &= 12 \\\\ 2(0)+3y &=12\\\\ 3y&=12\\\\ y&=4 \end{aligned}
This means the line crosses the y -axis at 4. The y -intercept is 4.

Similarly it is simple to substitute y=0, to find where the line crosses the x -axis.
\begin{aligned} 2x+3y &= 12 \\\\ 2x+3(0) &=12\\\\ 2x&=12\\\\ x&=6 \end{aligned}
This means the line crosses the x -axis at 6. The x -intercept is 6.
Join the two points with a straight line.
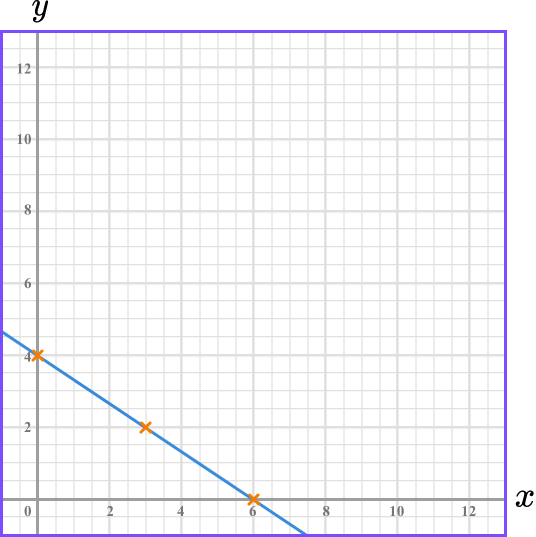
Always check your answer by substituting the values of a third point into the original equation.
The point (3,2) lies on the line we have drawn. We substitute x=3, \ y=2 into the equation 2x+3y=12 to check.
\begin{aligned} 2x+3y &= 12 \\\\ 2(3)+3(2) &=12\\\\ 6+6&=12 \end{aligned}
The statement is correct, so we know that our line is drawn correctly.
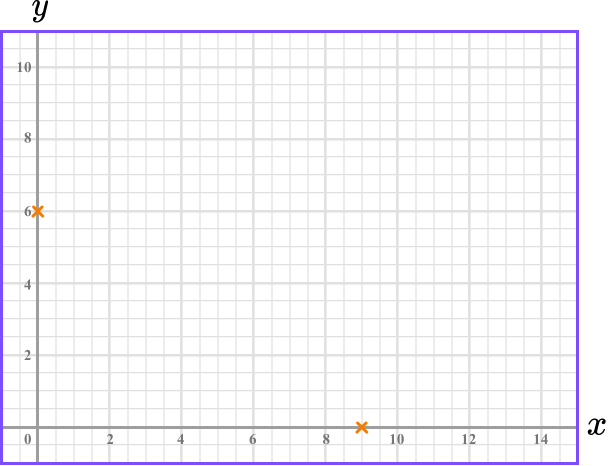
Example 7: straight-line graph in the form ax + by = c
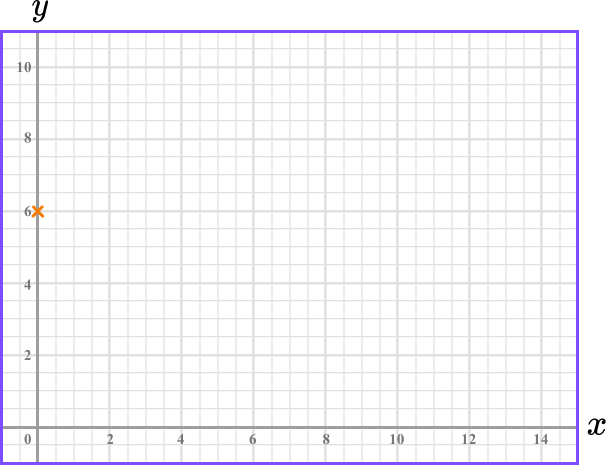
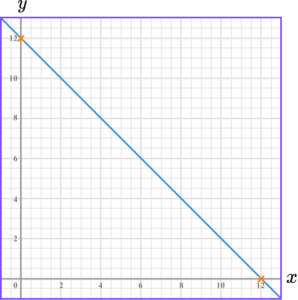
Draw the graph of 2x+3y=18.
Substitute x=0 into 2x+3y=18.
\begin{aligned} 2x+3y &= 18 \\\\
2(0)+3y &=18\\\\
3y&=18\\\\
y&=6
\end{aligned}
This means the line crosses the y -axis at 4. The y -intercept is 4.
Substitute y=0 into 2x+3y=18.
\begin{aligned} 2x+3y &= 18 \\\\
2x+3(0) &=18\\\\
2x&=18\\\\
x&=9
\end{aligned}
This means the line crosses the x -axis at 9. The x -intercept is 9.
Join the two points with a straight line:
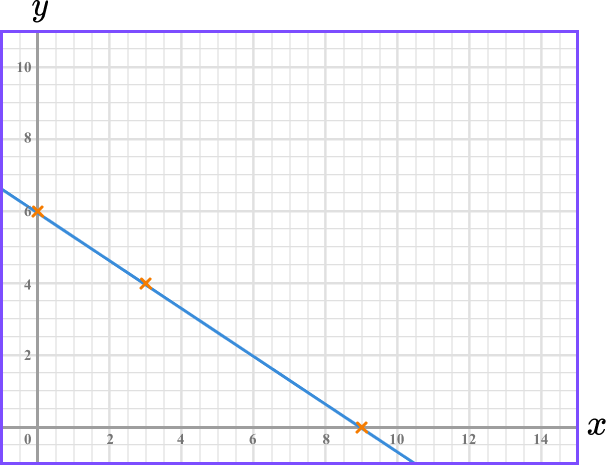
Always check your answer by substituting the values of a third point into the original equation.
The point (3,4) lies on the line we have drawn. We substitute x=3, \ y=4 into the equation 2x+3y=18 to check.
\begin{aligned} 2x+3y &= 18 \\\\
2(3)+3(4) &=18\\\\
6+12&=18
\end{aligned}
The statement is correct, so we know that our line is drawn correctly.
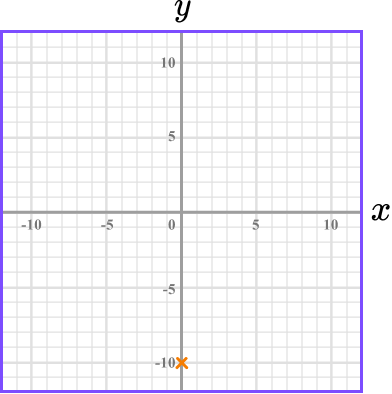
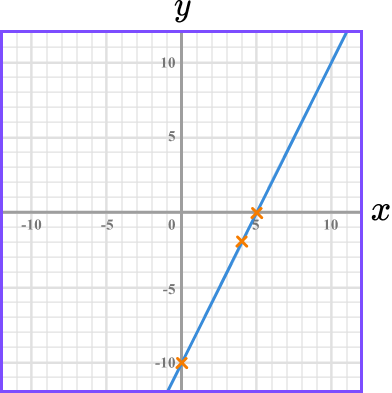
Example 8: straight-line graph in the form ax + by = c
Draw the graph of 4x-2y=20.

Substitute x=0 into 4x-2y=20.
\begin{aligned}4x-2y &= 20 \\\\
4(0)-2y &=20\\\\
-2y&=20\\\\
y&=-10
\end{aligned}
This means the line crosses the y -axis at -10. The y -intercept is -10.
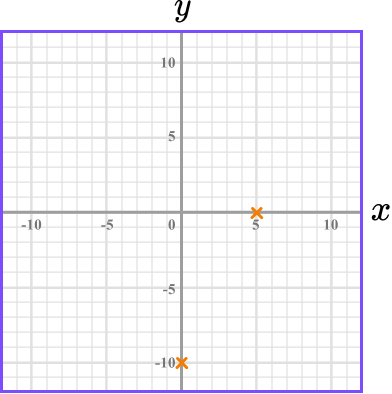
Substitute y=0 into 4x-2y=20.
\begin{aligned} 4x-2y &= 20 \\\\ 4x-2(0) &=20\\\\ 4x&=20\\\\ x&=5 \end{aligned}
This means the line crosses the x -axis at 5. The x -intercept is 5.
Join the two points with a straight line:
Always check your answer by substituting the values of a third point into the original equation.
The point (4,-2) lies on the line we have drawn. We substitute x=4, \ y=-2 into the equation 4x-2y=20 to check.
\begin{aligned} 4x-2y &= 20 \\\\
4(4)-2(-2) &=20\\\\
16+4&=20
\end{aligned}
The statement is correct, so we know that our line is drawn correctly.
Common misconceptions
- Take care with negative values
It is easy to make mistakes when substituting negative values into algebraic expressions.
For example, substituting x=-2 into y=x^{2}+3 will be:
y=(-2)^2+3=4+3=7 \ \color{green} \textbf{✔}
NOT
y=-2^2+3=-4+3=-1 \ \color{red} \textbf{✘}
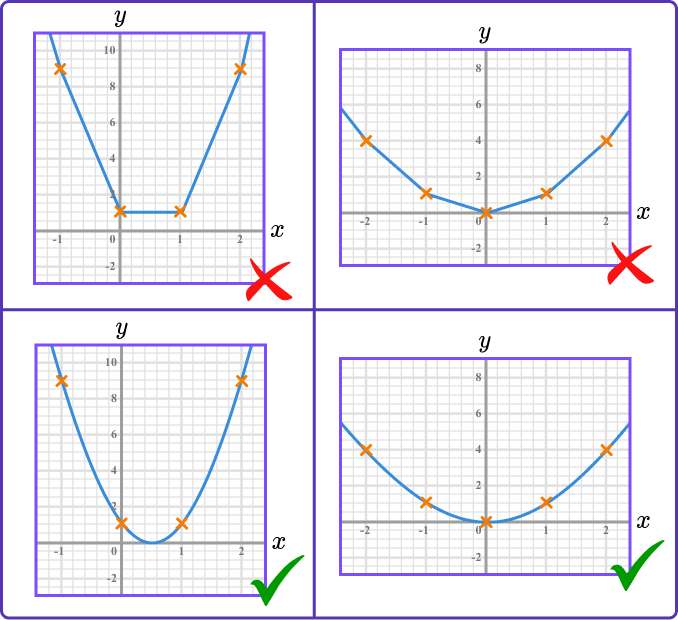
- Graphs of quadratic functions have symmetry
Graphs of quadratic functions have a line of symmetry. This can be useful as a check on whether you have plotted the points correctly.
- Turning points should be drawn carefully
Quadratic graphs and cubic graphs have turning points. They should be drawn with care so they are not very flat, nor very pointy.
Practice plotting graphs questions
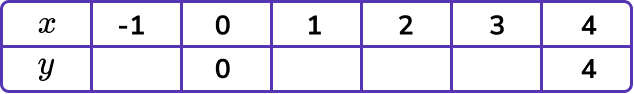
1. Complete the table of values for y=5x-4.


The missing y -coordinates can be found by substituting the x -values into y=5x-4.
When x=-1, \ y=5\times -1-4=-5-4=-9
When x=0, \ y=5\times 0-4=0-4=-4
When x=2, \ y=5\times 2-4=10-4=6
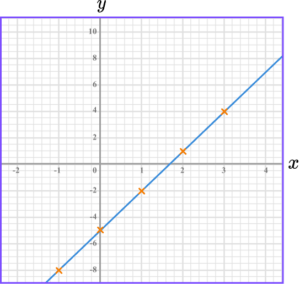
2. Draw the graph of y=4-2x.
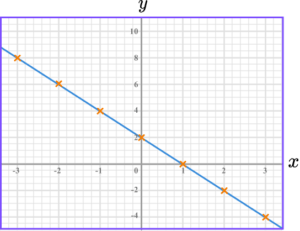
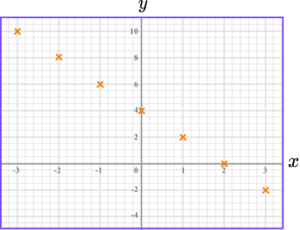
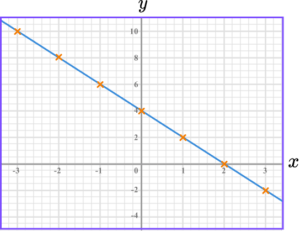
The graph of y=4-2x is a straight-line going through these points.

The points should be joined with a straight-line.
3. Draw the graph of 4x+3y=24.
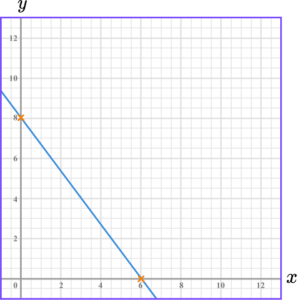
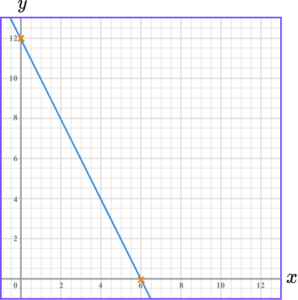
We can work out where the line crosses the axes.
To find where the line crosses the y -axis, substitute x=0.
\begin{aligned}
4x+3y &= 24 \\\\
4(0)+3y &=24\\\\
3y&=24\\\\
y&=8
\end{aligned}
This means the line crosses the y -axis at 8.
To find where the line crosses the x -axis, substitute y=0.
\begin{aligned}
4x+3y &= 24 \\\\
4x+3(0) &=24\\\\
4x&=24\\\\
x&=6
\end{aligned}
This means the line crosses the x -axis at 6.
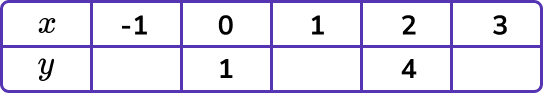
4. Complete the table of values for y=x^{2}+2x.


The missing y -coordinates can be found by substituting the x -values into y=x^{2}+2x.
When x=-2, \ y=(-2)^2 +2(-2)=4-4=0
When x=1, \ y=(1)^2 +2(1)=1+2=3
When x=2, \ y=(2)^2 +2(2)=4+4=8
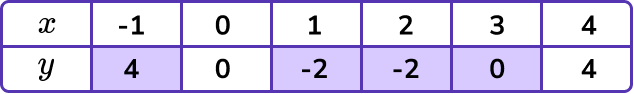
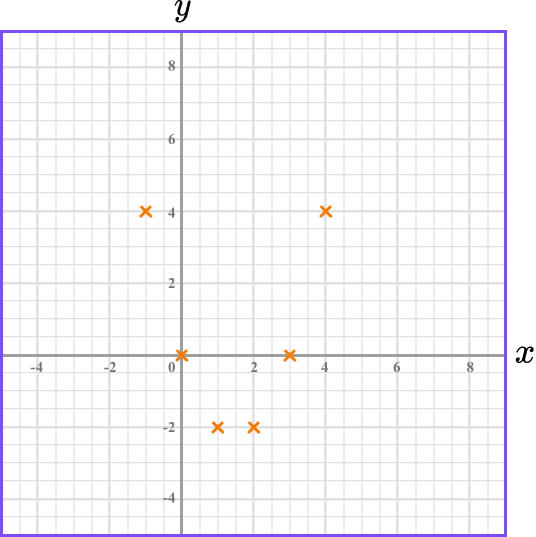
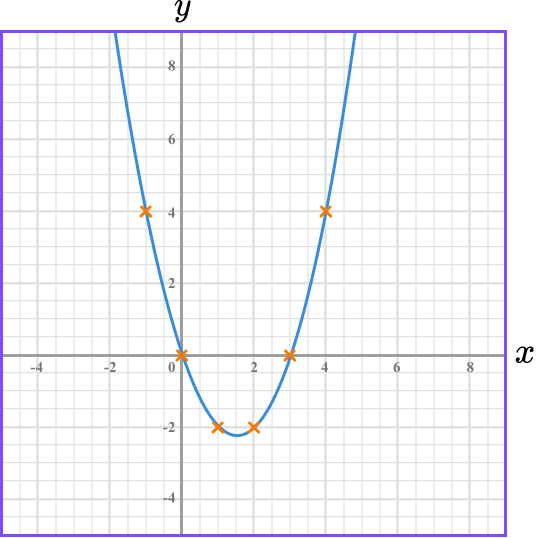
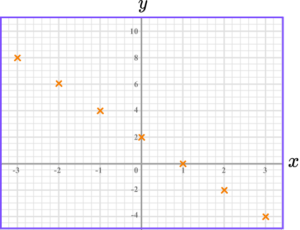
5. Draw the graph of y=x^{2}-3.

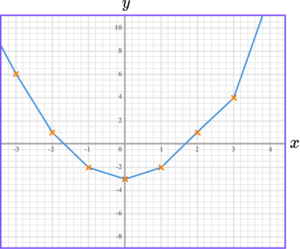
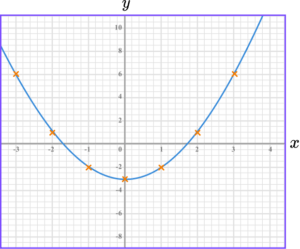
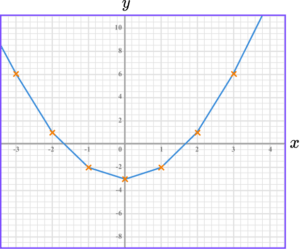
The graph of y=x^{2}-3 is a curve going through these points.
![]()
The points should be joined with a smooth curve.
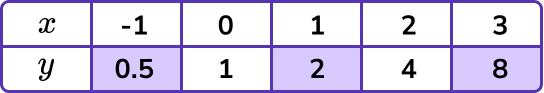
6. Complete the table of values for y=4^{x}.


The missing y -coordinates can be found by substituting the x -values into y=4^{x}.
When x=-1, \ y=4^{-1}=0.25
When x=1, \ y=4^1=4
When x=2, \ y=4^2=16
Plotting graphs GCSE questions
1. (a) Complete the table of values for y=3x-5.

(b) On the grid draw the graph of y=3x-5, for the values of x from -1 to 3.
(4 marks)
(a)

For two correct y -values.
(1)
For all four correct y -values.
(1)
(b)
For at least 4 points correctly plotted.
(1)
For graph fully drawn correctly.
(1)
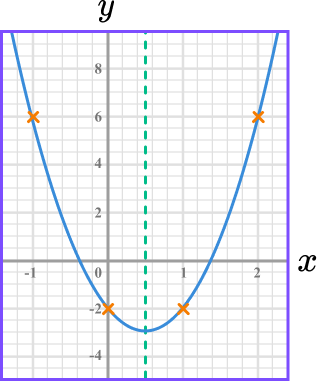
2. (a) Complete the table of values for y=x^{2}+3x-1.
![]()
(b) On the grid draw the graph of y=3x-5, for the values of x from -3 to 3.
(4 marks)
(a)
![]()
For two correct y -values.
(1)
For all four correct y -values.
(1)
(b)
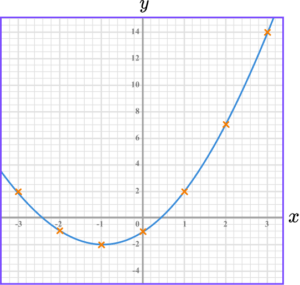
For at least 6 points correctly plotted.
(1)
For graph fully drawn correctly.
(1)
3. (a) Complete the table of values for y=\frac{12}{x}.
![]()
(b) On the grid draw the graph of y=\frac{12}{x}, for the values of x from 1 to 12.
(4 marks)
(a)
![]()
For two correct y -values.
(1)
For all four correct y -values.
(1)
(b)
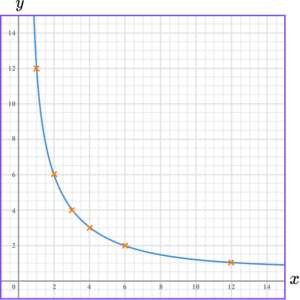
For at least 4 points correctly plotted.
(1)
For graph fully drawn correctly.
(1)
Learning checklist
You have now learned how to:
The next lessons are
Still stuck?
Prepare your KS4 students for maths GCSEs success with Third Space Learning. Weekly online one to one GCSE maths revision lessons delivered by expert maths tutors.

Find out more about our GCSE maths tuition programme.