GCSE Tutoring Programme
Our chosen students improved 1.19 of a grade on average - 0.45 more than those who didn't have the tutoring.
In order to access this I need to be confident with:
Substitution Quadratics equations Negative numbers Straight line graphs y=mx+c Coordinates maths Trigonometry Calculator skillsThis topic is relevant for:

Sketching Graphs
Here we will learn about sketching graphs, including sketching straight line graphs, quadratic graphs, cubic graphs, reciprocal graphs, exponential graphs and trigonometric graphs.
You can also download the following free sketching graphs resources suitable for those following Edexcel, AQA or OCR exam boards:
What is sketching graphs?
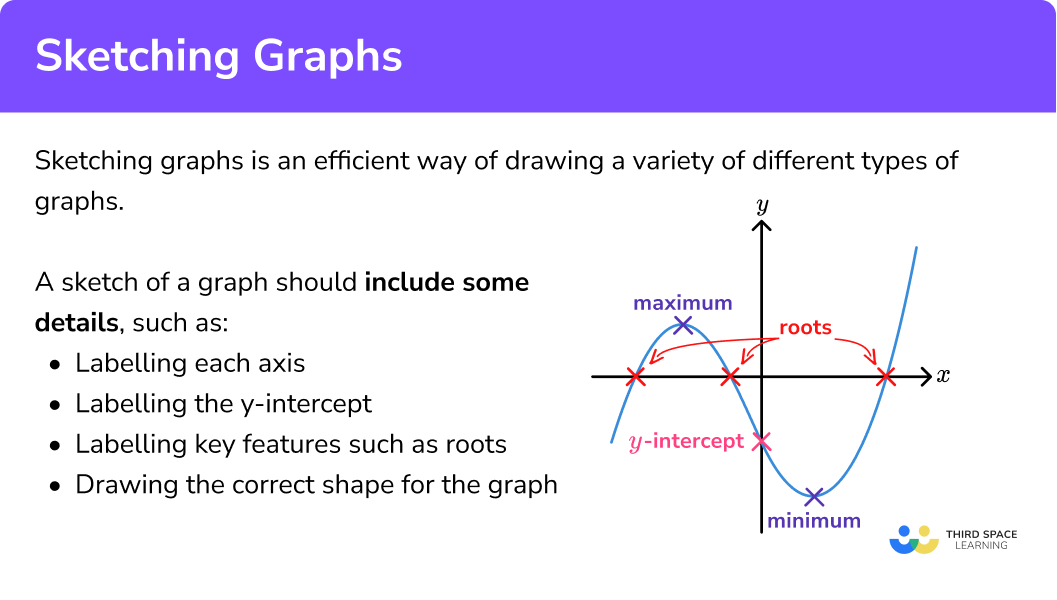
Sketching graphs is an efficient way of drawing a variety of different types of graphs.
A sketch of a graph must provide enough detail to allow a reader to quickly interpret the graph. These details include,
- Labelling each axis
- Labelling the origin
- Labelling the y -intercept
- Drawing a suitable sketch of the graph
To sketch different types of graphs, we need to know what the graph of the function looks like and how the graph of the function changes, depending on the specifics of the equation.
What is sketching graphs?
Download our free sketching graphs poster to focus your revision!
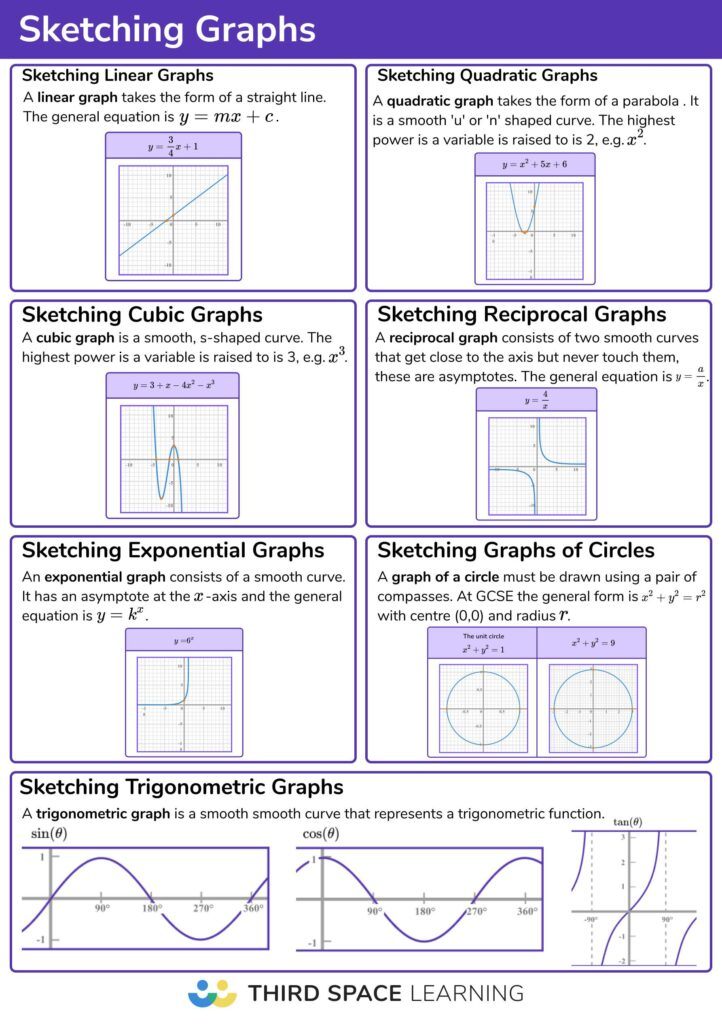
Sketching linear graphs
A linear graph takes the form of a straight line.
A linear graph is one continuous straight line, and so it must be drawn using a ruler.
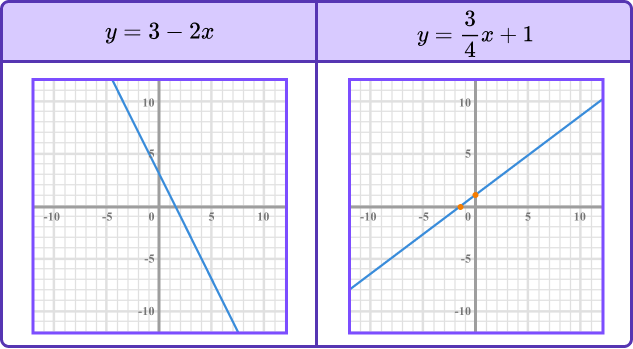
The general form for a linear function is y=mx+c where m is the gradient of the line and c is the y -intercept. You should be able to sketch graphs of all linear functions of the form y=mx+c.
Below are a few examples of linear functions and their graphical representation.
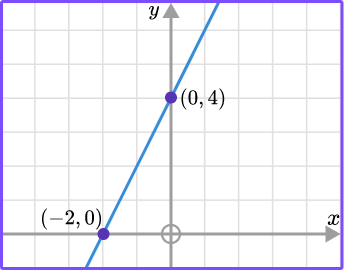
To sketch a straight line graph (a linear function), we need to be able to determine the \textbf{y} -intercept and locate this point on the graph. To do this, we substitute x=0 into the function, and calculate the value for y.
For example,
Let y=2x+4. When x=0 we have the equation
y=2\times{0}+4=0+4=4
The y -intercept is the point (0,4).
For any equation in the form y=mx+c, the y intercept is c.
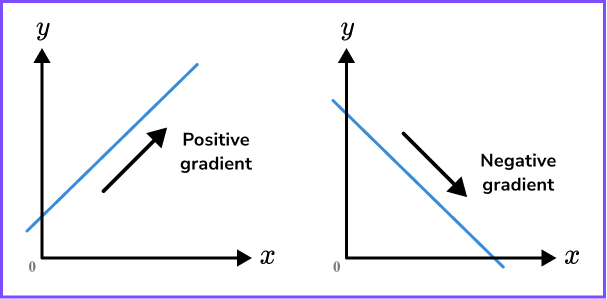
We also need to be able to determine whether the straight line has a positive gradient or a negative gradient. This is found using the coefficient of x.
Looking at y=2x+4, the coefficient of x is 2 which is a positive number and so the gradient is positive.
You may be asked to label the value where the graph intercepts the x -axis.
To calculate the value where the graph intercepts the x -axis, we need to substitute y=0 into the equation of the line and solve to determine the value of x.
For example,
For y=2x+4
when y=0 we have the equation
\begin{aligned} 2x+4&=0\\\\ 2x&=-4\\\\ x&=\frac{-4}{2}\\\\ x&=-2 \end{aligned}
This means that the straight line crosses the x -axis at the point (-2,0).
A sketch of the graph y=2x+4 would look like this,
Step-by-step guide: y=mx+c
Step-by-step guide: Straight line graphs
Sketching quadratic graphs
A quadratic graph takes the form of a parabola.
A quadratic graph is a smooth, u-shaped (or n-shaped) curve and so it must be drawn freehand and without the use of a ruler.
The general form for a quadratic function is y=ax^{2}+bx+c .
To sketch a quadratic graph, we need to be able to determine the following characteristics.
- u or n shaped
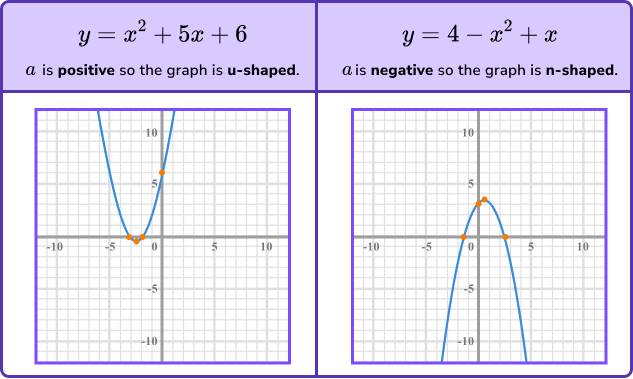
When the coefficient of x^2 is positive (a > 0) the graph is u-shaped.
When the coefficient of x^2 is negative (a < 0) the graph is n-shaped.
For example,
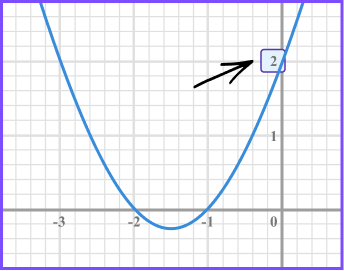
- y -intercept
To find the y -intercept, we substitute x=0 into the function, and calculate the value for c.
For example,
y=x^{2}+3 x+2
When x=0
\begin{aligned} &y=0^{2}+3(0)+2 \\\\ &y=2 \end{aligned}
For any equation of the form y=ax^{2}+bx+c, the y intercept is c.
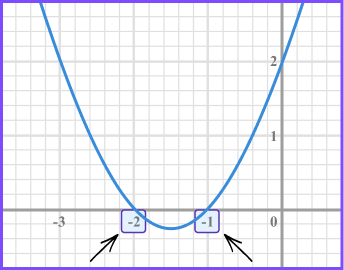
- x -intercepts or roots
To calculate the value(s) where the graph intercepts the x -axis, also called the roots of the equation, we need to set y=0 and solve the quadratic. This may require us to factorise the quadratic to or use the quadratic formula.
For example,
\begin{aligned} &y=x^{2}+3 x+2 \\\\ &y=(x+2)(x+1) \end{aligned}
When y=0
(x+2)(x+1)=0
So,
\begin{aligned} x+2 &=0 \\\\ x &=-2 \end{aligned}
or
\begin{aligned} x+1 &=0 \\\\ x &=-1 \end{aligned}
Step-by-step guide: Solving quadratics by factorising
See also: Quadratic formula
- Turning point
The turning point of a quadratic is the point at which the gradient of the curve changes from positive to negative (hence the name turning point). To determine the turning point of a quadratic, we need to be able to complete the square.
For example,
\begin{aligned} &y=x^{2}+4 x+1 \\\\ &y=(x+2)^{2}-4+1 \\\\ &y=(x+2)^{2}-3 \end{aligned}
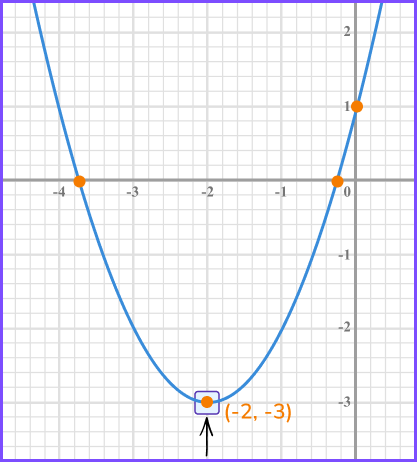
When the graph is u-shaped, the turning point is when the value for \textbf{y} is at its minimum. When the graph is n-shaped, the turning point is when the value for \textbf{y} is at its maximum.
In this case the turning point occurs when (x+2)=0, therefore x=-2 and y=-3.
The turning point is the point (-2,-3).
Step-by-step guide: Complete the square
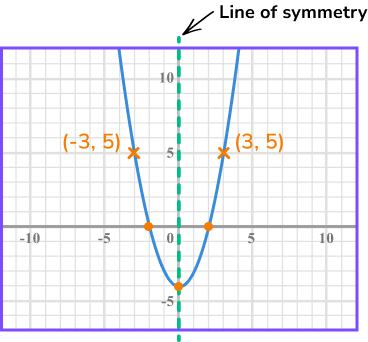
Every parabola has a line of symmetry. This line of symmetry is vertical and passes through the turning point of the graph. If the line of symmetry is the y -axis (the line x=0 ) this means that the value for y is the same for +x and -x. This is the definition of an even function.
You should also be able to sketch graphs of quadratic functions of the form y=ax^{2}+c (where b=0 ). Any quadratic graph of the form y=ax^{2}+c will have the y -axis as a line of symmetry.
Step-by-step guide: Quadratic graphs
Sketching cubic graphs
Other polynomials that you should be able to sketch include cubics.
A cubic graph is a smooth, s-shaped curve and so it must be drawn freehand and without the use of a ruler.
The general form for a cubic function y=ax^{3}+bx^{2}+cx+d.
Below are a few examples of cubic functions and their graphical representation.
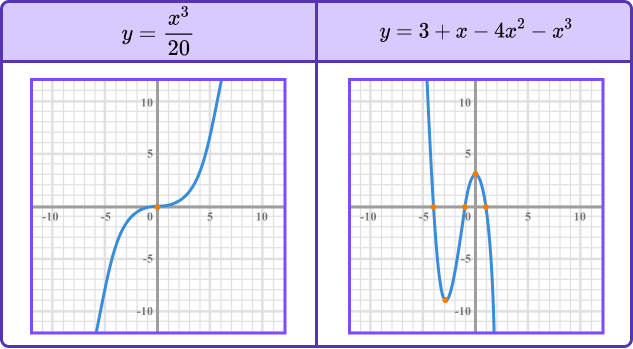
To sketch a cubic graph, we need to be able to determine the y -intercept and locate this point on the graph. To find the y -intercept, we substitute x=0 into the function, and calculate the value for y.
For example,
Find the y -intercept for the function f(x)=x^{3}-4.
f(0)=0^{3}-4=0-4=-4.
So the y -intercept is the point (0,-4).
For any equation of the form y=ax^{3}+bx^{2}+cx+d, the y intercept is d.
A cubic graph has rotational symmetry. This means that there is a point on any cubic graph that you can rotate the graph around and it will be an exact copy of itself. A cubic graph has a rotational symmetry of order 2 (the graph is the same after a rotation of 180 degrees).
You should also be able to sketch graphs of cubic functions of the form y=ax^{3}+d (where b=0 and c=0 ).
Step-by-step guide: Cubic graphs
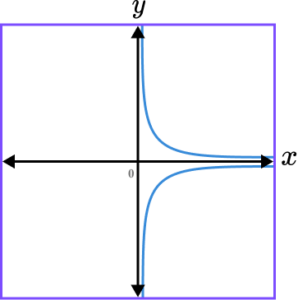
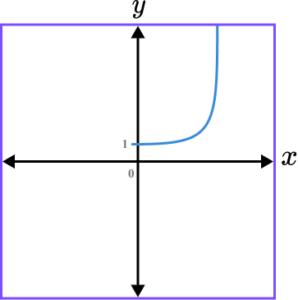
Sketching reciprocal graphs
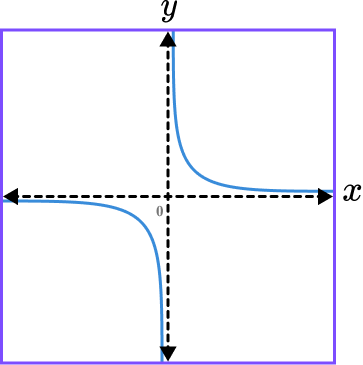
A reciprocal graph consists of two smooth, continuous curves and so they must be drawn freehand and without the use of a ruler.
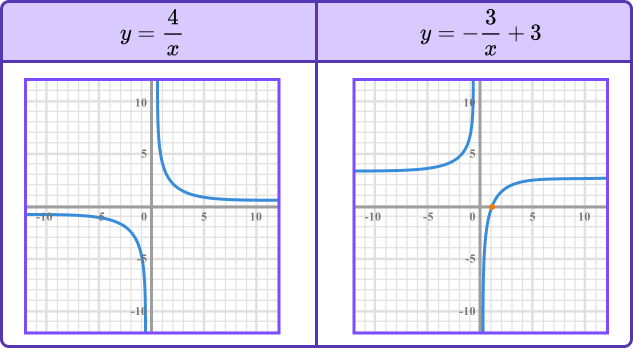
The general form for a reciprocal function is y=\frac{a}{x} where a is a constant. You should be able to sketch the graph of a reciprocal function of the form y=\pm\frac{1}{x} where the lines y=0 and x=0 are asymptotes for both graphs.
Below are a few examples of reciprocal functions and their graphical representation.
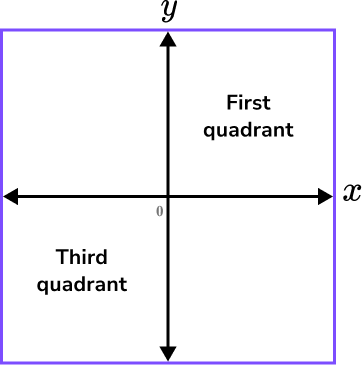
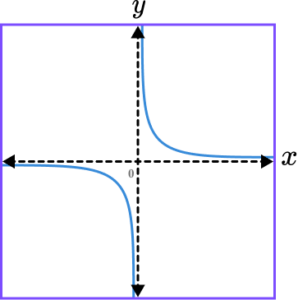
To sketch a reciprocal graph, we need to be able to determine which two of the four quadrants the graph lies in.
We can do this by substituting one positive and one negative value for x into the equation of the function as the coordinates of these two points will be in the first and third quadrants, or the second and fourth quadrants only.
For example,
Let y=\frac{1}{x}. When x=2, \ y=\frac{1}{2} and so we have the coordinate (2,\frac{1}{2}). This coordinate is in the first quadrant as both values for x and y are positive.
When x=-2, \ y=-\frac{1}{2} and so we have the coordinate (-2,-\frac{1}{2}). This coordinate is in the third quadrant as both values for x and y are negative.
So the graph of y=\frac{1}{x} will only occur in these two quadrants (it does not cross either axis),
Step-by-step guide: Coordinates maths
Step-by-step guide: Reciprocal graphs
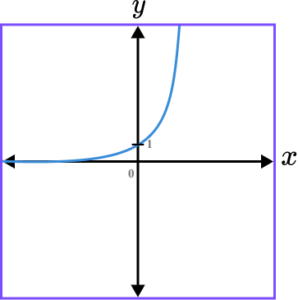
Sketching exponential graphs
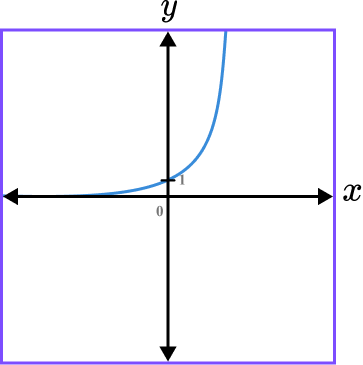
An exponential graph consists of a smooth, continuous curve and so it must be drawn freehand and without the use of a ruler.
The general form for an exponential function is y=k^{x} where k is a number raised to the power of x. You should be able to sketch the graph of the exponential function y=k^{x} when k is an integer.
Below are a few examples of the exponential function and their graphical representation.
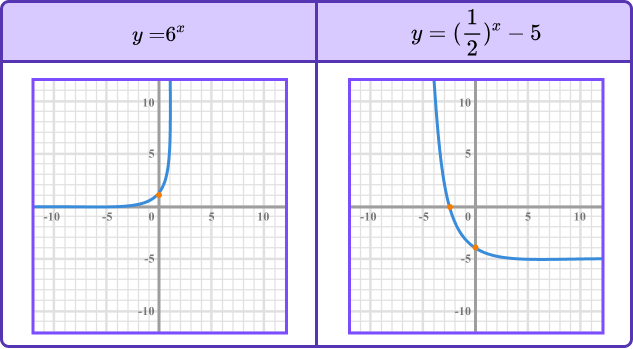
To sketch the graph of an exponential function, we need to determine the \textbf{y} -intercept. To do this, we need to substitute x=0 into the function and calculate the value for y.
Note: k^{0}=1, always.
This means that the y-intercept for an exponential function of the form y=k^{x} is always the point (0,1).
Another feature of the graph of an exponential function is the horizontal asymptote.
For negative powers of x, as the value of x gets lower (tends towards negative infinity, - \ \infty) the value of k^{x} tends towards 0, but never reaches 0.
This means that the horizontal axis for any graph of the function y=k^{x} is an asymptote – the graph gets closer and closer to it without ever touching it.
Step-by-step guide: Exponential graphs
Sketching trigonometric graphs
Trigonometric graphs are a smooth curve(s) and so they must be drawn freehand.
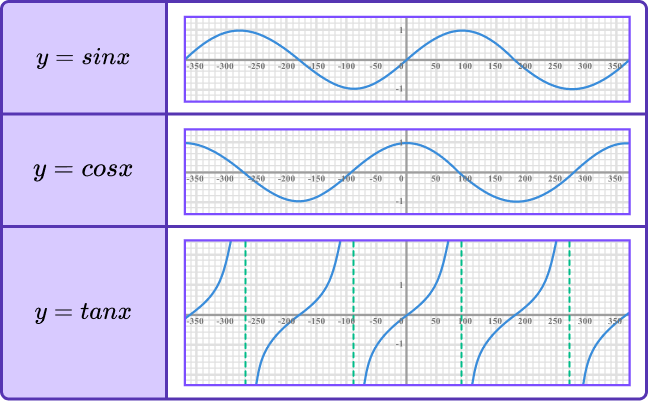
There are three trigonometric functions you need to be able to sketch.
- y=\sin(x)
- y=\cos(x)
- y=\tan(x)
You should be able to sketch each trigonometric function for the range of values of -360\leq x \leq{360} .
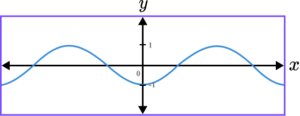
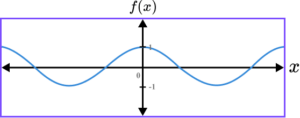
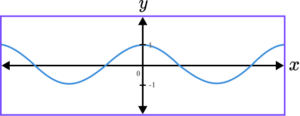
Below is the graphical representation of each trigonometric function.
To sketch the graph of a trigonometric function, we need to determine the \textbf{y} -intercept and recall the range of values for \textbf{y}.
To determine the y -intercept, we need to substitute x=0 into the function and calculate the value for y. Using exact trigonometric values, we have
- y=\sin(0)=0
- y=\cos(0)=1
- y=\tan(0)=0
Step-by-step guide: Exact trigonometric values
The range of values for each trigonometric function are
- for y=\sin(x), the range of values of y is -1\leq{y}\leq{1}
- for y=\cos(x), the range of values of y is -1\leq{y}\leq{1}
- for y=\tan(x), the range of values of y is - \ \infty\leq{y}\leq{\infty}
The graphs of the sine and cosine functions are continuous smooth curves. The graph of y=\sin(\theta) has a rotational symmetry at the origin whereas the graph of y=\cos(\theta) has a line of symmetry at the y -axis.
The graph of the tangent function is disjointed every \bf{180} degrees. This means that there are vertical asymptotes at x=-270^{\circ}, \ -90^{\circ}, \ 90^{\circ}, \ 270^{\circ} etc. as the tangent of these angles is undefined.
Step-by-step guide: Trig graphs (coming soon)
Sketching graphs of circles
A graph of a circle must be drawn using a pair of compasses.
At GCSE the general form for the equation of a circle with centre (0,0) is x^{2}+y^{2}=r^{2} where the coordinate (x,y) is a point on the circle with radius r.
Below are a few examples of the equation of a circle and their graphical representation.
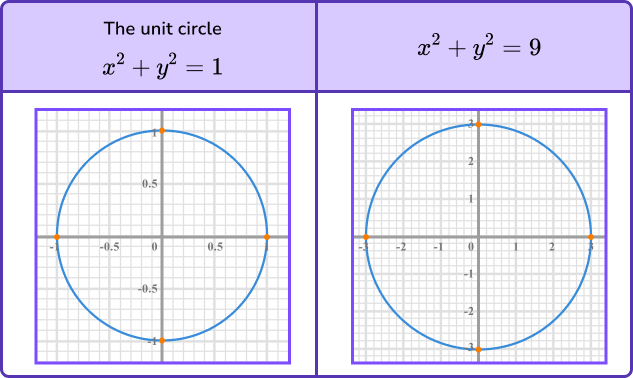
To sketch the graph of a circle, we need to
- know the location of the centre of the circle
- determine the radius of the circle
Step-by-step guide: Equation of a circle
How to sketch the graph of a function
In order to sketch the graph of a function:
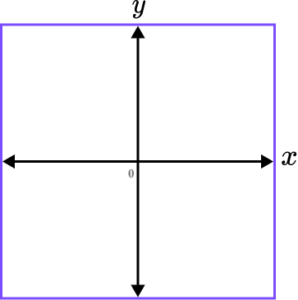
- Draw a set of axes.
- Mark and label where the graph crosses the \textbf{y} -axis.
- Sketch the graph of the function.
How to sketch the graph of a function
Sketching graphs worksheet
Get your free sketching graphs worksheet of 20+ questions and answers. Includes reasoning and applied questions.
DOWNLOAD FREE Sketching graphs worksheet
Get your free sketching graphs worksheet of 20+ questions and answers. Includes reasoning and applied questions.
DOWNLOAD FREERelated lessons on interpreting graphs
Sketching graphs is part of our series of lessons to support revision on interpreting graphs. You may find it helpful to start with the main interpreting graphs lesson for a summary of what to expect, or use the step by step guides below for further detail on individual topics. Other lessons in this series include:
Sketching graphs examples
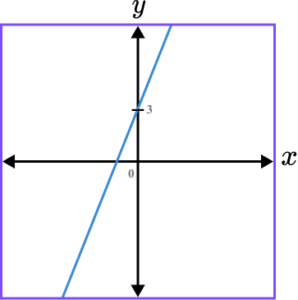
Example 1: sketching a straight line graph
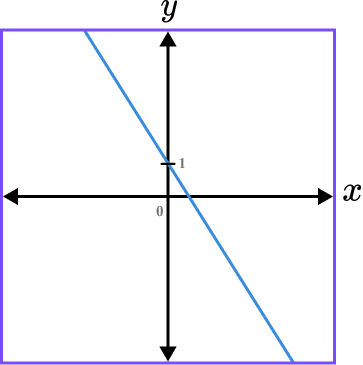
Sketch the graph of the equation y=-2x+1.
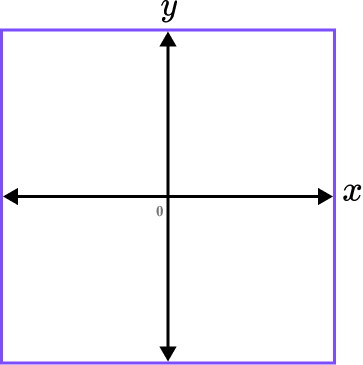
- Draw a set of axes.
Here we need to draw a set of axes with the horizontal axis labelled as x, the vertical axis is labelled y, and the origin labelled O.

2Mark and label where the graph crosses the \textbf{y} -axis.
The y -intercept is the value of c. Here, c=1.

3Sketch the graph of the function.
The graph is a straight line graph. The gradient is negative as m=-2 and so the graph must be going downhill as we move from left to right across the coordinate grid. The line must be drawn using a ruler and pass through the point labelled on the y -axis.
See also: Gradient of a line
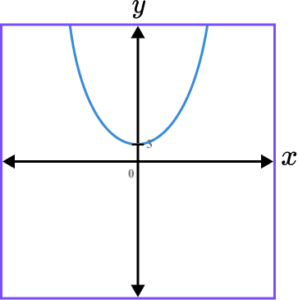
Example 2: sketching the graph of a quadratic function
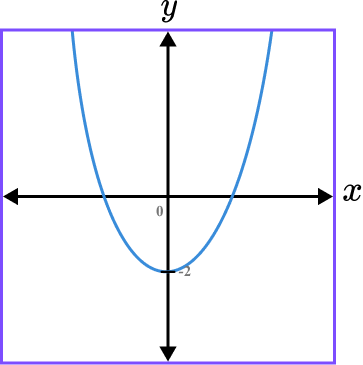
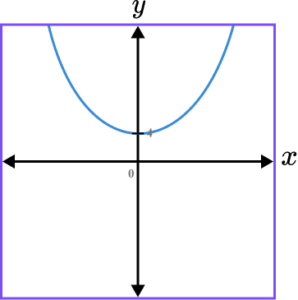
Sketch the graph of the equation y=x^{2}-2.
Here we need to draw a set of axes with the horizontal axis labelled as x, the vertical axis labelled as y, and the origin labelled O.
The y -intercept is the value of c. Here, c=-2.

The parabola is u-shaped as the coefficient of x^2 is 1, which is positive. The graph does not move left or right as there is no x term and so the graph is symmetrical about the y -axis.
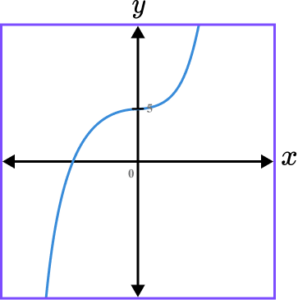
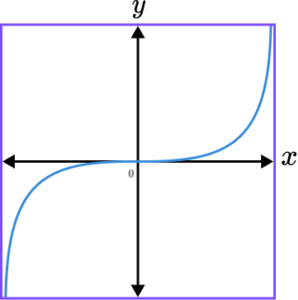
Example 3: sketching the graph of a cubic function
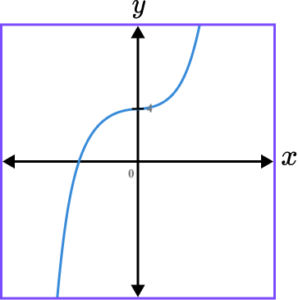
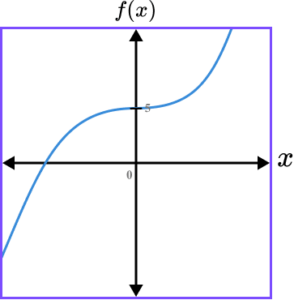
Sketch the graph of the equation f(x)=x^{3}-1.
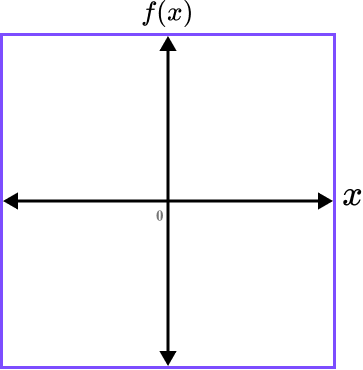
Here we need to draw a set of axes with the horizontal axis labelled as x, the vertical axis labelled as f(x), and the origin labelled O.
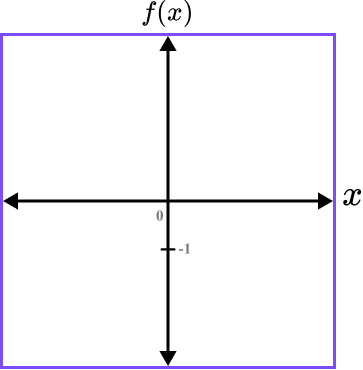
When x=0, \ f(x)=0^{3}-1=0-1=-1 and so the y -intercept is (0,-1).
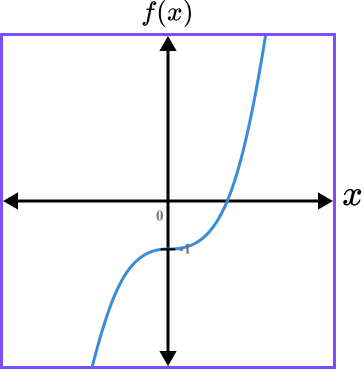
The coefficient of x^{3} is positive and so the general direction of the graph is upwards as we move across the grid from left to right. The graph intersects the y -axis at (0,-1) and has a rotational symmetry at this point.
Example 4: sketching the graph of a reciprocal function
Sketch the graph of the equation y=\frac{1}{x}.
Here we need to draw a set of axes with the horizontal axis labelled as x, the vertical axis labelled as y, and the origin labelled O.

The graph of y=\frac{1}{x} does not intercept the y -axis and so there is no value to label on the y -axis.
We can instead show the two asymptotes of x=0 and y=0.

Substituting x=1 into the equation gives y=1 which gives us the coordinate (1,1) in the first quadrant.
Substituting x=-1 into the equation gives y=-1 which gives us the coordinate (-1,-1) in the third quadrant.
Drawing the graph within the first and third quadrant gives us,
Example 5: sketching the graph of an exponential function
Sketch the graph of the equation y=2^{x}.
Here we need to draw a set of axes with the horizontal axis labelled as x, the vertical axis labelled as y, and the origin labelled O.

When x=0, \ y=2^{0}=1 and so the y -intercept is (0,1).

Plotting the smooth curve through the point (0,1), we have
Remember the horizontal axis (y=0) is an asymptote and so your sketch should not cross this line.
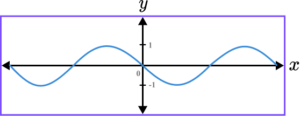
Example 6: sketching the graph of a trigonometric function
Sketch the graph of the equation y=\sin(x).
Here we need to draw a set of axes with the horizontal axis labelled as x, the vertical axis labelled as y, and the origin labelled O.
As the value of \sin(0)=0 we need to highlight the origin as the y -intercept. Also the range of values for y is between -1 and 1, so we can mark these values on the y -axis.
As the graph of y=sin(x) intercepts the horizontal axis at multiple known values, marking a few of these values onto the axis can help to draw a sketch of the function.
The graph of y= \sin(x) is a smooth, continuous curve that oscillates between -1 and 1, intersecting the origin.
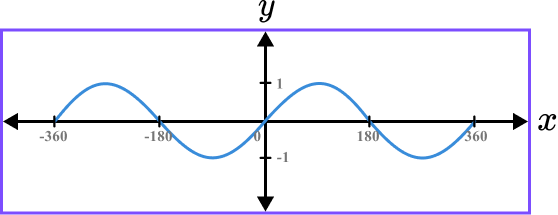
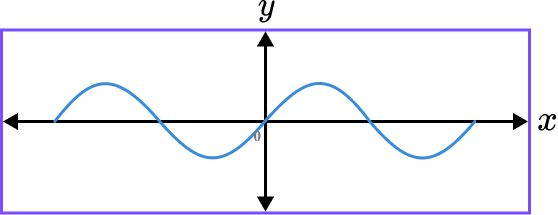
A true sketch of the graph of y=\sin(x) would not contain any axis labels apart from the y -intercept and so the graph below would also be a valid solution.
Common misconceptions
- Connecting the two curves of the reciprocal graph
The reciprocal function is undefined when x=0 and y=0. This means that the graph is disjointed (two parts that are not connected). Between the two curves are asymptotes. An asymptote is drawn using a dashed line.
- Using the correct shape for your graph
You need to learn the shapes of the different types of graphs and how they are affected by negative values (for example, a negative gradient for a linear graph or a negative coefficient of x^2 for a quadratic graph).
- Too much information
The axes do not need to contain a scale, otherwise this would become an accurate drawing of the graph. You only need to mark on the y -intercept, label the axes and highlight the origin.
- Graphs of trigonometric functions
The graph of y=\sin(x) and y=\cos(x) are very similar and so they can be incorrectly used for the other function. Also, the graph of y=\tan(x) could be incorrectly remembered as having an asymptote every 180^o but starting at the origin rather than at 90^{o}.
Practice sketching graphs questions
1. Which of the following shows a correct sketch of the graph y=4x-3?

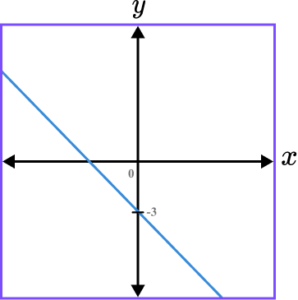
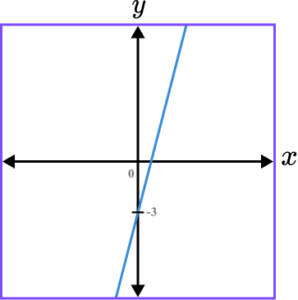

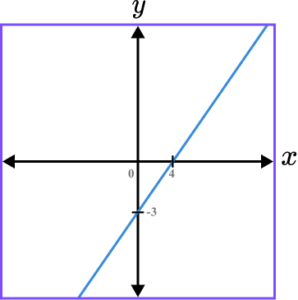
y=4x-3 is a straight line graph. The line intersects the y -axis at the point (0,-3) and the gradient of the line is positive.
2. Which of the following shows a correct sketch of the graph y=4-x^{2}?
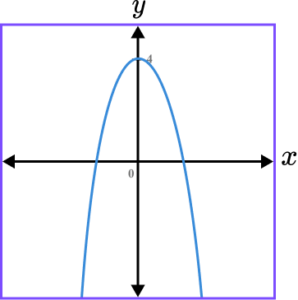
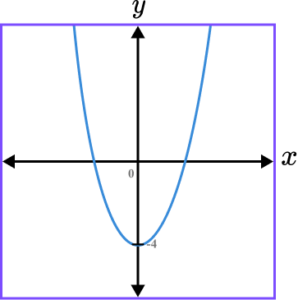
y=4-x^{2} is a quadratic graph. The line intercepts the y -axis at the point (0,4) as when x=0, \ y=4-0^{2}=4-0=4. The quadratic should look like an n-shape because the coefficient of x^{2} is negative.
3. Which of the following shows a correct sketch of the graph f(x)=5-x^{3}?
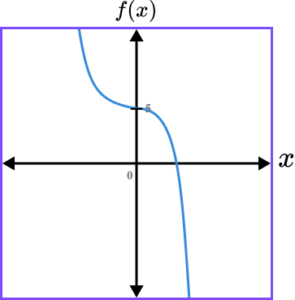
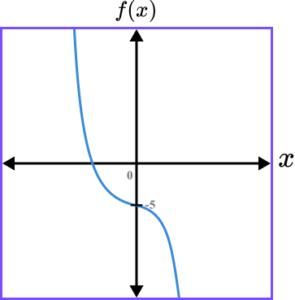
f(x)=5-x^{3} is a cubic graph. The line intersects the y -axis at the point (0,5) as when x=0, \ f(0)=5-0^{3}=5-0=5. The graph should always have a negative gradient, except for at the y -intercept because the coefficient of x^{3} is negative.
4. Which of the following shows a correct sketch of the graph y=-\frac{1}{x}?
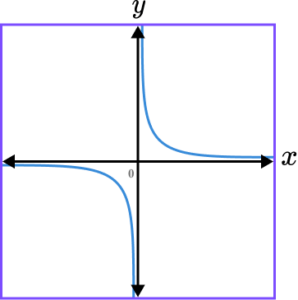
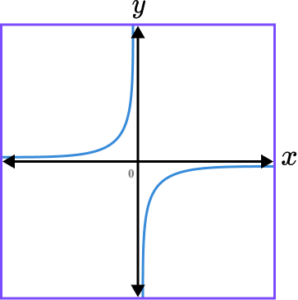
y=-\frac{1}{x} is a reciprocal graph. The line does not intercept either axis and the graph should only be drawn within the second and fourth quadrant. The x- and y- axes are both asymptotes.
5. Which of the following shows a correct sketch of the graph y=3^{x}?
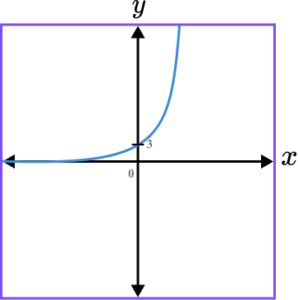
y=3^x is an exponential graph. The line intercepts the y -axis at the point (0,1) as when x=0, \ y=3^{o}=1. The x -axis is an asymptote.
6. Which of the following shows a correct sketch of the graph y=\cos(x)?
y=\cos(x) is a trigonometric graph. The line intercepts the y -axis at the point (0,1) as when x=0, \ y=\cos(0)=1.
Sketching graphs GCSE questions
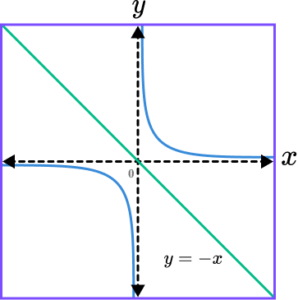
1. (a) Sketch the graph of the function y=\frac{1}{x} on the axes provided.
(b) By plotting the line y=-x, show that it is a line of symmetry for the graph drawn in part (a).
(4 marks)
(a)
Axes labelled correctly (x and y).
(1)
Asymptotes indicated (y=0 and x=0 or dashed lines provided ).
(1)
Appropriate sketch in quadrants 1 and 3 only.
(1)
(b)
(1)
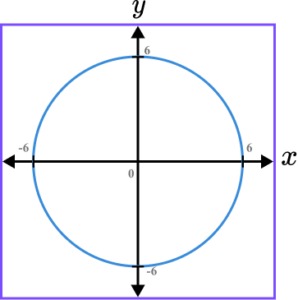
2. (a) State the centre of the circle with the equation x^{2}+y^{2}=36.
(b) Sketch the circle on the set of axes below. Label any point of intersection with an axis.
(4 marks)
(a)
(0,0) (Allow the origin)
(1)
(b)
Circle drawn with the centre at the origin.
(1)
Radius shown or calculated as \sqrt{36}=6.
(1)
(6,0), \ (0,6), \ (-6,0) and (0,-6) indicated.
(1)
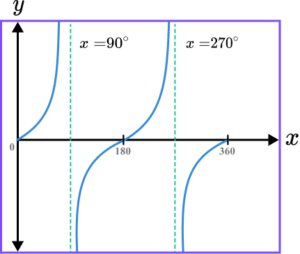
3. Sketch the graph of the function y=\tan(x) for 0\leq x\leq 360^{o}. Label each point of intersection with the horizontal axis and the equation of any asymptote.
(3 marks)
Axes labelled x and y.
(1)
3 disjointed smooth curves drawn with no negative gradient and no overlap.
(1)
Two asymptotes drawn and labelled at 90^{o} and 270^{o}.
(1)
Learning checklist
You have now learned how to:
The next lessons are
Beyond GCSE
At A-level you learn about parametric graphs.
The parametric equation of the circle x^{2}+y^{2}=r^{2} is \cos^{2}\theta+\sin^{2}\theta=1 where x=r\cos\theta and y=r\sin\theta.
A parametric equation has parameters. For the equation of a circle, the parameter is \theta (the angle from the positive x -axis to the point (x,y) on the circle).
Still stuck?
Prepare your KS4 students for maths GCSEs success with Third Space Learning. Weekly online one to one GCSE maths revision lessons delivered by expert maths tutors.

Find out more about our GCSE maths tuition programme.