GCSE Tutoring Programme
Our chosen students improved 1.19 of a grade on average - 0.45 more than those who didn't have the tutoring.
In order to access this I need to be confident with:
Plotting graphs Substitution Algebraic expressions Gradient of a line Quadratic equations Completing the squareThis topic is relevant for:

Interpreting Graphs
Here we will learn about interpreting graphs, including how to plot graphs, how to recognise different graphs, the key features of a graph, as well as sketching and transforming graphs.
You can also download a free Types of Graphs Exam Questions suitable for those following Edexcel, AQA or OCR exam boards.
What is interpreting graphs?
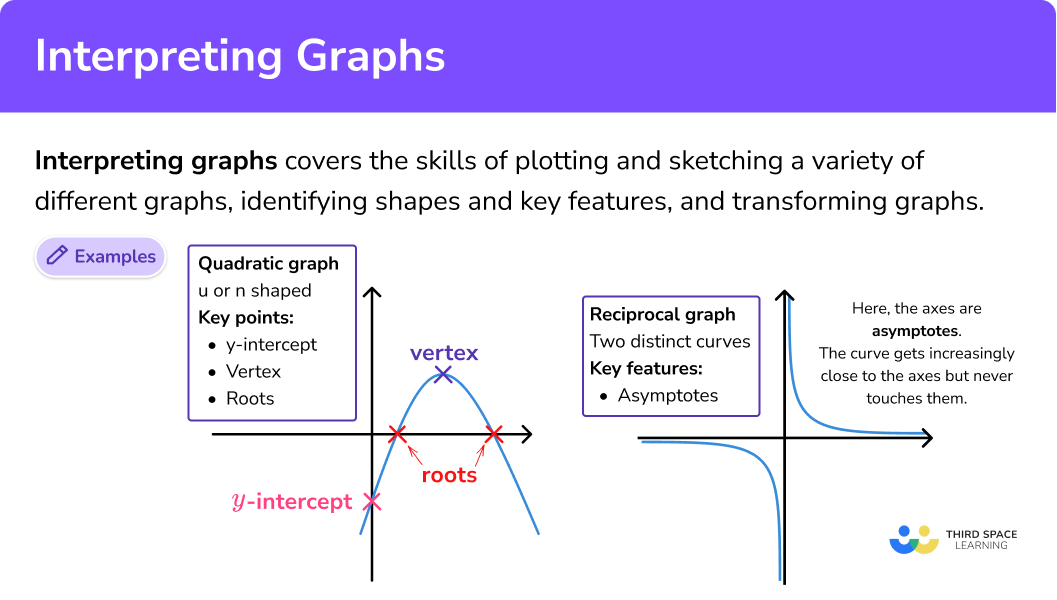
Interpreting graphs covers the skills of plotting and sketching a variety of different graphs as well as identifying the shapes and key features of those graphs. It also covers transformations of graphs.
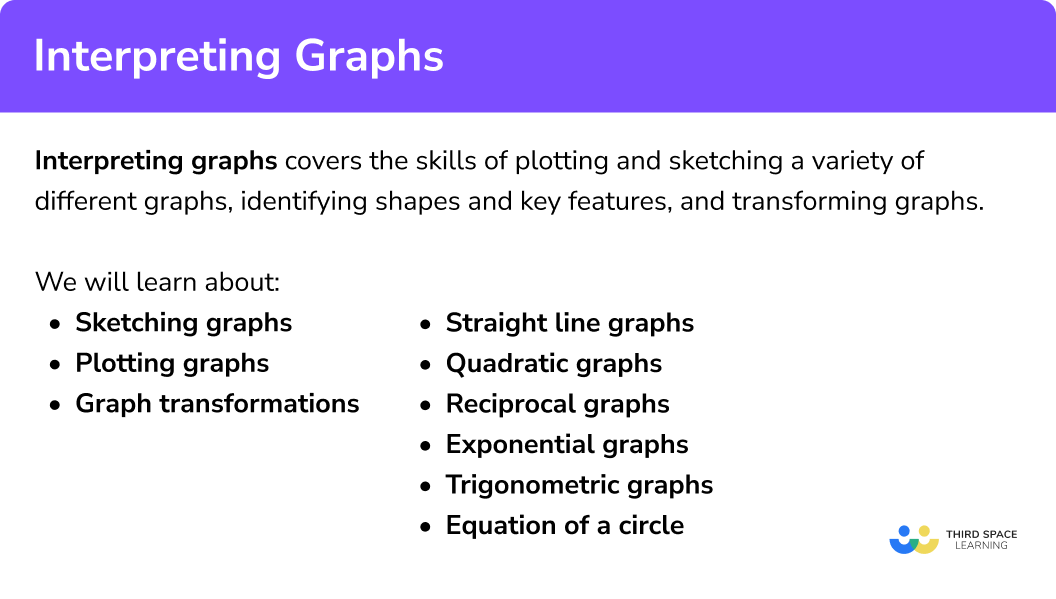
In GCSE maths, we study the following types of graphs,
- Linear graphs
- Quadratic graphs
- Cubic graphs
- Reciprocal graphs
- Exponential graphs (higher only)
- Trigonometric graphs (higher only)
- Graphs of circles (higher only)
Each type of graph has a specific shape and features which we need to be familiar with.
What is interpreting graphs?
What are the different types of graphs?
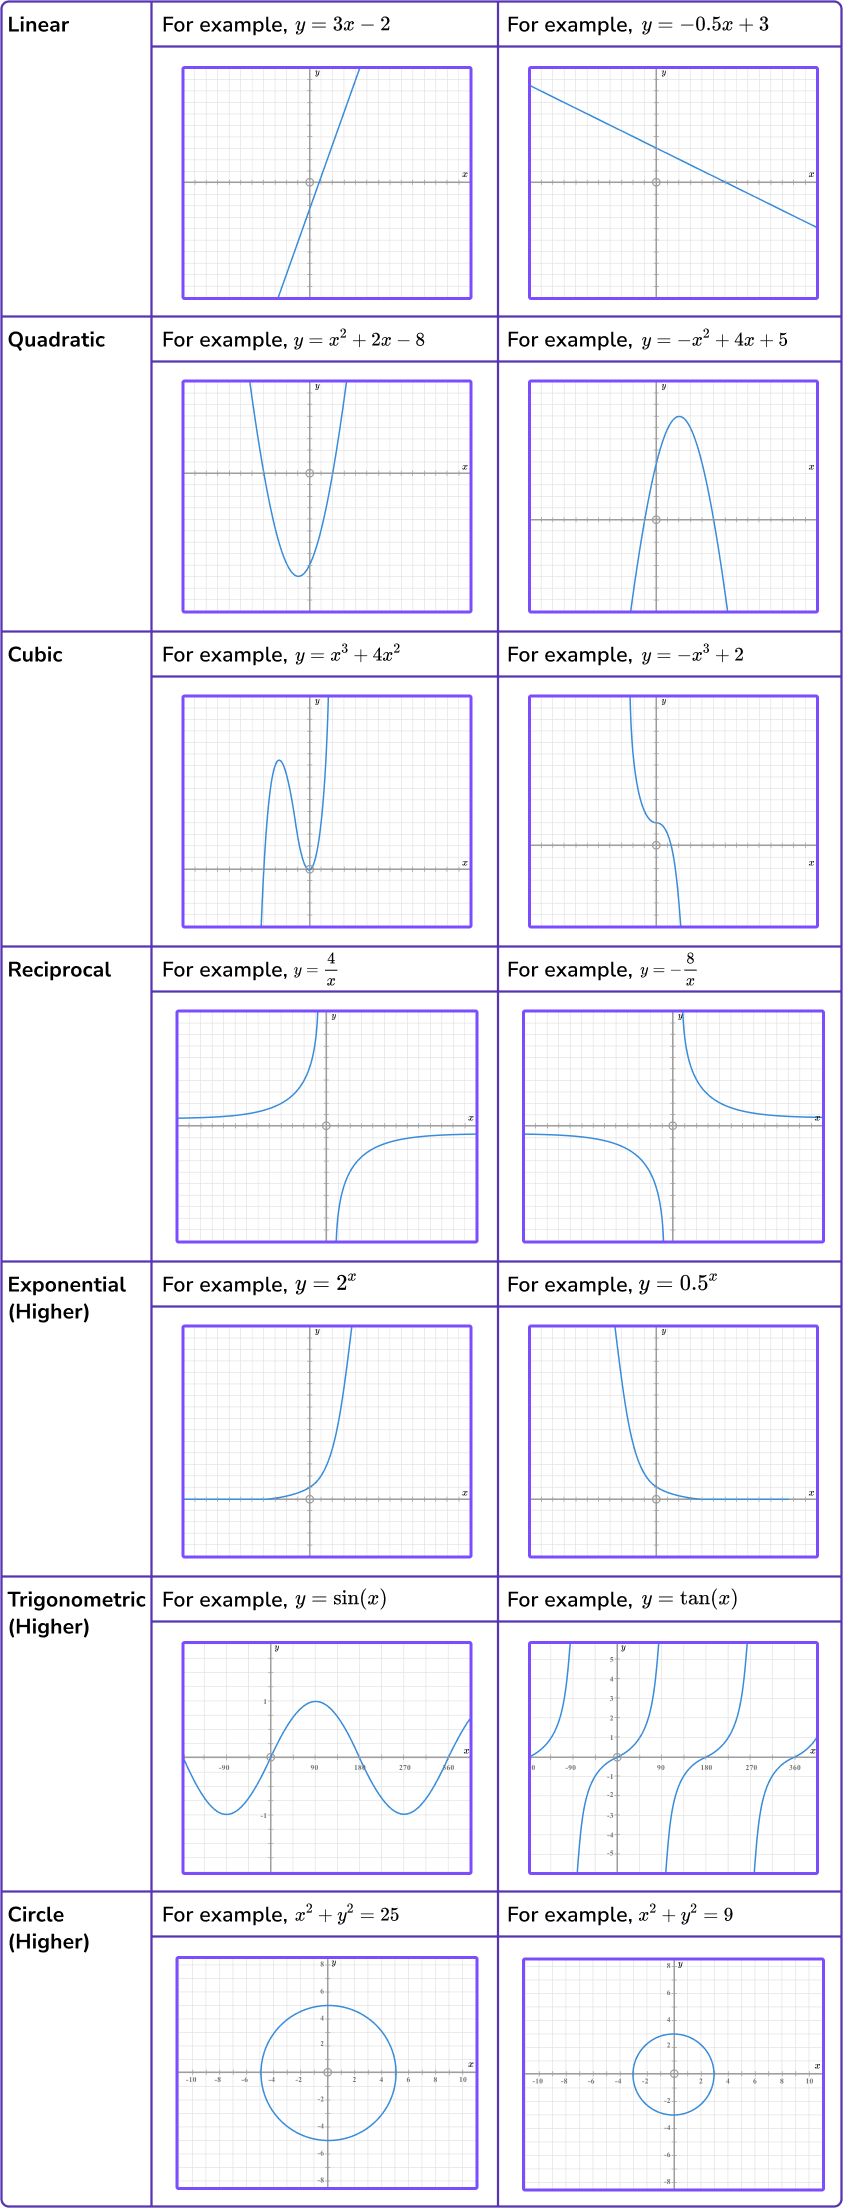
Shapes of different graphs
Different types of graphs have specific shapes and we can recognise the type of graph based on its shape.
For GCSE you need to know the shapes of the following graphs:
Special cases
Graphs of the form x=a are vertical lines and graphs of the form y=a are horizontal lines.
Key features of graphs
- \textbf{y} intercept
The y intercept of any graph is where it crosses the y axis.
For linear, quadratic and cubic graphs, the y intercept is the constant term in the equation.
For example, the graph of y=x^{2}+3x-4 has a y intercept of -4, meaning it crosses the y axis at -4. This is because when we substitute x=0 into the equation, y=-4, giving us the coordinate (0,-4).
- Gradient
The gradient of a graph is how steep the graph is. It is calculated using the formula
\text{Gradient }=\frac{\text{change in y}}{\text{change in x}}.
A positive gradient slopes upwards from left to right and a negative gradient slopes downwards.
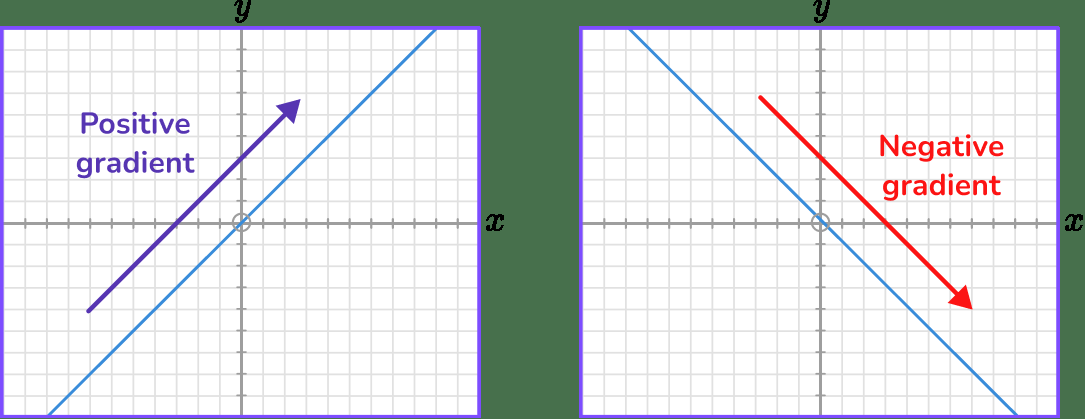
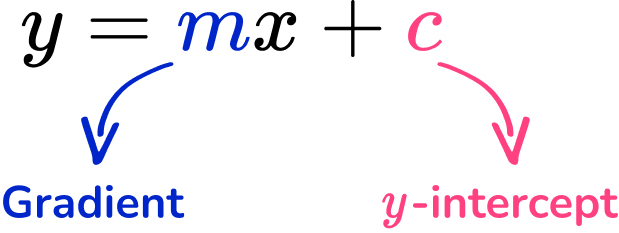
For graphs of linear equations, of the format y=mx+c, the gradient is the value of m.
For curved graphs, we can estimate the gradient of the graph at a certain point by drawing a tangent to the graph at that point and finding the gradient of the tangent.
- Roots ( \textbf{x} intercepts)
The roots, or x intercepts of a graph are the point/points where the graph crosses the x axis. We can find these points by setting y equal to 0 and then solving the equation.
For example, to find the roots of the graph y=x^{2}+5x-14, we set y equal to 0 giving
\begin{aligned} x^{2}+5x-14&=0\\\\ (x+7)(x-2)&=0 \end{aligned}
x=-7 \ or \ x=2
The graph crosses the x axis at -7 and 2.
- Turning points
On a graph, a turning point is a minimum or maximum point on the graph.
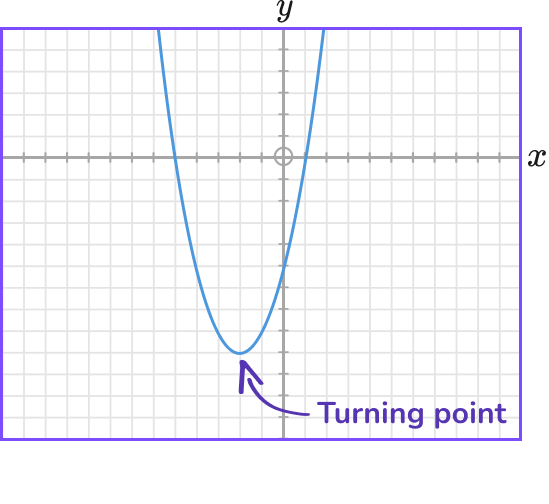
For a quadratic graph, the turning point can be found by completing the square.
For example, for the graph y=x^{2}+4x-5, we can complete the square.
\begin{aligned} y&=x^{2}+4x-5\\\\ y&=(x+2)^{2}-4-5\\\\ y&=(x+2)^{2}-9 \end{aligned}
The turning point is the minimum point of this function, which occurs when the bracket is equal to 0. For this function, the bracket is equal to 0 when x=-2 and this gives y=-9. The turning point of this function is therefore (-2, \ -9).
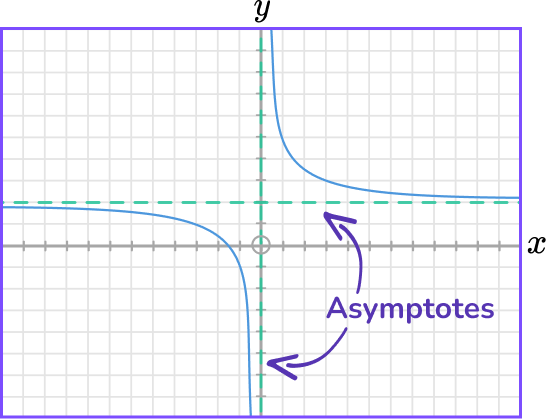
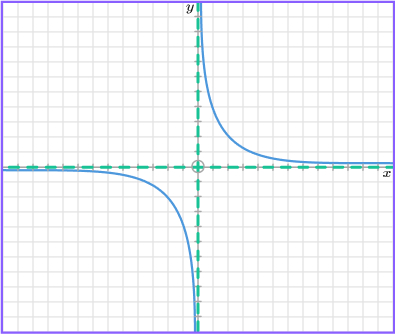
- Asymptote
An asymptote is a line that a graph approaches, without ever touching. The graph gets closer and closer to the line without ever reaching it. We see asymptotes on reciprocal graphs. The blue lines below are asymptotes.
Plotting graphs
Graphs can be plotted by creating a table of values and plotting the coordinates that are generated.
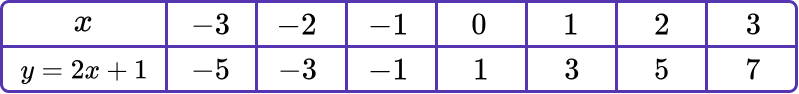
For example, let’s plot the graph y=2x+1.
The values that we choose to use for x will depend on the type of function that we are plotting. For a linear function, a good range of x values are often -3 to 3. We can then use the formula, in this case y=2x+1, to calculate the y values.
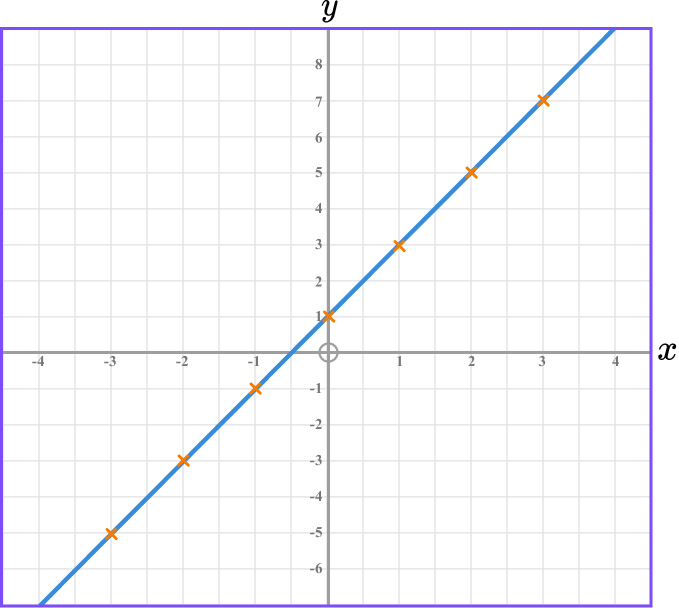
Once we have a table of values, we can plot the pairs of coordinates.
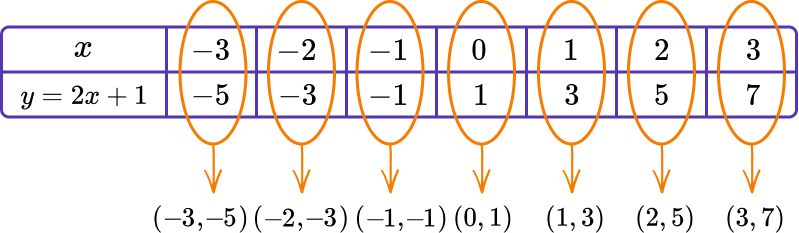
The x value represents the position on the horizontal axis and the y value represents the position on the vertical axis.
Step-by-step guide: Plotting graphs
Sketching graphs
A sketch of a graph is a rough drawing of the graph, drawn using some of the key features of the graph. For sketches, we don’t usually label the axis, we just mark the coordinates of key points on the graph.
We can sketch graphs using the following information.
- Linear graph: gradient m, and y intercept, c
- Quadratic graphs: y intercept, roots of the graph, coordinates of any turning points
- Cubic graphs: y intercept, roots of the graph
- Reciprocal graph: equations of any asymptotes, the quadrants the graph is in
- Exponential graph: y intercept, value of the base number (greater than or less then 1 )
- Graph of a circle: radius
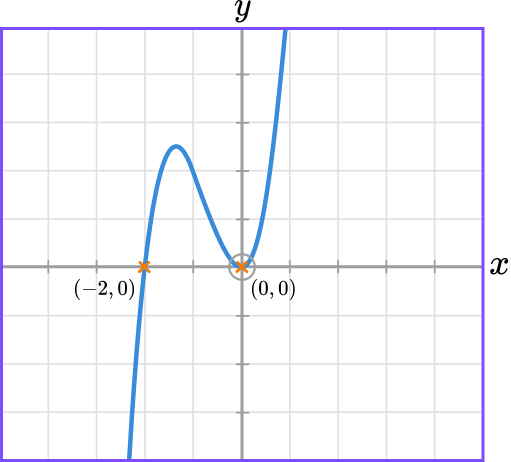
For example, we can sketch the graph of y=2x^{3}+4x^{2}.
By setting x=0, we can find the y intercept of the graph.
y=2 \times 0^{3} + 4 \times 0^{2}=0
By setting y=0 we can find any x intercepts.
\begin{aligned} 2x^{3}+4x^{2}&=0\\\\ 2x^{2}(x+2)&=0 \end{aligned}
x=0 \ or \ x=-2
We can use this information and the fact that the coefficient of x^3 is positive to sketch the graph.
Step-by-step guide: Sketching graphs
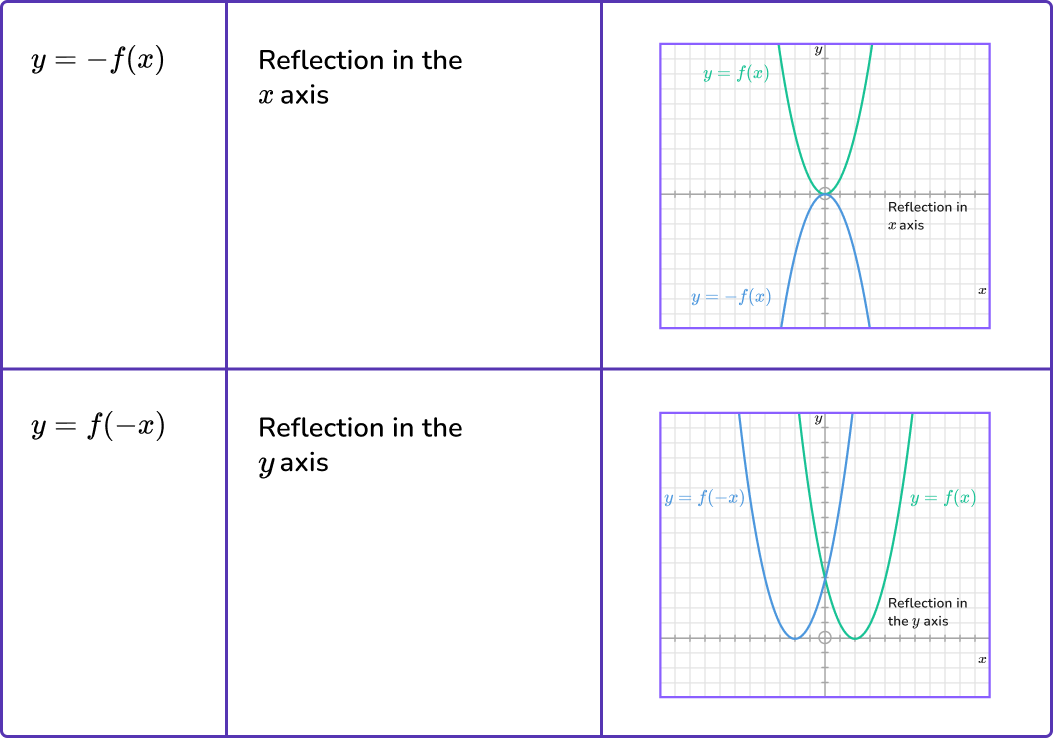
Transformations of graphs
We can perform different transformations, including translations and reflections, on graphs. Performing a transformation affects the equation of the function in a specific way.
If we have a function, y=f(x), we can apply the following transformations.
Step-by-step guide: Graph transformations
Interpreting graphs worksheet
Get your free interpreting graphs worksheet of 20+ questions and answers. Includes reasoning and applied questions.
COMING SOONInterpreting graphs worksheet
Get your free interpreting graphs worksheet of 20+ questions and answers. Includes reasoning and applied questions.
COMING SOONInterpreting graphs examples
Example 1: plotting a graph
Plot the graph of y=x^{3}-2x+1.
- Create a table, fill in suitable values for \textbf{x} and use the equation of the graph to complete the values for \textbf{y} .
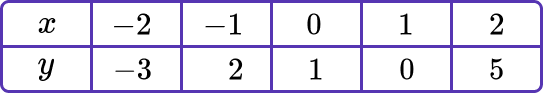
2Plot the coordinates on the axes.
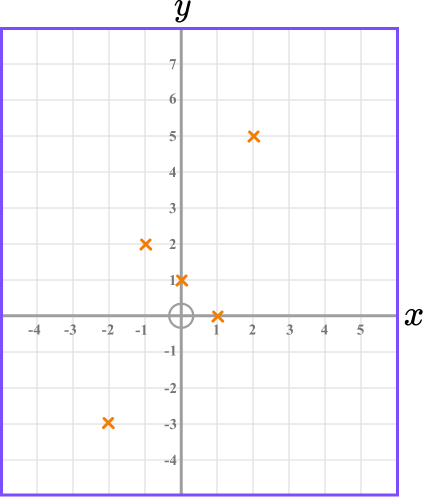
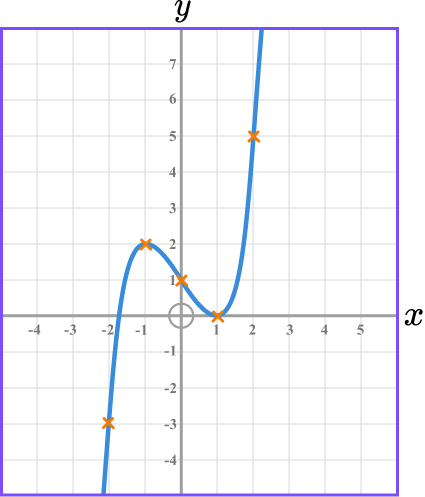
3Join the coordinates.
The points should be joined with a smooth curve.
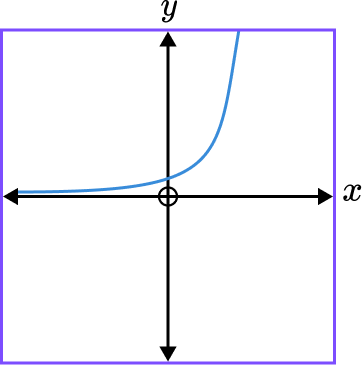
Example 2: recognising the shape of a graph
Which is the correct equation for this graph?
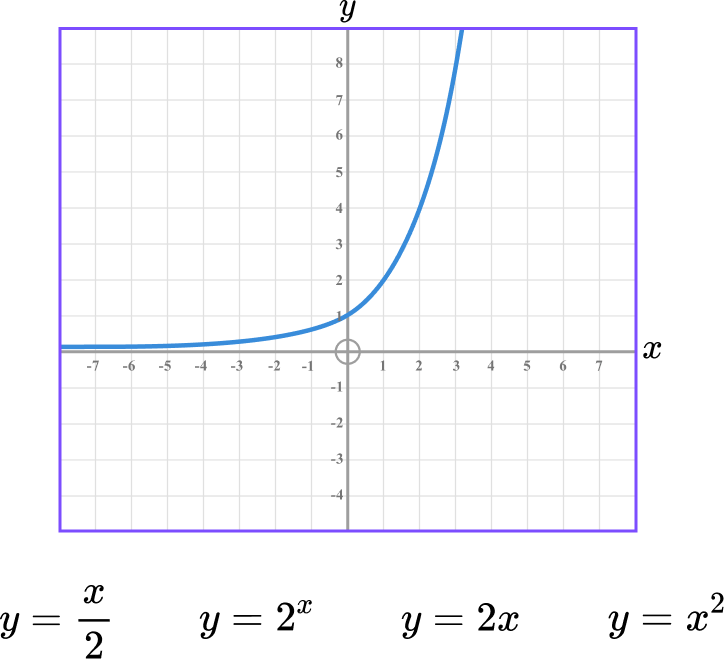
This is an exponential graph, of the form y=a^{x}.
The correct equation is y=2^{x}.
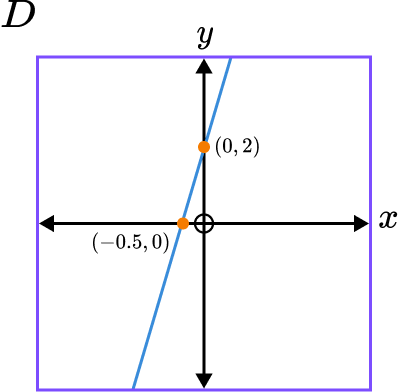
Example 3: equation of a linear graph
Find the equation of this straight line.
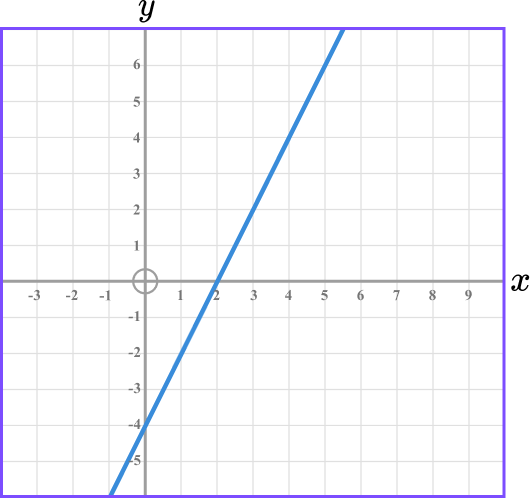
The gradient can be found using the formula
\text{Gradient }=\frac{\text{change in y}}{\text{change in x}}.
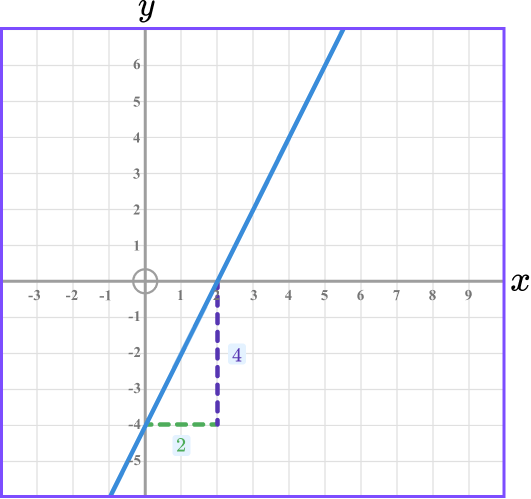
\begin{aligned} \text{Gradient }&=\frac{\text{change in y}}{\text{change in x}}\\\\ &=\frac{4}{2}\\\\ &=2 \end{aligned}
The line crosses the y axis at -4.
The equation of the line is y=2x-4.
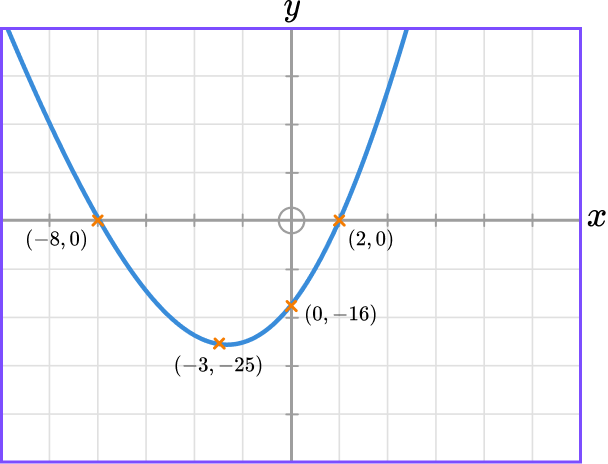
Example 4: features of a quadratic graph
Find the coordinates of any points of intersection with the axes and the coordinates of the turning point of the graph y=x^{2}+6x-16. Use these coordinates to sketch the graph.
Setting x=0,
y=0^{2}+6 \times 0-16=-16.
The graph intercepts the y axis at -16.
Setting y=0,
\begin{aligned} x^{2}+6x-16&=0\\\\ (x+8)(x-2)&=0 \end{aligned}
x=-8 \ or \ x=2
The graph intercepts the x axis at -8 and 2.
Completing the square,
\begin{aligned} y&=x^{2}+6x-16\\\\ y&=(x+3)^{2}-9-16\\\\ y&=(x+3)^{2}-25 \end{aligned}
The turning point of the graph is (-3, \ -25).
First plot the coordinates found above and then draw a smooth curve.
Example 5: sketch a reciprocal
Sketch the graph of y=\frac{3}{x}.
The asymptotes for this graph will be the lines x=0 and y=0.
The coefficient of x is positive so the graph will be in the first and third quadrants.
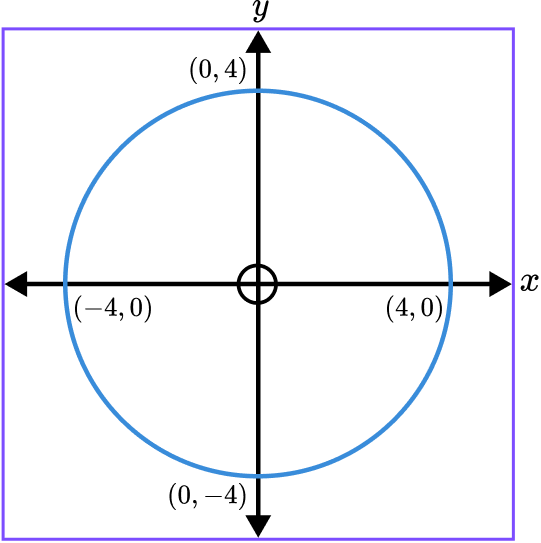
Example 6: sketch the graph of a circle
Sketch the circle x^{2}+y^{2}=16.
The radius of the circle is \sqrt{16}=4.
The centre of the circle is at (0,0) and so we have a circle with a radius of 4, centred at the origin.
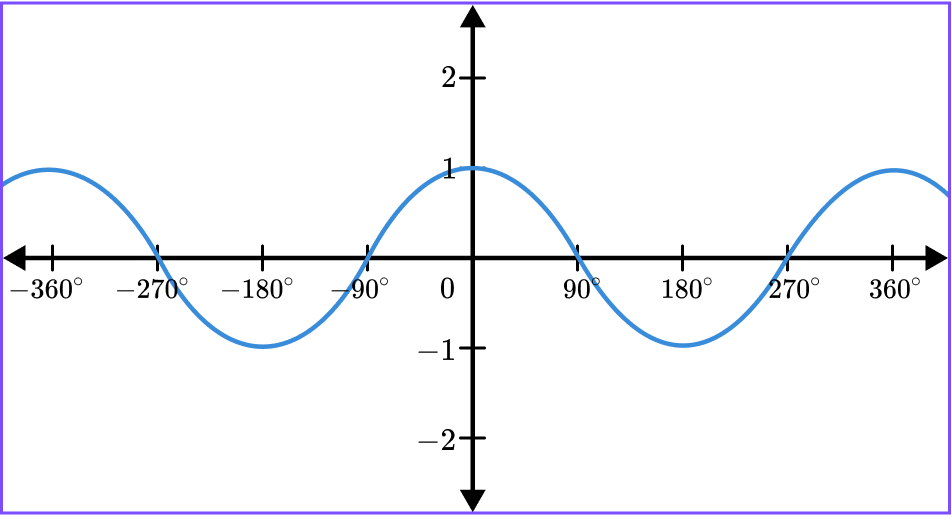
Example 7: transformation of a graph
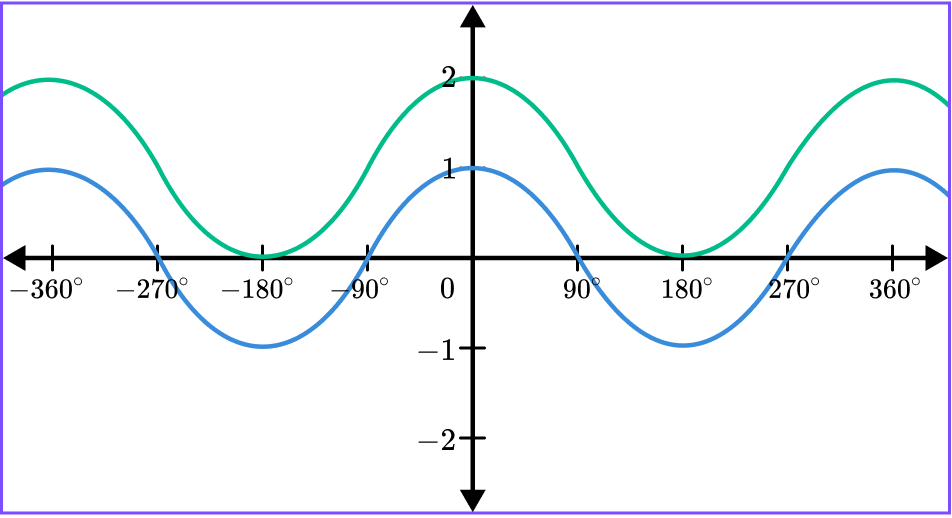
Here is a sketch of the graph y=\cos(x). On the same diagram, draw the graph of y=\cos(x)+1.
This transformation is a translation.
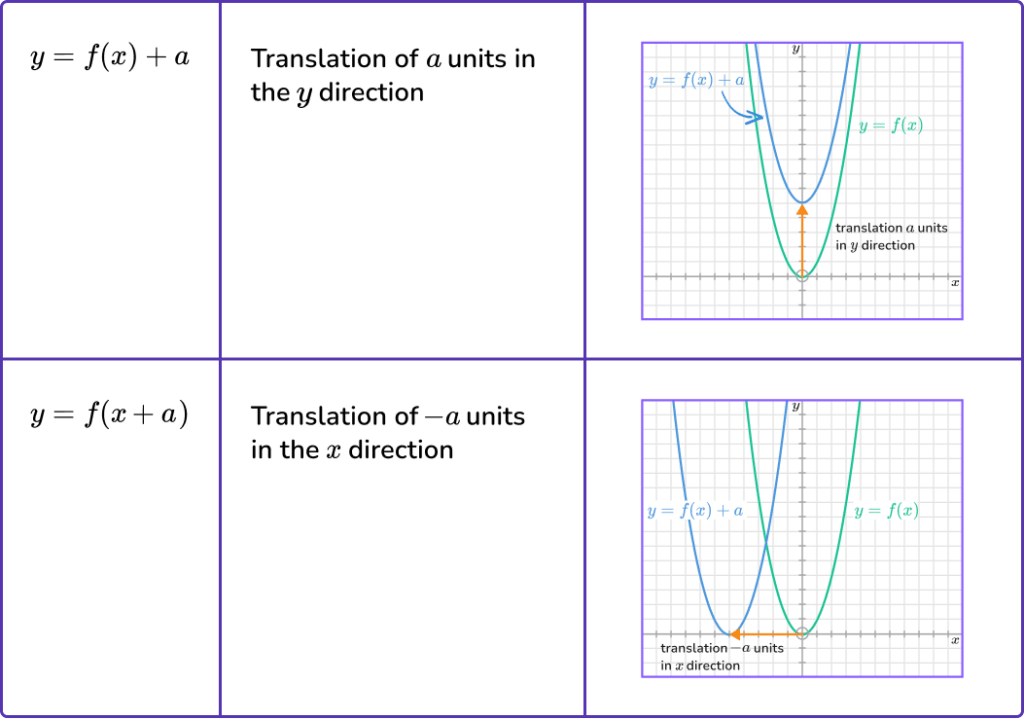
f(x)+a is a translation in the \textbf{y} -direction.
f(x-a) is a translation in the \textbf{x} -direction.
-f(x) is a reflection in the \textbf{x} -axis.
f(-x) is a reflection in the \textbf{y} -axis.
This is a transformation of the form f(x)+a, which is a translation of a unit in the y direction. In this case a=1.
Common misconceptions
- Substituting values when plotting graphs
Take care when substituting values, especially negatives.
- Straight line or curve
The points of a linear graph should be joined with a straight line but the points of any other graph should be joined with a smooth curve.
- Positive or negative gradient
Remember that a positive gradient is one which slopes upwards whereas a negative gradient slopes downwards.
- Translating a graph
The transformation f(x+a) moves the graph left by a units (a translation of -a ).
Practice interpreting graphs questions
1. Which table shows the correct values for the graph y=x^2+1?
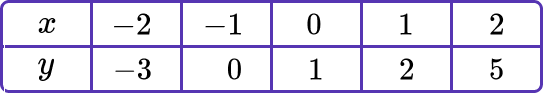

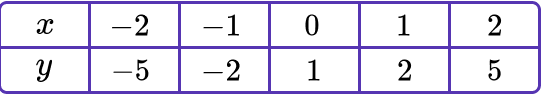
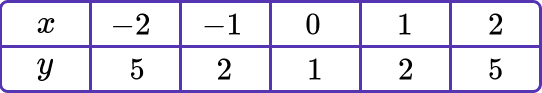

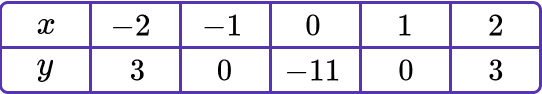
(-1)^2+1=1+1=2
(0)^2+1=0+1=1
(1)^2+1=1+1=2
(2)^2+1=4+1=5
2. Which diagram shows the graph of y=\frac{2}{x}?
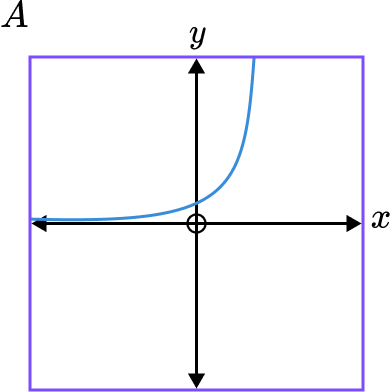
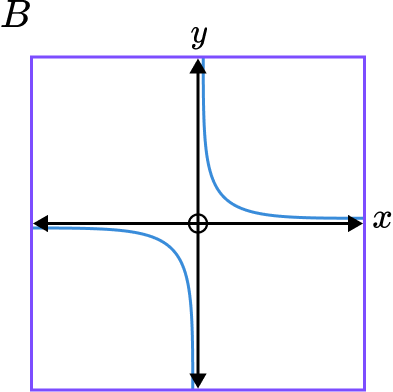
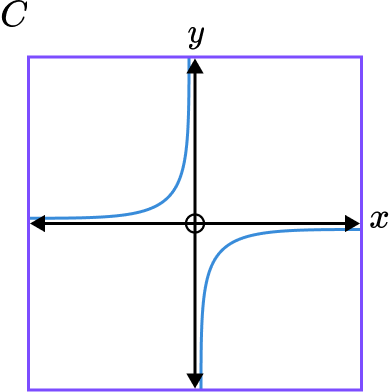
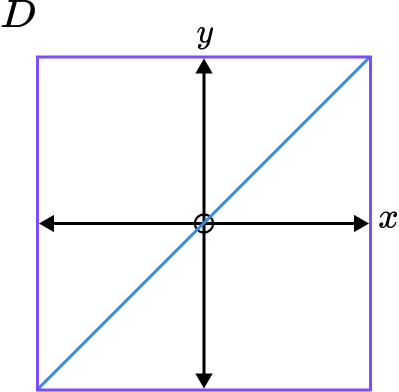
Graphs B and C are reciprocal graphs. We are looking for a positive reciprocal graph so it will be in quadrants 1 and 3. This is graph B .
3. What is the equation of this graph?
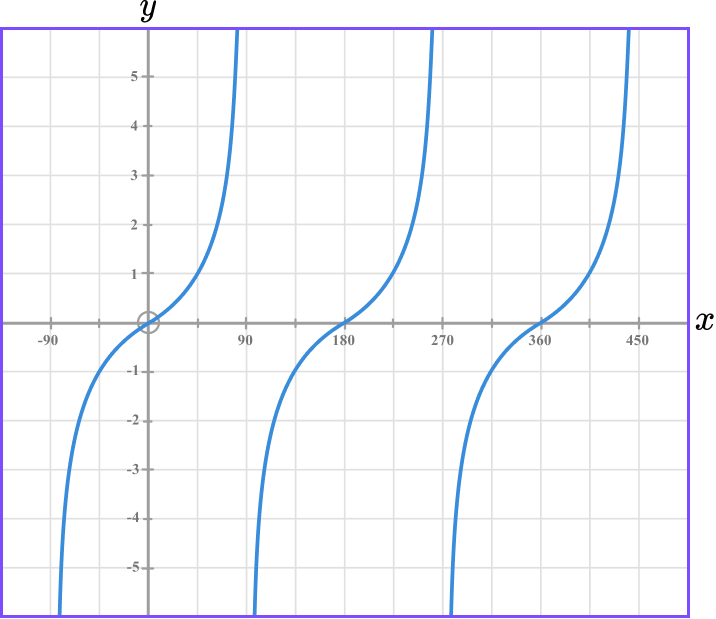
This is a trigonometric graph with asymptotes occuring every 180 degrees from 90^{\circ}. The sine and cosine functions are continuous smooth curves and so this is the graph of y=\tan(x).
4. Which of these is not a point of intersection with the axes for the graph y=x(2x^{2}-8)?
To find the points of intersection, let x=0 and y=0.
When x=0, \ y=0\times(2 \times 0^{2}-8)=0.
So (0, 0) is a point of intersection.
When y=0,
x(2x^{2}-8)=0
x=0
or
\begin{aligned} 2x^{2}-8&=0\\\\ 2x^{2}&=8\\\\ x^{2}&=4\\\\ x&=\pm 2 \end{aligned}
So (2, \ 0) and (-2, \ 0) are points of intersection.
5. Which of these shows a sketch of the graph y=4x-2?
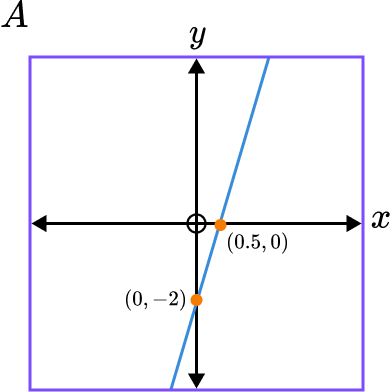
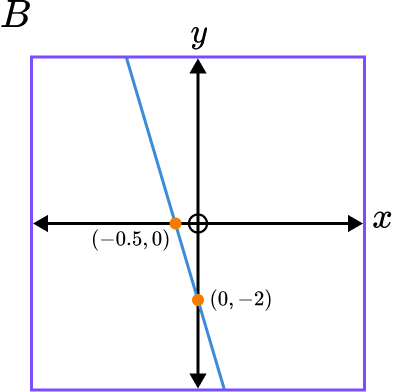
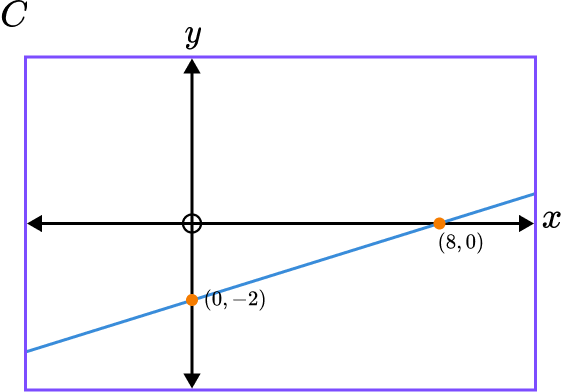
The gradient of the line is 4 and the y intercept is -2.
Graph A has a positive gradient of 4 and intercepts the y axis at -2.
6. This is the graph of y=2^{x}. Which transformation is applied to give the graph y=2^{-x}?
Reflection in the x axis.
Reflection in the y axis.
Translation of -1 in the y direction.
Translation of 1 in the x direction.
y=2^{-x} is of the form f(-x) so is a reflection in the y axis.
Interpreting graphs GCSE questions
1. (a) Complete the table of values for y=0.5x+1.
![]()
(b) Plot the graph y=0.5x+1 on the grid below.
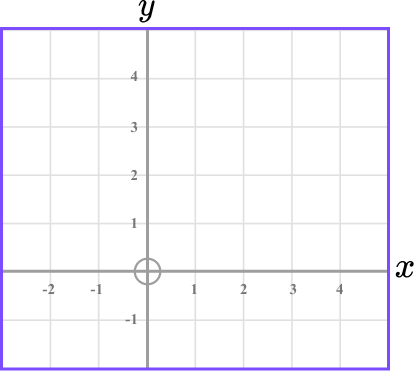
(4 marks)
(a)
![]()
At least 2 values are correct.
(1)
All three values are correct.
(1)
(b)
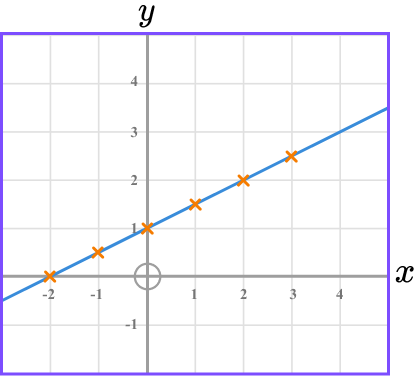
At least 4 points plotted correctly.
(1)
All points plotted and joined with a straight line.
(1)
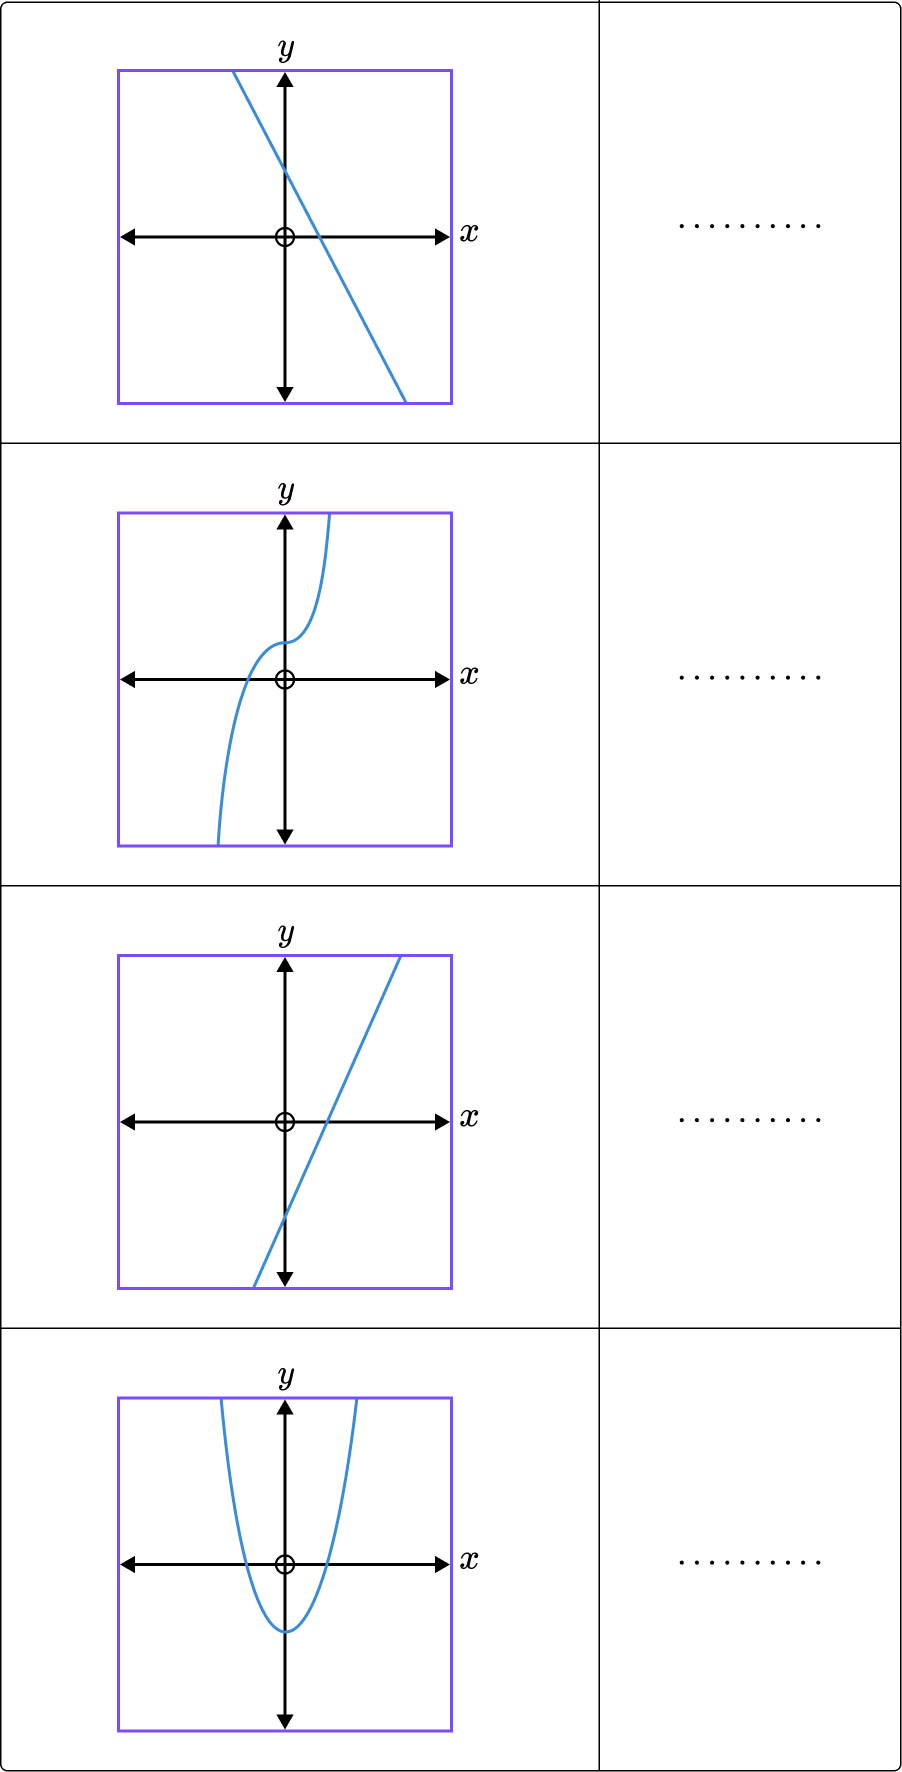
2. Write the correct letter of the equation for each graph.
A: y=2x-3 \hspace{0.4cm} B: y=x^2-3 \hspace{0.4cm} C: y=x^3+2 \hspace{0.4cm} D: y=3-2x
(2 marks)
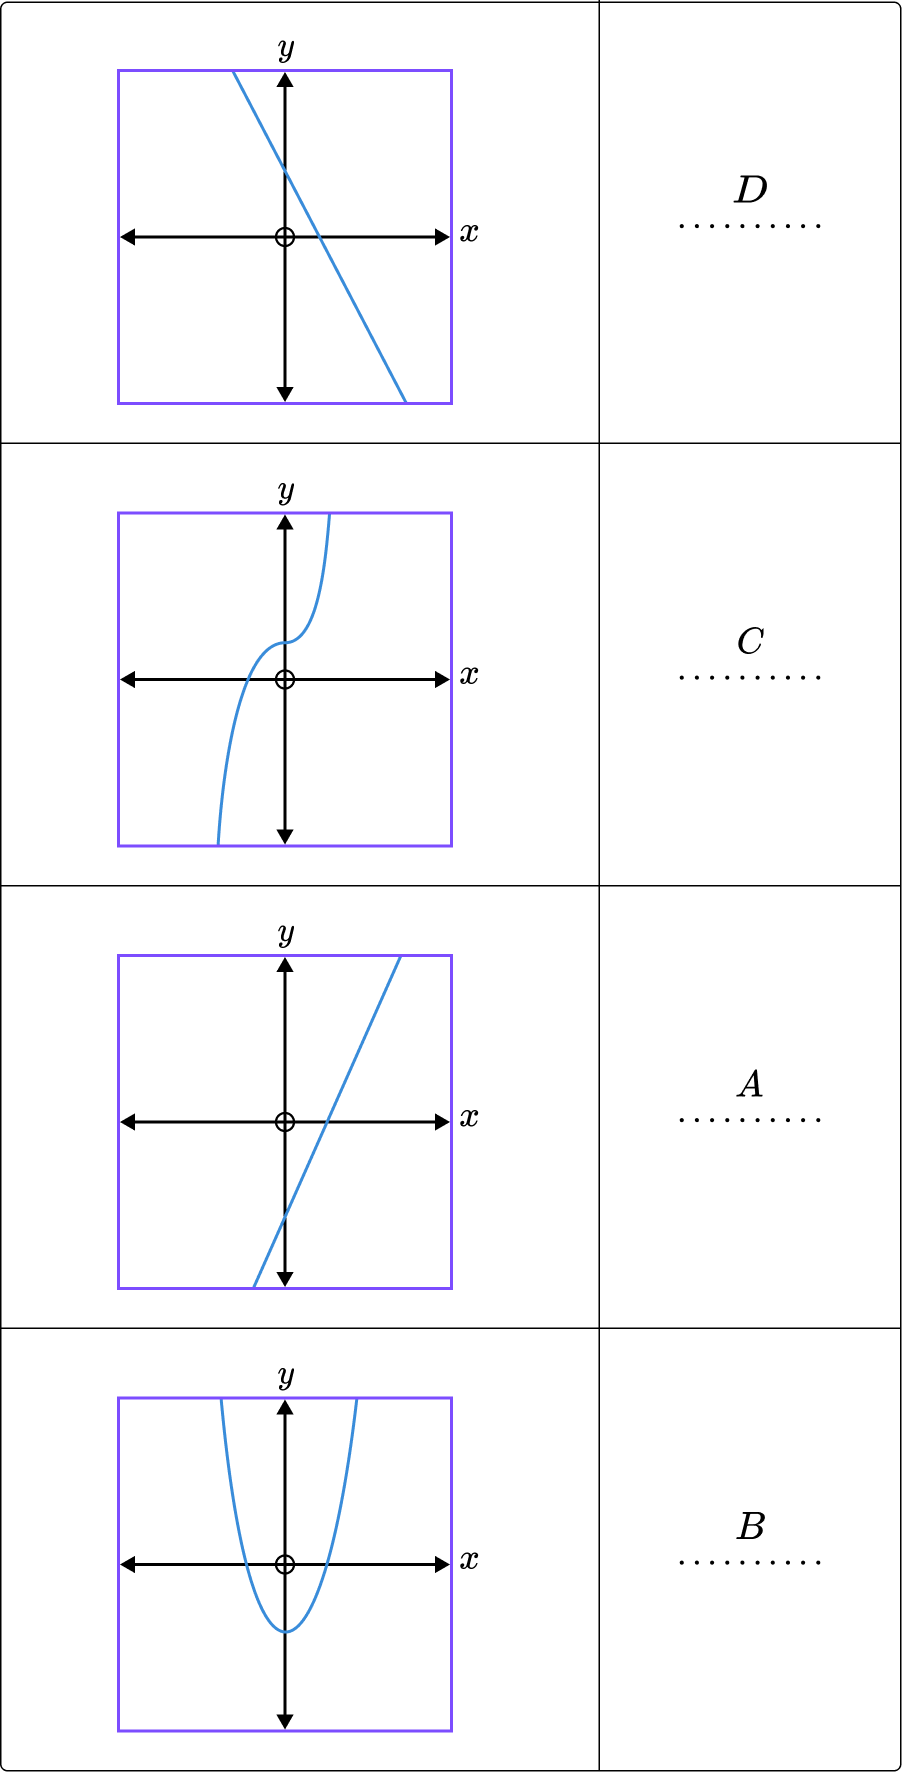
At least 2 are correct.
(1)
All 4 are correct.
(1)
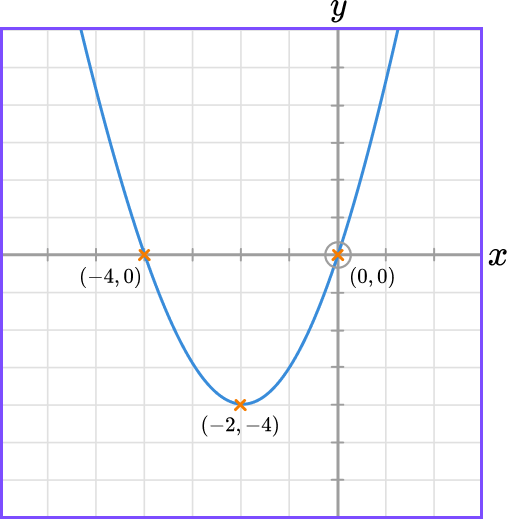
3. Sketch the graph of y=x^{2}+4x. Label any points of intersection with the axis and the turning point of the graph.
(4 marks)
(1)
x^{2}+4x=0, \ x=0 \ or \ x=-4
(1)
y=(x+2)^{2}-4, minimum point: (-2, \ -4)
(1)
Labelled sketch
(1)
Learning checklist
You have now learned how to:
The next lessons are
Still stuck?
Prepare your KS4 students for maths GCSEs success with Third Space Learning. Weekly online one to one GCSE maths revision lessons delivered by expert maths tutors.

Find out more about our GCSE maths tuition programme.