GCSE Tutoring Programme
Our chosen students improved 1.19 of a grade on average - 0.45 more than those who didn't have the tutoring.
In order to access this I need to be confident with:
Substitution Coordinates maths Straight line graphs Powers and rootsThis topic is relevant for:

Exponential Graph
Here we will learn about exponential graphs, including recognising, sketching, plotting and interpreting exponential graphs.
You can also download a free Exponential Graph Worksheet suitable for those following Edexcel, AQA or OCR exam boards.
What is an exponential graph?
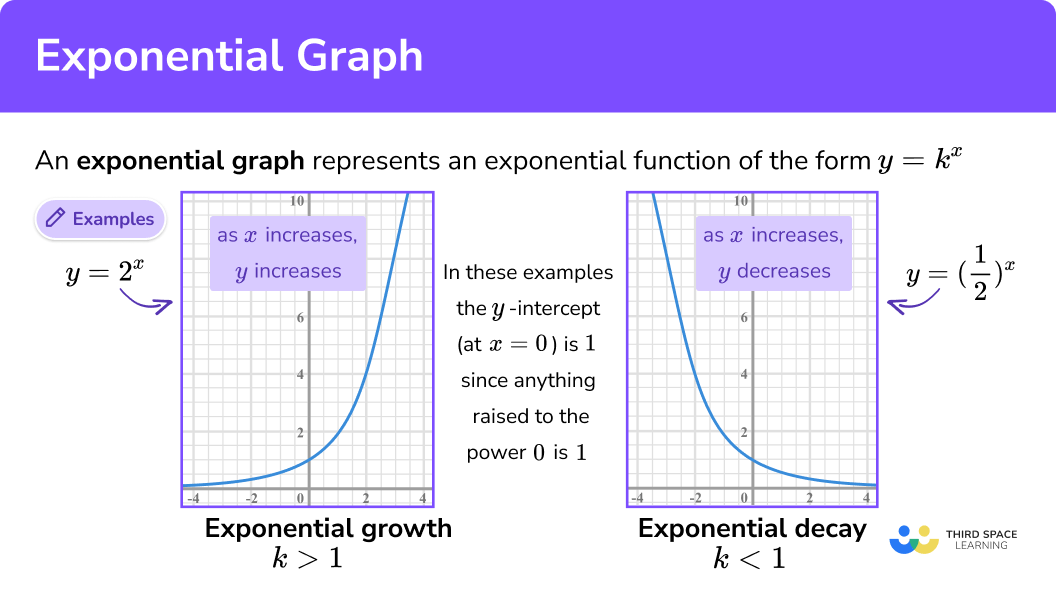
An exponential graph is a representation of an exponential function of the form
Where
The
The
The curve gets very close to the horizontal asymptote but does not touch it. This is because
The graph of an exponential function can represent either exponential growth or exponential decay:
- When
k is greater than1 it is a growth curve. Asx increases, so doesy .
It can be used to represent population growth or compound interest.
E.g.

- When
k is less than1 it is a decay curve. Asx increases,y decreases.
It can be used to represent radioactive decay.
E.g.

There are more complex exponential functions of the form:
The graphs look similar to the ones above, they have an exponent
E.g.

What is an exponential graph?
Growth and decay problems
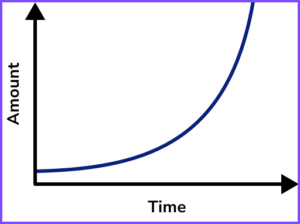
Exponential graphs can represent two types of problems, growth and decay. They involve real-life situations.
Growth problems are when the amount increases over time. An example is how a population increases over time.
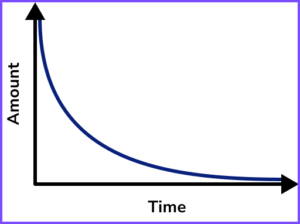
Decay problems are when the amount decreases over time. An example is the amount of radiation from a radioactive substance over time.
How to recognise an exponential graph
In order to recognise an exponential graph:
- Identify linear or quadratic or any other functions
- Identify the exponential function
- Identify your final answer
Types of graphs worksheet (includes exponential graphs)
Get your free exponential graph worksheet of 20+ types of graphs questions and answers. Includes reasoning and applied questions.
DOWNLOAD FREE Types of graphs worksheet (includes exponential graphs)
Get your free exponential graph worksheet of 20+ types of graphs questions and answers. Includes reasoning and applied questions.
DOWNLOAD FREERelated lessons on types of graphs
Exponential graph is part of our series of lessons to support revision on types of graphs. You may find it helpful to start with the main types of graphs lesson for a summary of what to expect, or use the step by step guides below for further detail on individual topics. Other lessons in this series include:
Recognising an exponential graph examples
Example 1: recognise exponential graphs
Which is the correct equation for the graph?

- Identify linear or quadratic or any other functions
y=x^2+3 is a quadratic function; its graph would be a parabola.
y=3x+1 is a linear function; its graph would be a straight line.
y=\frac{3}{x} is a reciprocal function; its graph would be a hyperbola.
2Identify the exponential function
y=3^x is an exponential function.
It has
So the graph would be a growth curve.
3Identify your final answer

The correct equation for the graph is y=3^x
Example 2: recognise exponential graphs
Which is the correct equation for the graph?

y=1-3x is a linear function; its graph would be a straight line.
y=x^2-3 is a quadratic function; its graph would be a parabola.
y=x^3 is a cubic function.
y=(\frac{1}{3})^x is an exponential function.
It has
So the graph would be a decay curve.

The correct equation for the graph is y=(\frac{1}{3})^x
How to plot an exponential graph
In order to plot an exponential graph:
- Complete the table of values
- Plot the coordinates
- Draw a smooth curve through the points
Explain how to plot an exponential graph
Plotting an exponential graph examples
Example 3: plot exponential graphs
Draw the curve of the equation for -1\leq{x}\leq3
y=2^x
Draw an


Example 4: plot exponential graphs
Draw the curve of the equation for -2\leq{x}\leq2
y=(\frac{1}{2})^x
Draw an


How to find the equation of an exponential graph
In order to find the equation of an exponential graph:
- Substitute the pairs of values into the given equation
- Solve the two simultaneous equations
- Write down the equation of the exponential function
Finding the equation of an exponential graph example
Example 5: finding the equation of an exponential graph
The sketch shows a curve with equation y = ab^x where
Find the equation of the curve.

The given equation is:
Substituting
Substituting
Since b^{0} = 1, this becomes a = 2
Now we look at the second equation:
But we know that
This can be solved to find the base
The original equation was:
We found that
Example 6: finding the equation of an exponential graph
The sketch shows a curve with equation y = ab^x where
Find the equation of the curve.

The given equation is:
Substituting
Substituting
Since anything to the power
Now we look at the second equation:
We can solve these two equations by dividing one by the other:
This becomes:
This can be solved to find the base
We can substitute b = 2 into one of the equations to find a:
The original equation was:
We found that
Common misconceptions
- Curves should be smooth
Do NOT join up the plotted points with straight lines like this:

The points should be joined by a single, smooth curve.
- All points should be on the curve
If there is a point that does not join up with the other points when a smooth curve is drawn, this point is incorrect.

Practice exponential graph questions
1. Identify the correct equation for the graph:


The curve is a growth curve; its equation will be an exponential function.
y=6^x is an exponential function.
y=6x+1 is a linear function; its graph would be a straight line.
y=x^2+1 is a quadratic function; its graph would be a parabola.
y=\frac{6}{x} is a reciprocal function; its graph would be a hyperbola.
2. Identify the correct equation for the graph:

The curve is a decay curve; its equation will be an exponential function.
y=0.1^x is an exponential function.
y=1-10x is a linear function; its graph would be a straight line.
y=x^2+1 is a quadratic function; its graph would be a parabola.
y=x^3+1 is a cubic function.
Identify the correct equation for the graph:
y=10^x


A correct table of values would be:
0 1 2
1 10 100
These x values and y values give coordinates such as (0, 1), (1, 10) and (2,100).
The coordinates are plotted on the grid.
A smooth curve should be drawn through the points.
4. Identify the correct graph for the equation:
y=(\frac{1}{5})^x


A correct table of values would be:
-2 -1 0 1
25 5 1 0.2
These x values and y values give coordinates such as (-2, 25), (-1, 5) and so on.
The coordinates are plotted on the grid.
A smooth curve should be drawn through the points.
5. Find the equation of the curve in the form
y=ab^x
where a and b are constants and b > 0.

Substituting the coordinates into the given equation gives
4=ab^0=a
Now we need to find the base b
32 = ab^3
32= 4\times b^3
8 = b^3
b = \sqrt[3]{8}
b = 2
So the equation is:
y=4\times 2^x
6. Find the equation of the curve in the form
y=ab^x
where a and b are constants and b > 0.

Substituting the coordinates into the given equation gives
21=ab^1=ab
189=ab^3
Dividing the two equations
\frac{189}{21} = \frac{ab^3}{ab}
9 = b^2
b = \sqrt{9}
b = 3
We can substitute b = 3 into one of the equations to find a.
21 = ab
21 = a\times 7
a = 7
So the equation is:
y=7\times 3^x
Exponential graph GCSE questions
1. Match the correct graph to the equation.
y=8^{x}

(1 Mark)
Graph C
(1)
2. (a) Complete the table of values for y=4^x
\begin{aligned} &x \quad \quad -1 \quad \quad 0 \quad \quad 1 \quad \quad 2 \\ &y \end{aligned}
(b) On the grid, draw the graph of y=4^{x} for -1\leq{x}\leq2

(4 Marks)
(a)
Correct values are: 0.25, 1, 4 and 16
For 1 correct y -value
(1)
For all correct y -values
(1)
(b)
for plotting the 4 points correctly
(1)
for the smooth curve
(1)

3. Here is a sketch of part of the graph y=pq^{x} where q\gt0

The points (0,3), (2,k) and (4,1875) are all on the graph y=pq^{x}
Find the value of k.
(4 Marks)
3=pq^0 = p .
for p = 3
(1)
1875=pq^4 = 3\times q^4 .
(1)
q=\sqrt[4]{625}=5 .
for q=5
(1)
k=3\times 5^2=75 .
for the correct value of k
(1)
Learning checklist
You have now learned how to:
The next lessons are
Still stuck?
Prepare your KS4 students for maths GCSEs success with Third Space Learning. Weekly online one to one GCSE maths revision lessons delivered by expert maths tutors.

Find out more about our GCSE maths tuition programme.