GCSE Tutoring Programme
Our chosen students improved 1.19 of a grade on average - 0.45 more than those who didn't have the tutoring.
In order to access this I need to be confident with:
Plotting graphs Substitution Negative numbers Factorising quadratics Completing the squareThis topic is relevant for:

Quadratic Graphs
Here we will learn about quadratic graphs including how to draw graphs of quadratic functions from a table of values, identify key points on a graph of a quadratic function, sketch a graph from these key points, and approximate solutions to quadratic equations using a graph.
You can also download the following free quadratic graphs resources all suitable for those following Edexcel, AQA or OCR exam boards:
What are quadratic graphs?
Quadratic graphs are graphs of quadratic functions – that is, any function which has x^2 as its highest power.
We can plot the graph of a quadratic function by drawing a table of values for the x and y coordinates, and then plotting these on a set of axes.
Once we have drawn the graph of the quadratic function, we can use the graph to find key points.
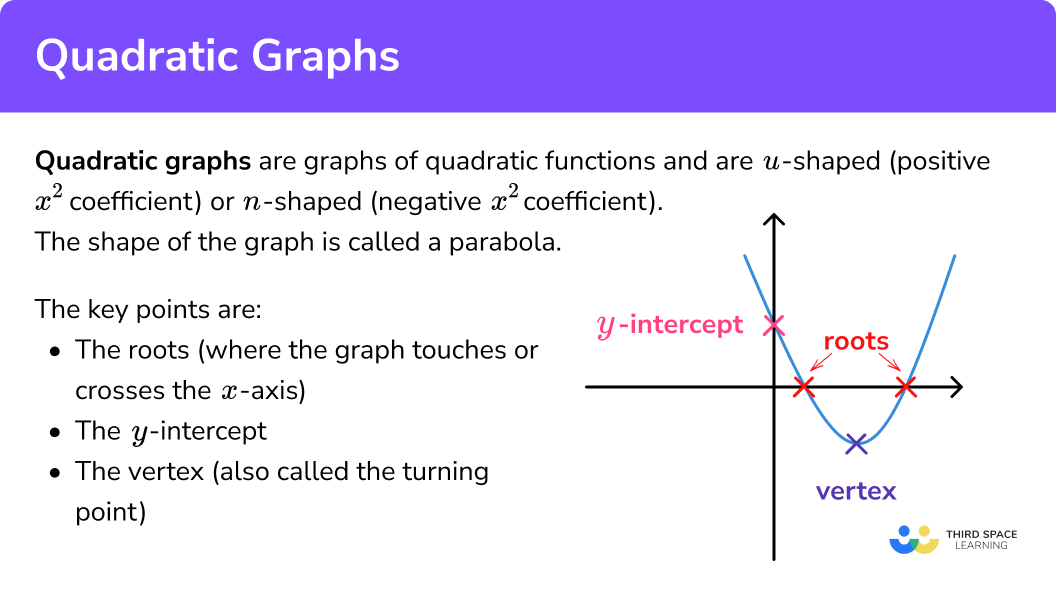
For a quadratic, these are:
- The roots (where the function crosses the x -axis, and called the x -intercepts)
- The y -intercept
- The vertex (sometimes called the turning point)

A quadratic graph is always either u-shaped (positive x^2 coefficient) or n-shaped (negative x^2 coefficient). Remember, ‘coefficient’ means ‘the number in front of’.
The shape made by the graph of a quadratic function is called a parabola. It is symmetrical, with the line, or axis, of symmetry running through the vertex.
What are quadratic graphs?
Roots of equations
The roots of equations are the solutions of quadratic equations.
E.g. consider the quadratic equation x^{2}-3x+2=0
We can solve the equation to get:
x^{2}-3x+2=0\\
(x-1)(x-2)=0
This gives x=1 or x=2. The values 1 and 2 are called the roots of the equation.
Turning point of a graph
The turning point of a quadratic graph is its minimum point or its maximum point.
For example, the graph below shows the quadratic y=x^{2}-6x+5
Its minimum point is (3, -4). It is the turning point of the graph.
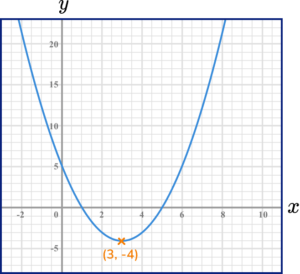
Moving from left to right you can see that the curve is falling, then turns at the minimum point and begins to rise. The gradient is changing from negative to zero to positive.
Let’s look at another example.
The graph is of the quadratic y=-x^{2}+2x+15 . Its maximum point is (1, 16). It is the turning point of the graph.
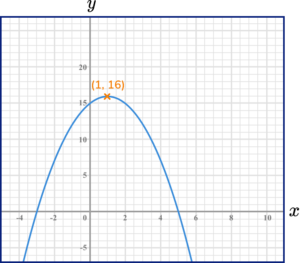
Moving from left to right you can see that the curve is rising, then turns at the maximum point and begins to fall. The gradient is changing from positive to zero to negative.
How to use quadratic graphs
There are a variety of ways we can use quadratic graphs:
1 Plotting quadratic graphs
We can plot quadratic graphs using a table of values and substituting values of x into a quadratic function to give the corresponding y values.
Once we have a series of corresponding x and y values we can plot the points on a graph and join them to make a smooth curved u-shaped or n-shaped graph.
Step-by-step guide: Plotting quadratic graphs
2 Solving quadratic equations graphically
We can use quadratic graphs to work out estimated solutions or roots for quadratic equations or functions.
We can calculate the roots of a quadratic equation when it equals 0 by noting where the quadratic graph crosses the x axis.
We can calculate the solutions of a quadratic equation by plotting the graphs of the functions on both sides of the equals sign and noting where the graphs intersect.
Step–by-step guide: Solving quadratic equations graphically
3 Sketching quadratic graphs
We can sketch a quadratic graph by working out the y -intercept, the roots and the turning points of the quadratic function and plotting these points on a graph.
We need to note whether graph is u-shaped or n-shaped by looking at the coefficient of the x^2 term, before joining up all of the plotted points to form the sketch of the quadratic graph.
Step-by-step guide: Sketching quadratic graphs
See also: Types of graphs
Explain how to use quadratic graphs
Quadratic graphs worksheet
Get your free quadratic graphs worksheet of 20+ questions and answers. Includes reasoning and applied questions.
DOWNLOAD FREE Quadratic graphs worksheet
Get your free quadratic graphs worksheet of 20+ questions and answers. Includes reasoning and applied questions.
DOWNLOAD FREE1. Plotting quadratic graphs
Example 1: Plotting a simple quadratic graph
Draw the graph of y=x^{2}+3
- Draw a table of values, and substitute x values to find matching y values.
\begin{aligned} &x \quad \quad -3 \quad \quad -2 \quad \quad -1 \quad \quad \quad 0 \quad \quad \quad 1 \quad \quad \quad 2 \quad \quad \quad \; 3 \\ &y \quad \quad \;\;12 \quad \quad \quad 7 \quad \quad \quad 4 \quad \quad \quad 3 \quad \quad \quad 4 \quad \quad \quad 7 \quad \quad \quad 12 \end{aligned}
When:
\begin{aligned} &x=-3, \;\; y=(-3)^{2}+3=9+3=12 \\\\ &x=-2, \;\; y=(-2)^{2}+3=4+3=7 \\\\ &x=-1, \;\; y=(-1)^{2}+3=1+3=4 \\\\ \end{aligned}
And so on…
2Plot these coordinate pairs on a graph.

3Join the points with a smooth curve.

2. Solving quadratic equations graphically
Example 2: Solving using a graph
Here is the graph of the function y=x^{2}+3 .
(Note that this is the graph we’ve just drawn above).

Use this graph to find the solutions of the equation x^{2}+4=8 .
The equation is x^{2}+4=8 and the graph we’re given is of the function y=x^{2}+3 . We need to subtract 1 from the constant term, so the LHS of the equation matches the RHS of the function:

Write y=7 and plot this.

It is a horizontal line through the y -axis at 7 :

Find the two points where the line and curve meet; we draw vertical lines down to the x -axis and read off the x -coordinate values.

We have solutions x=-2, \; x=2.
3. Sketching quadratic graphs
Example 3: Sketching a trinomial quadratic
For the quadratic function y=x^{2}-2x-8 , find the y -intercept, roots and vertex, and hence, sketch the graph.
Coefficient of x^2 is (positive) 1 , so the graph is u shaped.
The constant term is -8 , so the coordinates of the y -intercept are (0,-8) .
\begin{aligned} &0=x^{2}-2 x-8 \\\\ &0=(x-4)(x+2) \quad \text{(by factorising)} \end{aligned}
Solutions: x=4,\; x=-2 .
This quadratic function has two (real) roots, and crosses the x axis at
x=4, \; x=-2 .
x^{2}-2x-8=(x-1)^{2}-9
From this, the coordinates of the vertex are (1,-9) (see Completing the Square for a step–by-step guide). This vertex is a minimum, because we’re dealing with a u shaped graph.
Sketch a set of axes, label each of the key points, then join with a smooth curve:

Common misconceptions
- Drawing a pointy vertex
Make sure that the vertex of the graph is a smooth curve, not pointed.

- Making errors when dealing with negative x values, particularly when squaring
E.g.
(-3)^2 = 9 , not -9 .
If you’re using your calculator, make sure you include brackets around the x value that you are squaring.
- Forgetting to rearrange when necessary
In order to solve when you haven’t been given a graph, rearrange so that one size equals 0 , then find the roots. In order to solve when you have been given a graph, rearrange so that one side of the equation matches the function that’s been graphed.
- Not using the coefficient of x^2 to find the shape of the graph
Positive coefficient = u shaped.
Negative coefficient = n shaped.
Practice quadratic graphs questions
1. Draw the graph of y=x^{2}-3x


The quadratic factorises to give x(x-3) so the roots are x=0 and x=3 . The y -intercept is (0,0) and the graph is a u shape because the x^2 coefficient is positive.
2. Draw the graph of y=5-2x^{2}


The quadratic has two roots, which could be found by completing the square or using the quadratic formula. The constant term is 5 so the y intercept is (0,5) . The graph is a n shape because the x^2 coefficient is negative.
3. Find the solutions of the equation x^{2}-3x=0 graphically.
(Note: You drew this graph in Practice Question 1 )

The RHS is already 0 , so plot the function on a graph and find the roots.
4. Find the solutions of the equation 5-2x^{2}=4 graphically, to 1 decimal place.
(Note: You drew this graph in Practice Question 2 )

5. Sketch the graph of y=x^{2}-6x


y intercept (0,0) . Factorise to x(x-6) to get roots x=0 and x=6 .
CTS (x-3)^{2}-9 gives vertex (3,-9) . Graph is a u shape because x^2 coefficient is positive.
6. Sketch the graph of y=x^{2}+4x+6


y intercept (0,-6) . The equation cannot be factorise or solved using the quadratic formula, so has no real roots. CTS (x+2)^{2}+2 gives vertex (-2,2) . Graph is a u shape because x^2 coefficient is positive.
Quadratic graphs GCSE questions
1. (a) Complete the table of values for y=x^{2}+3x-1
\begin{aligned} &x \quad -5 \quad -4 \quad -3 \quad -2 \quad -1 \quad 0 \quad 1 \quad 2 \\ &y \quad \quad \quad \quad\quad \quad \, -1 \quad \quad \quad \quad \quad \quad \quad \;3 \end{aligned}
(b) On the grid draw the graph of y=x^{2}+3x-1 for values of x from -5 to 2 .

(c) Use the graph to find estimates of the solutions to the equation 4=x^{2}+3x-1
(6 marks)
(a)
\begin{aligned} &x \quad -5 \quad -4 \quad -3 \quad -2 \quad -1 \quad \quad 0 \quad \quad 1 \quad \quad2 \\ &y \quad \quad 9 \quad \quad 3 \quad -1 \quad -3 \quad -3 \quad -1 \quad \quad 3 \quad \quad 9 \end{aligned}
4 correct values
(1)
All correct values
(1)
(b)

Points plotted correctly ft. pt (a)
(1)
Points joined with a smooth curve
(1)
(c)

Line y= drawn on graph
(1)
Solutions \pm 0.1
(1)
2. Here is the graph of y=x^{2}-6x+3

(a) Write down the turning point of the graph
y=x^{2}-6x+3
(b) Use the graph to find approximate roots of the equation x^{2}+3=6x .
(3 marks)
(a) (3, -6)
(1)
(b) x=0.5, x=5.5
(2)
3. (a) Complete the table of values for y=3+4x-x^{2}
\begin{aligned} &x \quad \quad -1\quad \quad 0 \quad \quad 1 \quad \quad 2 \quad \quad 3 \quad \quad 4 \quad \quad 5 \\ &y \quad \quad \quad \quad \quad \quad \quad \quad6\quad\quad \quad\quad \quad \quad \quad 3 \end{aligned}
(b) Draw the graph of y=3+4x-x^{2} for values of x from -1 to 5 .

(c) Use the graph to find estimates of the solutions to the equation 3+4x-x^{2}=5
(d) Use the graph to find the coordinates of the turning point of the graph y=3+4x-x^{2}
(8 marks)
(a)
\begin{aligned} &x \quad \quad -1\quad \quad 0 \quad \quad 1 \quad \quad 2 \quad \quad 3 \quad \quad 4 \quad \quad 5 \\ &y \quad \quad -2\quad \quad 3 \quad \quad 6 \quad \quad 7 \quad \quad 6 \quad \quad 3 \quad \; -2 \end{aligned}
3 correct values
(1)
All correct values
(1)
(b)

Points plotted correctly ft. pt (a)
(1)
Points joined with a smooth curve
(1)
(c)
Line y= 5 drawn on graph
(1)
x=0.6 , x=3.4
(1)
(d)
(2,7)
(2)
Learning checklist
You have now learned how to:
The next lessons are
Still stuck?
Prepare your KS4 students for maths GCSEs success with Third Space Learning. Weekly online one to one GCSE maths revision lessons delivered by expert maths tutors.

Find out more about our GCSE maths tuition programme.