GCSE Tutoring Programme
Our chosen students improved 1.19 of a grade on average - 0.45 more than those who didn't have the tutoring.
In order to access this I need to be confident with:
Plotting graphs Substitution Negative numbers Linear graphThis topic is relevant for:

Solving Quadratic Equations Graphically
Here we will learn about solving quadratic equations graphically including how to find the roots of a quadratic function from a graph, how to use this method to solve any quadratic equation by drawing a graph, and then how to solve a quadratic equation from a graph that is already drawn for you.
You can also download the following free solving quadratic equations graphically resources all suitable for those following Edexcel, AQA or OCR exam boards:
What is solving quadratic equations graphically?
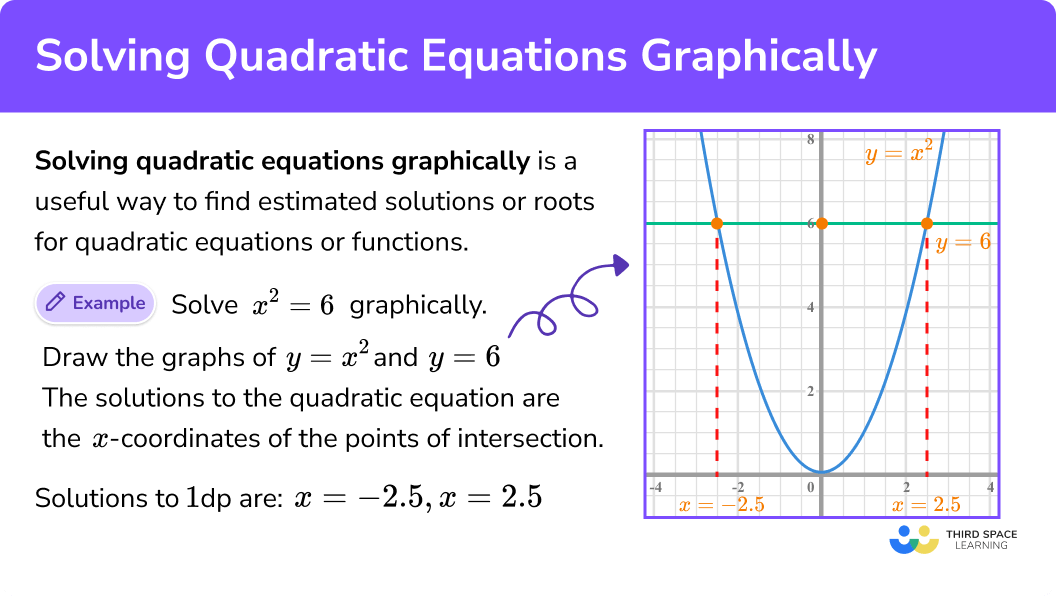
Solving quadratic equations graphically is a useful way to find estimated solutions or roots for quadratic equations or functions.
E.g.
Solve x^2=6 graphically
If we plot the quadratic function y=x^{2} and the linear function y=6 on the same graph, the intersection points of the line and the curve are the solutions to the quadratic equation x^{2}=6 .

The solutions to the quadratic equation (to 1 dp) are x=-2.5, \; x=2.5 .
You can see from the graph that these intersection points aren’t at exactly x=-2.5, \; x=2.5.
These solutions are estimates. This is the main disadvantage of the graphical method – for exact solutions, we would need to use the quadratic formula or completing the square and leave answers in surd form.
Step-by-step guide: Quadratic formula
Step-by-step guide: Completing the square
What is solving quadratic equations graphically?
What are the roots of a quadratic?
The roots of a quadratic function are the values of the x -coordinates where the function crosses the x -axis. They are sometimes called the x -intercepts.
E.g.

A quadratic function will have zero, one (repeated), or two real roots.
When you solve a quadratic equation in the form ax^2+bx+c=0 , with the right-hand side equal to zero, you are finding the roots.
On this page we will look at finding roots, and then finding other solutions, using a graph.
How to solve quadratic equations graphically
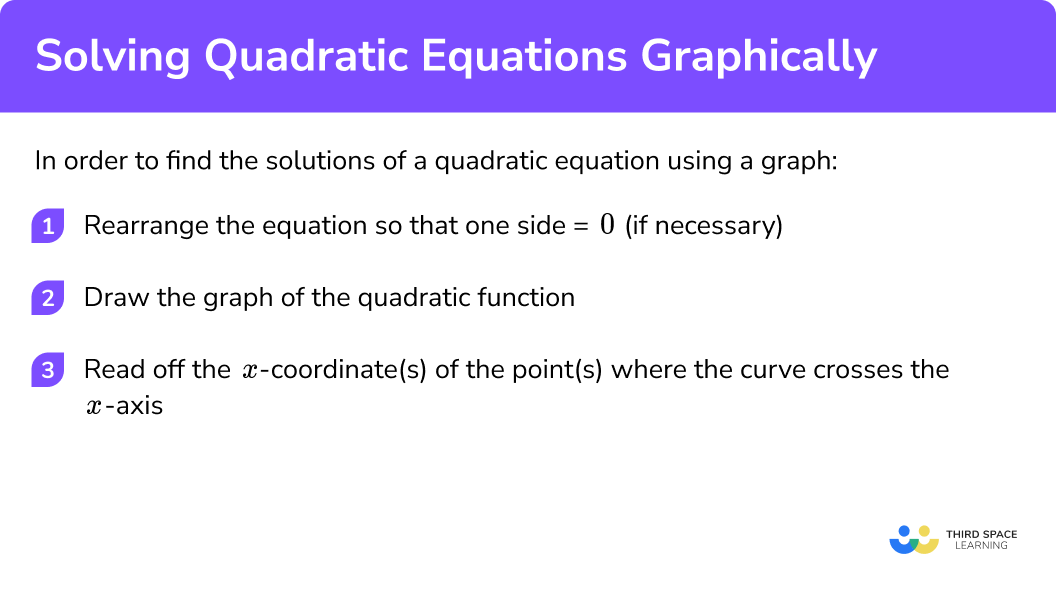
In order to find the solutions of a quadratic equation using a graph:
- Rearrange the equation so that one side = 0 (if necessary).
- Draw the graph of the quadratic function.
- Read off the x -coordinate(s) of the point(s) where the curve crosses the x -axis.
Explain how to solve quadratic equations graphically
Quadratic graphs worksheet
Get your free quadratic graphs worksheet of 20+ questions and answers. Includes reasoning and applied questions.
DOWNLOAD FREE Quadratic graphs worksheet
Get your free quadratic graphs worksheet of 20+ questions and answers. Includes reasoning and applied questions.
DOWNLOAD FREERelated lessons on quadratic graphs
Solving quadratic equations graphically is part of our series of lessons to support revision on types of graphs. You may find it helpful to start with the main quadratic graphs lesson for a summary of what to expect, or use the step by step guides below for further detail on individual topics. Other lessons in this series include:
Solve quadratic equations graphically examples
Example 1: a simple quadratic
Find the solutions of the equation x^{2}-4=0 graphically
- Rearrange the equation so that one side = 0 (if necessary).
No rearrangement needed in this case.
2Draw the graph of the quadratic function.
Write y=x^2-4 and draw the graph.

3Read off the x -coordinate(s) of the point(s) where the curve crosses the x -axis.

The roots are x=-2 and x=2 .
These are the solutions to the equation x^{2}-4=0
Example 2: a trinomial quadratic
Find the solutions of the equation x^{2}+6x+9=0 graphically.
No rearrangement needed in this case.
Write y=x^{2}+6x+9 and draw the graph.


Here we have one (repeated) root at x=-3 .
The solution to the equation x^{2}+6 x+9=0 is x=-3 .
Example 3: no real roots
Find the solutions of the equation x^{2}-2x+4=0 graphically.
No rearrangement needed in this case.
Write y=x^{2}-2x+4 and draw the graph.
Step by step guide: Plotting quadratic graphs (Example 5)

This quadratic function does not cross or touch the x -axis; there are no (real) roots and therefore the equation x^{2}-2x+4=0 has no (real) solutions.
If you tried to solve the equation x^{2}-2x+4=0 using the quadratic formula, this would result in a ‘maths error’ when entered into your calculator.
You will see “no real roots” written because these equations can be solved using techniques studied in A Level Further Mathematics, so it’s not correct just to write “there are no roots”.
Example 4: a rearrangement
Find the solutions of the equation 12+x=x^{2} graphically.
Bring the x^2 to the LHS to give 12+x-x^{2}=0
Write y=12+x-x^{2} and draw the graph.


The roots are x=-3 and x=4 . .
These are the solutions to the equation 12+x=x^{2} .
Example 5: a rearrangement
Find the solutions (to 1 decimal place) of the equation 3-2x^{2}=4x graphically.
Bring the 4x to the LHS to give 3-2x^{2}-4x=0
Write y=3-2x^{2}-4x and draw the graph.
Step by step guide: Plotting quadratic graphs (Example 7)


Here, the curve doesn’t cross at integer or easy-to-read values. Give the roots as estimates; you shouldn’t try to be any more accurate than one decimal place.
The roots are x=-2.6 and x=0.6 .
These are approximate solutions to the equation 3-2x^{2}=4x , correct to one decimal place.
Solving a quadratic equation when a graph is given
The method detailed above will always work, for any quadratic equation – you can rearrange so that one side equals 0 , plot the points and find the roots.
However, sometimes you may already have drawn a particular graph or had this given to you – this is usually the case in exam questions. In these situations, this alternative method is quicker.
In order to find solutions to a quadratic equation using a graph:
- Rearrange so that one side of the equation matches the graphed function.
- Write y = the other side of the equation and plot this function.
- At the intersection points, draw vertical lines down to the x -axis to find the solutions.
Example 6: a quadratic and a horizontal line
Here is the graph of the function y=x^{2} .

Use this graph to find the solutions of the equation x^{2}=3 .
The equation is x^{2}=3 and the graph we’re given is of the function y=x^{2} . The LHS of the original equation already matches the RHS of the function on the graph. In this case, we don’t need to rearrange.
Write y=3 and plot this.

It is a horizontal line through the y -axis at 3 :

Find the two points where the line and curve meet; we draw vertical lines down to the x -axis and read off the x -coordinate values.

These values aren’t particularly easy to read off. Give the roots as estimates; you shouldn’t try to be any more accurate than one decimal place.
We have solutions x=-1.7, \; x=1.7 , correct to 1 decimal place.
Example 7: a quadratic and line with non-zero gradient
Here is the graph of the function y=x^{2}-2x+4 .
(This is the same graph we used in Example 3).

Find the solutions of the equation x^{2}-2x+4=2x+4 graphically.
The equation is x^{2}-2x+4=2x+4 and the graph we’re given is of the function y=x^{2}-2x+4 .
The LHS of the original equation already matches the RHS of the function on the graph. In this case, we don’t need to rearrange.
Write y=2x+4 and plot this.

It is a straight line with y -intercept (0,4) and gradient 2 .
y = mx + c
Step by step guide: Plotting linear graphs (coming soon)

Find the two points where the line and curve meet; we draw vertical lines down to the x -axis and read off the x -coordinate values.

We have solutions x=0, \; x=4 .
See also: Gradient of a line
Example 8: rearrangement required
This is an example of the sort of question favoured in exams; the graph of one function is pre-drawn, and you will have to manipulate the algebra in some way in order to be able to use the graph.
Here is the graph of the function y=x^{2}+3x+2 .

Find the solutions of the equation x^{2}+3x=-1 graphically, to 1 decimal place.
The equation is x^{2}+3x=-1 and the graph we’re given is of the function y=x^{2}+3x+2 .
These look similar; there’s an x^2 and a +3x term in both, but we need to rearrange so that the constant term is also the same, and the LHS of the equation matches the RHS of the function.
We need a +2 on the LHS of the equation, so we add 2 to both sides of the equation:

Write y=1 and plot this.

It is a horizontal line through the y -axis at 1 :

Find the two points where the line and curve meet; we draw vertical lines down to the x -axis and read off the x -coordinate values.

We have (estimated) solutions x=-2.6, \; x=-0.4 .
These are the solutions to the original equation, x^{2}+3x=-1 , correct to 1 decimal place.
Common misconceptions
- Drawing a pointy vertex
Make sure that the vertex of the graph is a smooth curve, not pointed:

- Forgetting to rearrange when necessary
In order to solve when you haven’t been given a graph, rearrange so that one size equals 0 , then find the roots. In order to solve when you have been given a graph, rearrange so that one side of the equation matches the function that’s been graphed.
Practice solving quadratic equations graphically questions
1. Find the solutions of the equation x^{2}-9=0 graphically.


The RHS is already 0 , so plot the function on a graph and find the roots.
2. Find the solutions of the equation x^{2}+5x+4=0 graphically.

The RHS is already 0 , so plot the function on a graph and find the roots.
3. Find the solutions of the equation 3 x-x^{2}+2=0 graphically to 1 decimal place.

The RHS is already 0 , so plot the function on a graph and find the roots.
These solutions are estimates, so give them carefully to 1 decimal place.
4. Find the solutions of the equation x^{2}-2x=5 graphically.

Rearrange so that RHS = 0 , and plot the graph of y=x^{2}-2x-5 . Give solutions to 1 decimal place.
5. Here is the graph of y=x^{2}+4 x-3 .

Use the graph to find the solutions of the equation x^{2}+4x=4 to 1 decimal place.

Rearrange the equation to get x^{2}+4x-3=1 , then draw the line y=1 on the graph given.
Read off solutions to 1 decimal place.
6. Here is the graph of y=7x-2x^{2} .

Use the graph to find the solutions of the equation 7x=2x^{2} to 1 decimal place.

Rearrange the equation to get 7x-2x^{2}=0 .
Because RHS = 0 , you can just read off the roots on the x -axis.
7. Here is the graph of y=2x^{2}+x-3 .

Use the graph to find the solutions of the equation 2x^{2}-x=10 to 1 decimal place.

Rearrange the equation to get x^{2}+x-3=2 x+7 .
Read off the x values where the line and curve intersect.
Solving quadratic equations graphically GCSE questions
1. Here is the graph of y=6x-x^{2}

(a) Use the graph to write down the roots of the equation 6x-x^{2}=0
(b) Use the graph to find the solutions of the equation 6x-x^{2}=3 , correct to 1 decimal place.
(5 marks)
(a)
Indication of reading x -intercept values/roots
(1)
x=0, \; x=6
(1)
(b)

Line y=3 drawn on graph
(1)
Indication of reading coordinates of intersection points
(1)
x=0.6, \; x=5.5
(1)
2. Here is the graph of y=x^{2}-4x+2

Use the graph to find approximate roots of the equation x^{2}+2=4x
(2 marks)
Indication of reading x -intercept values
(1)
x=0.6,\; x=3.4
(1)
3.
(a) Complete the table of values for y=x^{2}+2x-6
\begin{aligned} &x \quad -4 \quad -3 \quad -2 \quad -1 \quad \quad 0 \quad \quad 1 \quad \quad 2 \\ &y \quad \quad \quad \quad \quad \quad -6 \quad \quad \quad \quad \quad \quad \quad \quad \quad \;\; 2 \end{aligned}
(b) On the grid draw the graph of y=x^{2}+2x-6 for values of x from -4 to 2 .

(c) Use the graph to find estimates of the solutions to the equation -2=x^{2}+2x-6 .
(d) Use the graph to find solutions to the equation
x^{2}+2x=3 .
(9 marks)
(a)
\begin{aligned} &x \quad -4 \quad -3 \quad -2 \quad -1 \quad \quad 0 \quad \quad 1 \quad \quad 2 \\ &y \quad \quad 2 \quad -3 \quad -6 \quad -7 \quad -6 \quad -3 \quad \quad 2 \end{aligned}(2)
(b)

Points plotted correctly ft. pt (a)
(1)
Points joined with a smooth curve
(1)
(c)

Line y=-2 drawn on graph
(1)
x=-3.2, \; x=1.2
(1)
(d)

Rearrange x^{2}+2 x=3 to x^{2}+2 x-6=-3
(1)
Line y=-3 drawn on graph
(1)
x=-3, \; x=1
(1)
Learning checklist
You have now learned how to:
The next lessons are:
Still stuck?
Prepare your KS4 students for maths GCSEs success with Third Space Learning. Weekly online one to one GCSE maths revision lessons delivered by expert maths tutors.

Find out more about our GCSE maths tuition programme.