GCSE Tutoring Programme
Our chosen students improved 1.19 of a grade on average - 0.45 more than those who didn't have the tutoring.
In order to access this I need to be confident with:
Completing the squareThis topic is relevant for:

Sketching Quadratic Graphs
Here we will learn about sketching quadratic graphs including how to identify key points on a graph of a quadratic function, and how to sketch quadratic graphs from these key points.
You can also download the following free sketching quadratic graphs resources all suitable for those following Edexcel, AQA or OCR exam boards:
What is sketching quadratic graphs?
Sketching quadratic graphs is slightly different to plotting quadratic graphs; a sketch of a graph shows the key points (see below) and the general shape of the graph, but is not expected to be as accurate as plotting a graph from a table of values.
A sketch of a graph wouldn’t be good enough to be able to estimate solutions to quadratic equations. However, a sketch is often useful in topics like solving quadratic inequalities, where knowing the general shape is important, but we don’t need to be really accurate.
Note that ‘sketch’ does not mean what it does in Art! A sketch of a graph should still be drawn with one smooth line or curve, and it’s good practice to use a ruler for the axes.
What is sketching quadratic graphs?
Key points on a quadratic graph
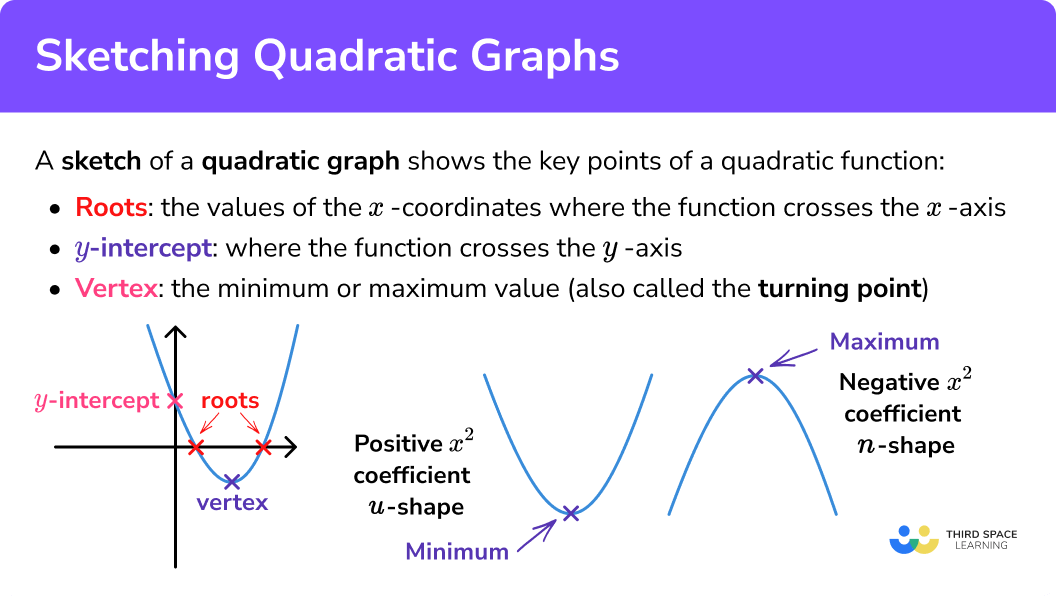
The graph of a quadratic function is always u-shaped (positive x^{2} coefficient) or n-shaped (negative x^{2} coefficient). Remember, ‘coefficient’ is just ‘the number in front of’.
The shape made by the graph of a quadratic function is called a parabola. It is symmetric, with the line or axis of symmetry running through the vertex.
The key points of a quadratic function are:
- The roots;
- The y -intercept;
- The vertex.

The roots of a quadratic function are the values of the x -coordinates where the function crosses the x -axis. They are sometimes called the x -intercepts.
A quadratic function will have zero, one (repeated), or two real roots.
When you solve a quadratic equation in the form ax^{2}+bx+c=0 , with the right-hand side equal to zero, you are finding the roots.
The y -intercept is where the function crosses the y -axis. You will have heard this phrase used before in graphs of straight lines – it is exactly the same here.
The vertex, sometimes called the turning point, of the graph, is the minimum or maximum value. A u-shaped quadratic has a minimum point, while a n-shaped quadratic has a maximum point.

How to sketch a quadratic graph
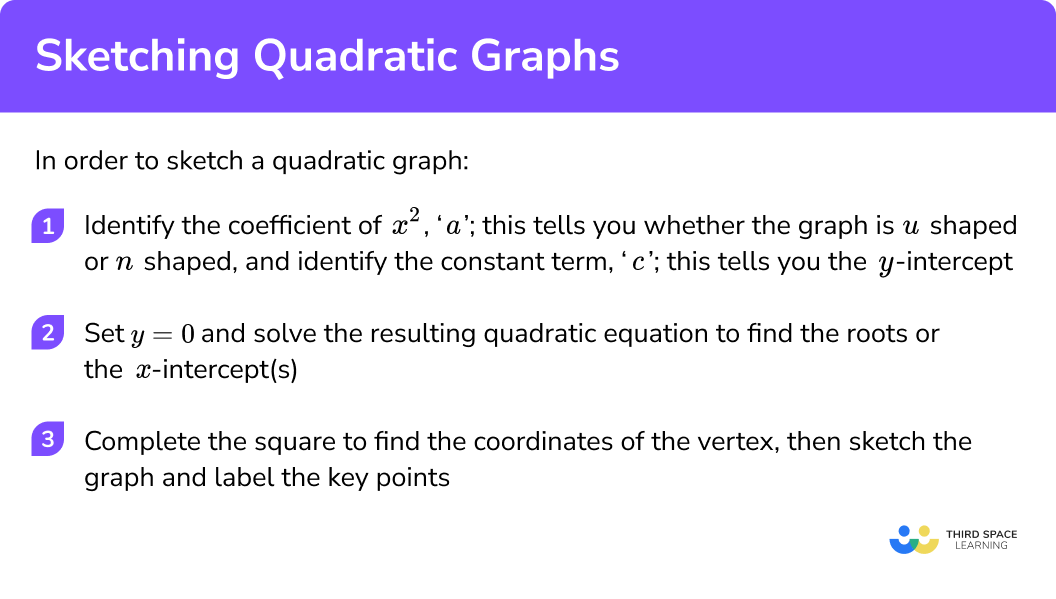
In order to sketch a quadratic graph:
- Identify the coefficient of x^{2} , or ‘a’; this tells you whether the graph is u shaped or n shaped. Also identify the constant term, ‘c’; this tells you the y -intercept.
- Set y=0 and solve the resulting quadratic equation to find the roots, or the x intercept(s).
- Complete the square to find the coordinates of the vertex, then sketch the graph and label the key points.
Explain how to sketch a quadratic graph
Plotting quadratic graphs worksheet (includes sketching)
Get your free sketching quadratic graphs worksheet of 20+ plotting quadratic graphs questions and answers. Includes reasoning and applied questions.
DOWNLOAD FREE Plotting quadratic graphs worksheet (includes sketching)
Get your free sketching quadratic graphs worksheet of 20+ plotting quadratic graphs questions and answers. Includes reasoning and applied questions.
DOWNLOAD FREERelated lessons on quadratic graphs
Sketching quadratic graphs is part of our series of lessons to support revision on types of graphs. You may find it helpful to start with the main quadratic graphs lesson for a summary of what to expect, or use the step by step guides below for further detail on individual topics. Other lessons in this series include:
Sketching quadratic graphs examples
Example 1: a simple quadratic
For the quadratic function y=x^{2}+2x , find the y -intercept, roots and vertex, and hence, sketch the graph.
- Identify the coefficient of x^{2} , or ‘a’; this tells you whether the graph is u shaped or n shaped. Also identify the constant term, ‘c’; this tells you the y -intercept.
Coefficient of x^{2} is (positive) 1 , so the graph is u shaped.
The constant term is 0 (there is no constant term), so the coordinates of the y -intercept are (0,0) .
2Set y=0 and solve the resulting quadratic equation to find the roots, or the x intercept(s).
Solutions: x=0, x=−2 .
This quadratic function has two (real) roots, and crosses the x axis at x=−2, x=0.
3Complete the square to find the coordinates of the vertex, then sketch the graph and label the key points.
x^{2}+2x=(x+1)^{2}-1
From this, the coordinates of the vertex are (−1,−1) (see Completing the Square for a step-by-step guide). This vertex is a minimum, because we’re dealing with a u shaped graph.
Sketch a set of axes, label each of the key points, then join with a smooth curve:

Example 2: a quadratic trinomial
For the quadratic function y=x^{2}+6x+5
Find the y -intercept, roots and vertex, and hence, sketch the graph.
Coefficient of x^{2} is (positive) 1 , so the graph is u shaped.
The constant term is 5 , so the coordinates of the y -intercept are ( 0,5 ).
Solutions: x=−1, x=−5 .
This quadratic function has two (real) roots, and crosses the x axis at x=−1, x=−5 .
x^{2}+6x+5=(x+3)^{2}-4
The coordinates of the vertex are (−3,4) . This vertex is a minimum, because we’re dealing with a u shaped graph.
Sketch a set of axes, label each of the key points, then join with a smooth curve:

Example 3: another quadratic trinomial, estimated roots
For the quadratic function
y=4x-x^{2}+6
Find the y -intercept, roots and vertex, and hence, sketch the graph.
Coefficient of x^{2} is −1 , so the graph is n shaped.
The constant term is 6 , so the coordinates of the y -intercept are (0,6) .
0=4x-x^{2}+6
This does not factorise, so solve by completing the square or using the quadratic formula (see these pages for a full step-by-step guide):
Solutions: x=−1.16, x=5.16 (2d.p.)
This quadratic function has two (real) roots, and crosses the x axis at x=−1.16, x=5.16 (2d.p.) .
4x-x^{2}+6=-(x-2)^{2}+10
The coordinates of the vertex are (2,10) . This vertex is a maximum, because we’re dealing with a n shaped graph.
Sketch a set of axes, label each of the key points, then join with a smooth curve. When marking the roots on the x -axis, we can’t really be more accurate than 1 decimal place.

Example 4: a very challenging example
For the quadratic function y=5x-2x^{2}+7
Find the y -intercept, roots and vertex, and hence, sketch the graph.
Note: This is a challenging example, requiring many skills at a high level. Although it is unlikely (but not impossible!) that you would be asked a question this tricky at GCSE, if you are aiming for a Grade 8 or 9, you should be able to follow the steps in this example.
Coefficient of x^{2} is −2 , so the graph is n shaped.
The constant term is 7 , so the coordinates of the y -intercept are (0,7) .
Solutions:
This quadratic function has two (real) roots, and crosses the x axis at
5x-2x^{2}+7=-2\left(x-\frac{5}{4}\right)^{2}+\frac{81}{8}
The coordinates of the vertex are \left(\frac{5}{4}, \frac{81}{8}\right)
This vertex is a maximum because we’re dealing with a n shaped graph.
Sketch a set of axes, label each of the key points, then join with a smooth curve:

Common misconceptions
- Drawing a pointy vertex
Make sure that the vertex of the graph is a smooth curve, not pointed:

- Not using the coefficient of x^{2} to find the shape of the graph
Positive coefficient = u shaped
Negative coefficient = n shaped
Practice sketching quadratic graphs questions
1. Sketch the graph of y=x^{2}+4x


y intercept ( 0,0 ).
Factorise to x(x+4) to get roots x=0 and x=-4 .
CTS (x+2)^{2}-4 gives vertex ( -2,-4 ).
Graph is a u shape because x^2 coefficient is positive.
2. Sketch the graph of y=x^{2}+2x-8


y intercept ( 0,-8 ).
Factorise to (x+4)(x-2) to get roots x=-4 and x=2 .
CTS (x+1)^{2}-9 gives vertex (-1,-9) .
Graph is a u shape because x^2 coefficient is positive.
3. Sketch the graph of y=-x^{2}+2x+3


y intercept (0,2) .
Factorise to (x+1)(3-x) to get roots x=-1 and x=3 .
CTS -(x-1)^{2}+4 gives vertex (1,4) .
Graph is a n shape because x^2 coefficient is negative.
4. Sketch the graph of y=4x^{2}-9


y intercept (0,-9) .
Factorise to (2x+3)(2x-3) (difference of two squares) to get roots x=-1.5 and x=1.5 .
In this case, because this is DOTS, we can’t complete the square, but we know the graph must be symmetrical about the y axis, so the vertex must be (0, -9) .
Graph is a u shape because x^2 coefficient is positive.
Sketching quadratic graphs GCSE questions
1. Here is the graph of y=x^{2}+4x-5:

(a) Write down the coordinates of the vertex.
(b) Is the turning point a maximum or a minimum?
(c) Use the graph to find the roots of the equation
x^{2}+4 x-5=0
(4 marks)
(-2,-9)
(1)
Minimum
(1)
x=1
(1)
x=-5
(1)
2.
(a) Show that x^{2}-4 x-12 can be written in the form (x-a)^{2}-b , where a and b are integers to be found.
(b) Factorise x^{2}-4x-12 .
(c) Hence, or otherwise, sketch the graph of the function y=x^{2}-4x-12 .
(6 marks)
(a)
a=2
(1)
b=16
(1)
(b)
(x+ )(x- ) with two numbers that have a product of 12
(1)
(x+2)(x-6)
(1)

(c)
Graph with vertex at (2,-16) and roots at x=-2,x=6
(1)
Fully correct U shaped graph
(1)
Learning checklist
You have now learned how to:
The next lessons are
Still stuck?
Prepare your KS4 students for maths GCSEs success with Third Space Learning. Weekly online one to one GCSE maths revision lessons delivered by expert maths tutors.

Find out more about our GCSE maths tuition programme.