GCSE Tutoring Programme
Our chosen students improved 1.19 of a grade on average - 0.45 more than those who didn't have the tutoring.
This topic is relevant for:

Plotting Quadratic Graphs
Here we will learn about plotting quadratic graphs including how to substitute values to create a table and then draw the graph of a quadratic function from this table.
You can also download the following free plotting quadratic graphs resources suitable for those following Edexcel, AQA or OCR exam boards:
What is plotting quadratic graphs?
Plotting quadratic graphs is drawing up a table of values for the x and y coordinates, and then plotting these on a set of axes.
Quadratic graphs are graphs of quadratic functions – that is, any function which has x^2 as its highest power.
E.g.
y=x^{2}+2 x+5 is a quadratic function.
In order to complete a table of values, we substitute each x value into the quadratic function to obtain the matching y value. Each one of these is a coordinate pair. For the function y=x^{2}+2 x+5 , the table of values from x=-3 to x=2 would look like this:
\begin{aligned} &x \quad \quad -3 \quad \quad -2 \quad \quad -1 \quad \quad \quad 0 \quad \quad \quad 1 \quad \quad \quad 2 \\ &y \quad \quad \quad 8 \quad \quad\quad 5 \quad \quad \quad 4 \quad \quad \quad 5 \quad \quad \quad 8 \quad \quad \quad 13 \end{aligned}
and the graph would look like this:

The shape made by the graph of a quadratic function is called a parabola, and is symmetric.
What is plotting quadratic graphs?

How to plot a quadratic graph
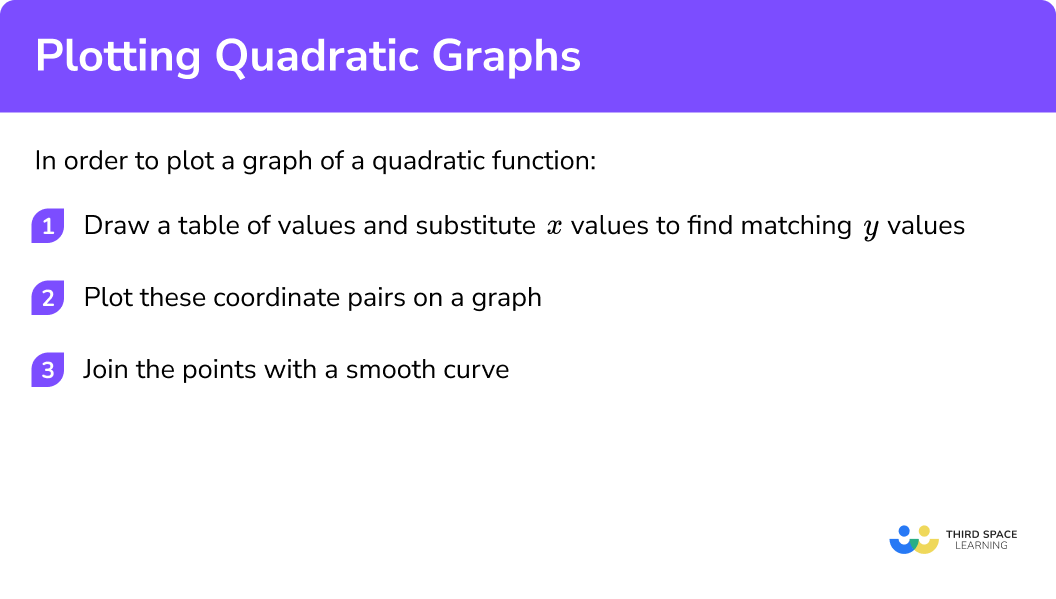
In order to plot a graph of a quadratic function:
- Draw a table of values, and substitute x values to find matching y values.
- Plot these coordinate pairs on a graph.
- Join the points with a smooth curve.
Explain how to plot a quadratic graph
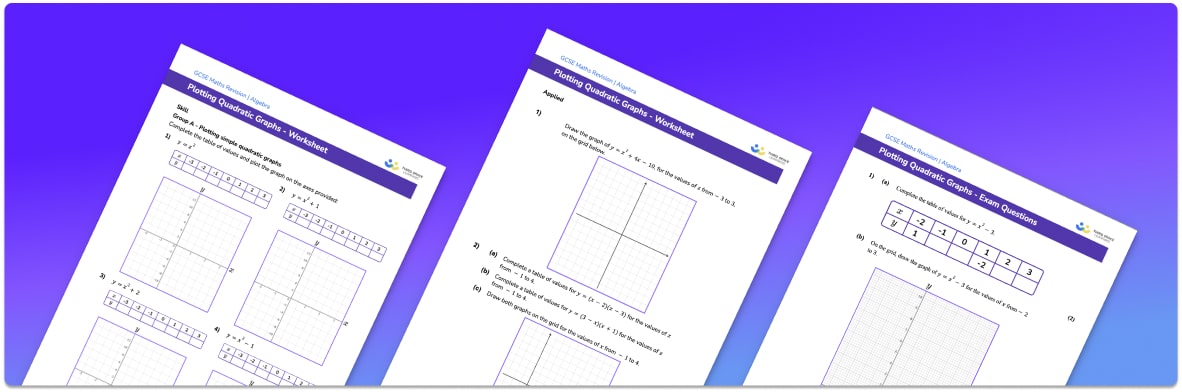
Plotting quadratic graphs worksheet
Get your free plotting quadratic graphs worksheet of 20+ questions and answers. Includes reasoning and applied questions.
DOWNLOAD FREE Plotting quadratic graphs worksheet
Get your free plotting quadratic graphs worksheet of 20+ questions and answers. Includes reasoning and applied questions.
DOWNLOAD FREERelated lessons on quadratic graphs
Plotting quadratic graphs is part of our series of lessons to support revision on types of graphs. You may find it helpful to start with the main quadratic graphs lesson for a summary of what to expect, or use the step by step guides below for further detail on individual topics. Other lessons in this series include:
Plotting quadratic graphs examples
Example 1: the standard quadratic graph
Draw the graph of
y=x^{2}
- Draw a table of values, and substitute x values to find matching y values.
You will usually be given the range of values to use for x . Sometimes this might be written as ‘from -3 to 3 ’, or you may see it written symbolically as -3 ≤ x ≤ 3 .
\begin{aligned} &x \quad \quad -3 \quad \quad -2 \quad \quad -1 \quad \quad \quad 0 \quad \quad \quad 1 \quad \quad \quad 2 \quad \quad \quad 3 \\ &y \quad \quad \quad 9 \quad \quad\quad 4 \quad \quad \quad 1 \quad \quad \quad 0 \quad \quad \quad 1 \quad \quad \quad 4 \quad \quad \quad 9 \end{aligned}
When:
\begin{aligned} &x=-3, \;y=(-3)^{2}=9 \\\\ &x=-2,\; y=(-2)^{2}=4 \\\\ &x=-1, \;y=(-1)^{2}=1 \end{aligned}
And so on…
2Plot these coordinate pairs on a graph.

3Join the points with a smooth curve.

Example 2: a simple quadratic
Draw the graph of
y=x^{2}-4
\begin{aligned} &x \quad \quad -3 \quad \quad -2 \quad \quad -1 \quad \quad \quad \; 0 \quad \quad \quad 1 \quad \quad \quad 2 \quad \quad \quad 3 \\ &y \quad \quad \quad 5 \quad \quad\quad 0 \quad \quad -3 \quad \quad \; -4 \quad \quad -3 \quad \quad \quad 0 \quad \quad \quad 5 \end{aligned}
When:
\begin{aligned}
&x=-3, \;y=(-3)^{2}-4=9-4=5 \\\\
&x=-2, \;y=(-2)^{2}-4=4-4=0\\\\
&x=-1, \;y=(-1)^{2}-4=1-4=-3
\end{aligned}
And so on…


Example 3: another simple quadratic
Draw the graph of
y=x^{2}+3x
\begin{aligned} &x \quad \quad -5 \quad \quad -4 \quad \quad -3 \quad \quad -2 \quad \quad -1 \quad \quad \quad 0 \quad \quad \quad 1 \\ &y \quad \quad \;\; 10 \quad \quad\quad 4 \quad \quad \quad 0 \quad \quad -2 \quad \quad -2 \quad \quad \quad 0 \quad \quad \quad 4 \end{aligned}
When:
\begin{aligned}
&x=-5, \; y=(-5)^{2}+3(-5)=25-15=10 \\\\
&x=-4, \; y=(-4)^{2}+3(-4)=16-12=4\\\\
&x=-3, \; y=(-3)^{2}+3(-3)=9-9=0
\end{aligned}
And so on…
You might find it helpful to add extra rows into your table to work out these substitutions. Break the function down into its component terms, as in the shaded rows in the table. To get the y value, just sum the shaded portions.
\begin{aligned} &x \quad \quad -5 \quad \quad -4 \quad \quad -3 \quad \quad -2 \quad \quad -1 \quad \quad \quad 0 \quad \quad \quad 1 \\ &x^2 \quad \quad 25 \quad \quad \;\;\;16 \quad \quad \;\;\; 9 \quad \quad \quad 4 \quad \quad \quad1 \quad \quad \quad 0 \quad \quad \quad 1 \\ + 3&x \quad \;\; -15 \quad \;\; -12 \quad \;\;\; -9 \quad \quad -6 \quad \quad -3 \quad \quad +0 \quad \quad+3 \\ &y \quad \quad \;\; 10 \quad \quad\quad 4 \quad \quad \quad 0 \quad \quad -2 \quad \quad -2 \quad \quad \quad 0 \quad \quad \quad 4 \end{aligned}


Note that you need to round out the bottom of the curve – don’t just join across the bottom with a straight line!
Example 4: a quadratic trinomial (three parts)
Draw the graph of
y=x^{2}+3x+2
\begin{aligned} &x \quad \quad -5 \quad \quad -4 \quad \quad -3 \quad \quad -2 \quad \quad -1 \quad \quad \quad 0 \quad \quad \quad 1 \quad \quad \quad 2\\ &y \quad \quad \;\;12 \quad \quad\quad 6 \quad \quad \quad 2 \quad \quad \quad 0 \quad \quad \quad 0 \quad \quad \quad 2 \quad \quad \quad 6 \quad \quad \;\; 12 \end{aligned}
When:
\begin{aligned}
&x=-5,\; y=(-5)^{2}+3(-5)+2=25-15+2=12 \\\\
&x=-4, \;y=(-4)^{2}+3(-4)+2=16-12+2=6\\\\
&x=-3, \;y=(-3)^{2}+3(-3)+2=9-9+2=2
\end{aligned}
And so on…
You might find it helpful to add extra rows into your table to work out these substitutions. Break the function down into its component terms, as in the shaded rows in the table. To get the y value, just sum the shaded portions.
\begin{aligned} &x \quad \quad -5 \quad \quad -4 \quad \quad -3 \quad \quad -2 \quad \quad -1 \quad \quad \quad 0 \quad \quad \quad 1 \quad \quad \quad 2 \\ &x^2 \quad \quad 25 \quad \quad \;\;16 \quad \quad \quad 9 \quad \quad \quad 4 \quad \quad \quad1 \quad \quad \quad 0 \quad \quad \quad 1 \quad \quad \quad 4\\ + 3&x \quad \;\; -15 \quad \;\; -12 \quad \;\;\; -9 \quad \quad -6 \quad \quad -3 \quad \quad +0 \quad \quad+3 \quad \quad+6 \\ + &2 \quad \quad +2 \quad \quad +2 \quad \quad +2\quad \quad +2\quad \quad +2\quad \quad +2\quad \quad +2\quad \quad +2 \\ &y \quad \quad \;\;12 \quad \quad \quad 6 \quad \quad \quad 2 \quad \quad \quad 0 \quad \quad \quad 0 \quad \quad \quad 2 \quad \quad \quad 6 \quad \quad \;\;12 \end{aligned}


Note that you need to round out the bottom of the curve – don’t just join across the bottom with a straight line!
Example 5: dealing with negative terms
Draw the graph of
y=x^{2}-2x+4
\begin{aligned} &x \quad \quad -2 \quad \quad -1 \quad \quad \quad0 \quad \quad \quad 1 \quad \quad \quad 2 \quad \quad \quad 3 \quad \quad \quad 4 \\ &y \quad \quad \;\; 12 \quad \quad \quad 7 \quad \quad \quad 4 \quad \quad \quad 3 \quad \quad \quad 4 \quad \quad \quad 7 \quad \quad \quad 12 \end{aligned}
When:
\begin{aligned}
&x=-2, \;y=(-2)^{2}-2(-2)+4=4+4+4=12 \\\\
&x=-1, \;y=(-1)^{2}-2(-1)+4=1+2+4=7\\\\
&x=0, \;y=(0)^{2}-2(0)+4=0+0+4=4
\end{aligned}
And so on…
Alternatively, using a table with the function broken down into rows:
\begin{aligned} &x \quad \quad -2 \quad \quad -1 \quad \quad \quad0 \quad \quad \quad 1 \quad \quad \quad 2 \quad \quad \quad 3 \quad \quad \quad 4 \\ &x^2 \quad \quad \;\; 4 \quad \quad \quad 1 \quad \quad \quad 0 \quad \quad \quad 1 \quad \quad \quad4 \quad \quad \quad 9 \quad \quad \;\; 16 \\ -2&x \quad \;\; +14 \quad \;\;\; +2 \quad \quad\: -0 \quad \quad -2 \quad \quad -4 \quad \quad -6 \quad \quad -8 \\ + &4 \quad \quad +4 \quad \quad +4 \quad \quad +4\quad \quad +4\quad \quad +4\quad \quad+4\quad \quad +4 \\ &y \;\; \quad \quad 12 \quad \quad \quad 7 \quad \quad \quad 4 \quad \quad \quad 3 \quad \quad \quad 4 \quad \quad \quad 7 \quad \quad \quad 12 \end{aligned}


Example 6: coefficient of x2 ≠ 1
Draw the graph of
y=2x^{2}+3x-5
\begin{aligned} &x \quad \quad -3 \quad \quad -2 \quad \quad -1 \quad \quad \quad \; 0 \quad \quad \quad 1 \quad \quad \quad 2 \quad \quad \quad 3 \\ &y \quad \quad \quad 4 \quad \quad -3 \quad \quad -6 \quad \quad \; -5 \quad \quad \quad0 \quad \quad \quad 9 \quad \quad \;\; 22 \end{aligned}
When:
\begin{aligned}
&x=-3, \;y=2(-3)^{2}+3(-3)-5=18-9-5=4 \\\\
&x=-2, \;y=2(-2)^{2}+3(-2)-5=8-6-5=-3\\\\
&x=-1, \;y=2(-1)^{2}+3(-1)-5=2-3-5=-6
\end{aligned}
And so on…
Alternatively, using a table with the function broken down into rows:
\begin{aligned} &x \quad \quad -3 \quad \quad -2 \quad \quad -1 \quad \quad \quad 0 \quad \quad \quad 1 \quad \quad \quad 2 \quad \quad \quad 3 \\ 2&x^2 \quad \quad 18 \quad \quad \quad 8 \quad \quad \quad 2 \quad \quad \, \quad 0 \quad \quad \quad 2 \quad \quad \quad 8 \quad \quad \;\; 18 \\ +3&x \quad \quad-9 \quad \quad -6 \quad \quad -3 \quad \quad +0 \quad \quad +3 \quad \quad +6 \quad \quad+9 \\ - &5 \quad \quad -5 \quad \quad -5 \quad \quad-5\quad \quad -5\quad \quad -5\quad \quad-5 \quad \quad -5 \\ &y \quad \quad \quad 4 \quad \quad -3 \quad \quad -6 \quad \quad -5 \quad \quad \quad0 \quad \quad \quad 9 \quad \quad \;\; 22 \end{aligned}


Example 7: coefficient of x2 ≠ 1 , negative x2 term
Draw the graph of
y=-2x^{2}-4x+3
\begin{aligned} &x \quad \quad -4 \quad \quad -3 \quad \quad -2 \quad \quad -1 \quad \quad \quad 0 \quad \quad \quad 1 \quad \quad \quad 2\\ &y \quad \;\; -13 \quad \quad -3 \quad \quad \quad 3 \quad \quad \quad 5 \quad \quad \quad3 \quad \;\;\, -3 \quad \;\; -13 \end{aligned}
When:
\begin{aligned} &x=-4,\; y=-2(-4)^{2}-4(-4)+3=-32+16+3=-13 \\\\ &x=-3,\; y=-2(-3)^{2}-4(-3)+3=-18+12+3=-3\\\\ &x=-2, \;y=-2(-2)^{2}-4(-2)+3=-8+8+3=3 \end{aligned}
And so on…
Alternatively, using a table with the function broken down into rows:
\begin{aligned} &x \quad \quad -4 \quad \quad -3 \quad \quad -2 \quad \quad -1 \quad \quad \quad 0 \quad \quad \quad 1 \quad \quad \quad 2\\ -2&x^2 \quad \;\; -32 \quad \;\; -18 \quad \;\; -8 \quad \;\;\;-2 \quad \quad \quad \,0 \quad \quad -2 \quad \;\;\;-8 \\ -4&x \quad \quad +16 \quad \;\; +12 \quad \;\; +8 \quad \;\;\, +4 \quad \quad \; -0 \quad \quad -4 \quad \quad -8 \\ + &3 \quad \quad \, +3 \quad \quad +3 \quad \quad +3\quad \;\;\; +3 \quad \quad \; +3 \quad \quad+3 \quad \quad +3 \\ &y \quad \quad-13 \quad \;\; -3 \quad \quad \quad \, 3 \quad \quad \;\;\; 5 \quad \quad \quad\: 3 \quad \quad -3 \quad \quad -13 \end{aligned}


Common misconceptions
- Drawing a pointy vertex
Make sure that the vertex of the graph is a smooth curve, not pointed:

- Making errors when dealing with negative x values, particularly when squaring
E.g.
(-3)^{2}=9 , not -9 .
If you’re using your calculator, make sure you include brackets around the x value that you are squaring.
Practice plotting quadratic graphs questions
1. Draw the graph of:
y=x^{2}+4


The y -intercept is (0,4) and the graph is a u shape because the x^2 coefficient is positive.
2. Draw the graph of:
y=x^{2}+4x


The quadratic factorises to give x(x+4) so the roots are x=0 and x=-4.
3. Draw the graph of:
y=x^{2}-6x


The quadratic factorises to give x(x-6) so the roots are x=0 and x=6 .
The graph is a u shape because the x^2 coefficient is positive.
4. Draw the graph of:
y=x^{2}+2x+3


The quadratic has no real roots so it doesn’t intersect the x axis.
The constant term is 3 so the y intercept is (0,3) . The graph is a u shape because the x^2 coefficient is positive.
5. Draw the graph of:
y=x^{2}-5x-3


The quadratic has two roots, which could be found by completing the square or using the quadratic formula.
The constant term is -3 so the y intercept is (0,-3) .
The graph is a u shape because the x^2 coefficient is positive.
6. Draw the graph of:
y=2x^{2}+4x-7


The quadratic has two roots, which could be found by completing the square or using the quadratic formula.
The constant term is -7 so the y intercept is (0,-7) .
The graph is a u shape because the x^2 coefficient is positive.
7. Draw the graph of:
y=4x-3x^{2}


The quadratic factorises to give x(4-3x) so the roots are x=0 and x=\frac{4}{3} .
The graph is a n shape because the x^2 coefficient is negative.
Plotting quadratic graphs GCSE questions
1. (a) Complete the table of values for y=x^{2}+4x-2
\begin{aligned} &x \quad \quad -6 \quad \quad -5 \quad \quad -4 \quad \quad -3 \quad \quad -2 \quad \quad -1 \quad \quad \quad 0 \quad \quad \quad 1\\\\ &y \quad \quad\;\; 10 \quad \quad \quad \quad \quad\quad\quad\quad\quad-5 \end{aligned}
(b) On the grid draw the graph of y=x^{2}+4x-2 for values of x from -6 to 1 .

(4 marks)
(a)
\begin{aligned} &x \quad \quad -6 \quad \quad -5 \quad \quad -4 \quad \quad -3 \quad \quad -2 \quad \quad -1 \quad \quad \quad 0 \quad \quad \quad 1\\\\ &y \quad \quad\;\; 10 \quad \quad \quad 3 \quad \quad -2 \quad \quad -5 \quad \quad -6 \quad \quad -5 \quad \quad -2 \quad \quad 3 \end{aligned}
(2)
(b)

(2)
2. (a) Complete the table of values for y=2+3x-x^{2}
\begin{aligned} &x \quad \quad -2 \quad \quad -1 \quad \quad \quad 0 \quad \quad \quad 1 \quad \quad \quad 2 \quad \quad \quad 3 \quad \quad \quad 4 \quad \quad \quad 5\\\\ &y \quad \quad \quad \quad \quad\;\;-2 \quad \quad \quad \quad \quad \quad \quad \quad \quad \quad 2 \end{aligned}
(b) Draw the graph of y=2+3x-x^{2} for values of x from -2 to 5 .

(4 marks)
(a)
\begin{aligned} &x \quad \quad -2 \quad \quad -1 \quad \quad \quad 0 \quad \quad \quad 1 \quad \quad \quad 2 \quad \quad \quad 3 \quad \quad \quad 4 \quad \quad \quad 5\\\\ &y \quad \quad -8 \quad \quad -2 \quad \quad \quad 2 \quad \quad \quad 4 \quad \quad \quad 4 \quad \quad \quad 2 \quad \quad -2 \quad \quad -8 \end{aligned}
(2)
(b)

(2)
3. (a) Complete the table of values for y=2x^{2}+x-5
\begin{aligned} &x \quad \quad -3 \quad \quad -2 \quad \quad -1 \quad \quad \quad 0 \quad \quad \quad 1 \quad \quad \quad 2 \\\\ &y \quad \quad \quad \quad \quad\;\;-1 \quad \quad \quad \quad \quad \quad \quad \quad \quad -2 \end{aligned}
(b) On the grid draw the graph of y=2x^{2}+x-5 for values of x from -3 to 2 .

(4 marks)
(a)
\begin{aligned} &x \quad \quad -3 \quad \quad -2 \quad \quad -1 \quad \quad \quad 0 \quad \quad \quad 1 \quad \quad \quad 2 \\\\ &y \quad \quad \;\; 10 \quad \quad \quad 1 \quad \quad -4 \quad \quad -5 \quad \quad -2 \quad \quad \quad 5 \end{aligned}
(2)
(b)

(2)
The next lessons are
Still stuck?
Prepare your KS4 students for maths GCSEs success with Third Space Learning. Weekly online one to one GCSE maths revision lessons delivered by expert maths tutors.

Find out more about our GCSE maths tuition programme.