GCSE Tutoring Programme
Our chosen students improved 1.19 of a grade on average - 0.45 more than those who didn't have the tutoring.
In order to access this I need to be confident with:
Negative numbers Decimals Fractions Arithmetic Mean, median and mode RoundingThis topic is relevant for:

Mean From A Frequency Table
Here we will learn about the mean from a frequency table, including what it is and how to calculate it. We will also learn how to find an estimate for the mean from a grouped frequency table.
There are also averages from frequency tables worksheets based on Edexcel, AQA and OCR exam questions, along with further guidance on where to go next if you’re still stuck.
What is mean from a frequency table?
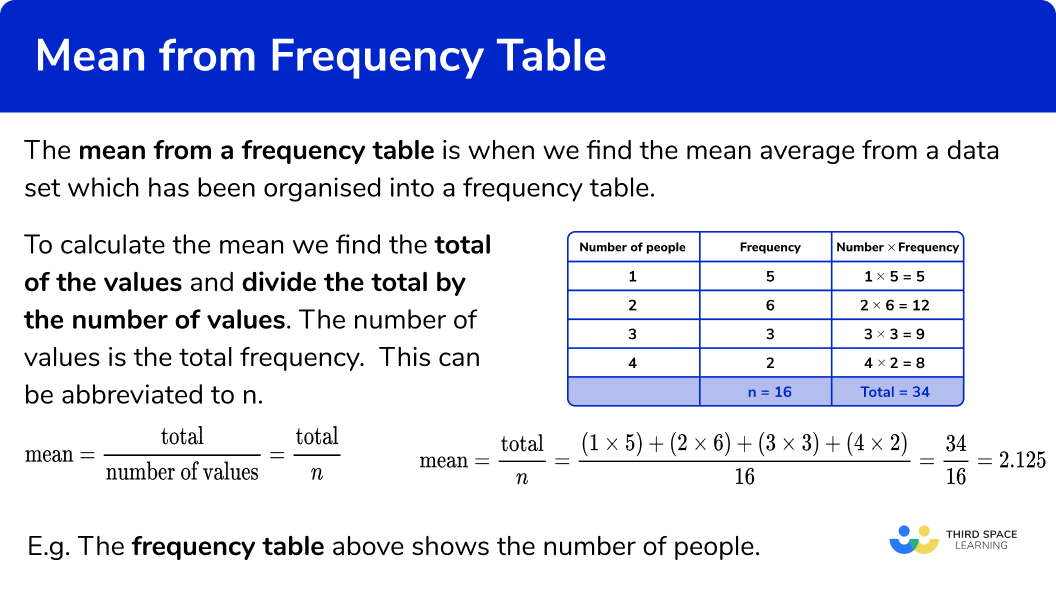
Mean from a frequency table is when we find the mean average from a data set which has been organised into a frequency table.
To calculate the mean from a frequency table, we find the total of the values and divide the total by the number of values. The number of values is the total frequency. This can be abbreviated to n .
\text{Mean}=\frac{\text{total}}{\text{number of values}}=\frac{\text{total}}{n}We can use an extra column to help.
Mean is a measure of central tendency, it is a value that can be used to represent a set of data.
E.g. The frequency table shows the number of people living in 16 flats.
There are 5 flats with 1 person living there, so we work out 1\times5=5
There are 6 flats with 2 people living there, so we work out 2\times6=12
There are 3 flats with 3 people living there, so we work out 3\times3=9
There are 2 flats with 4 people living there, so we work out 2\times4=8
The number of values (n) is the total frequency, here n=16
The mean is 2.125 people
What is mean from a frequency table?

Estimated mean from a grouped frequency table
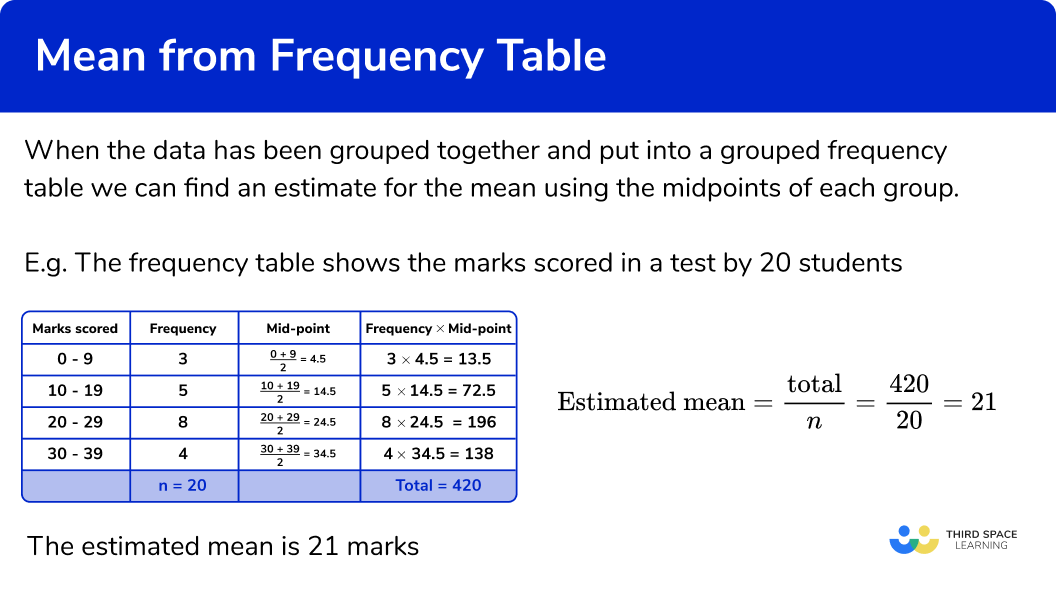
When the data has been grouped together and put into a grouped frequency table we cannot find the actual mean because we only have a range of possible values.
Instead we can find an estimate for the mean using the midpoints of each group. We can add more columns to the grouped frequency table to help.
E.g.
The frequency table shows the marks scored in a test by 20 students.
There are 3 people who scored between 0-9 marks. As we don’t know the exact number of marks that each of these people scored we will use the midpoint of 4.5 marks.
We can find the midpoint by adding the smallest value and the largest value together and dividing by 2
The estimated mean is 21 marks
What is mean from a grouped frequency table?

How to find the mean from a frequency table
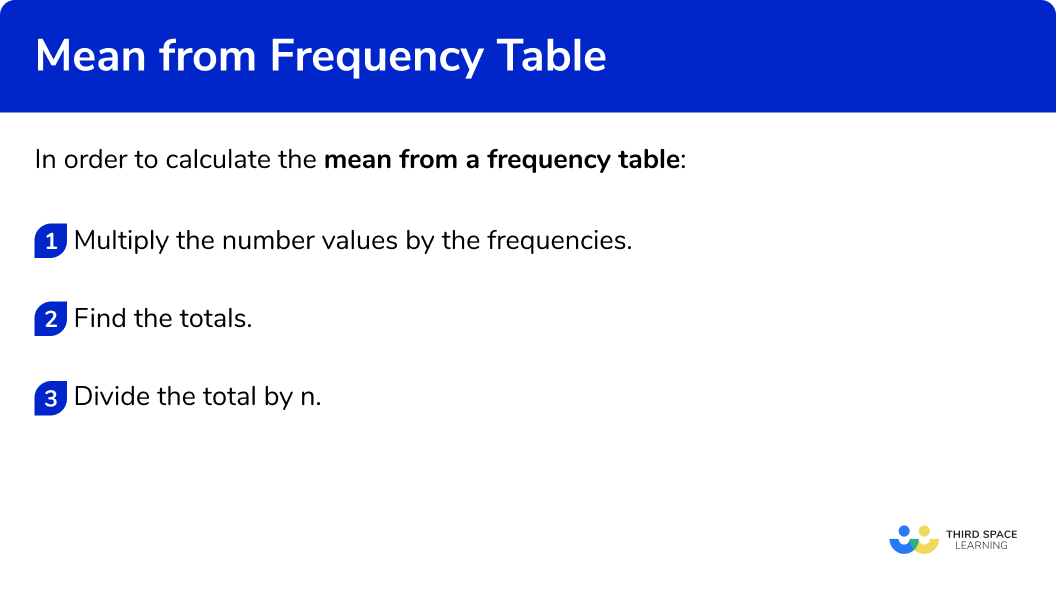
In order to find the mean from a frequency table:
- Multiply the number values by the frequencies.
- Find the totals.
- Divide the total by n.
How to find the mean from a frequency table


Mean from a frequency table worksheet

Get your free mean from a frequency table worksheet of 20+ questions and answers. Includes reasoning and applied questions.
DOWNLOAD FREE
Mean from a frequency table worksheet

Get your free mean from a frequency table worksheet of 20+ questions and answers. Includes reasoning and applied questions.
DOWNLOAD FREERelated lessons on frequency tables
Mean from a frequency table is part of our series of lessons to support revision on frequency tables. You may find it helpful to start with the main frequency table lesson for a summary of what to expect, or use the step by step guides below for further detail on individual topics. Other lessons in this series include:
Mean from a frequency table examples
Example 1: frequency table
The frequency table shows the number of goals scored in 10 football matches. Find the mean number of goals.
- Multiply the number values by the frequencies.
We can add an extra column next to the frequency column to help us find the subtotals.
2Find the totals.
Find the total of the frequency column, n . Add up the subtotals to find the total.
3Divide the total by n.
The last step is to divide the total by n .
\text{Mean}=\frac{\text{total}}{n}=\frac{11}{10}=1.1The mean is 1.1 goals
Example 2: frequency table
The frequency table shows the number of people on 20 buses. Find the mean number of people.
Multiply the number values by the frequencies.
We can add an extra column next to the frequency column to help us find the subtotals. to help us find the subtotals.
Find the totals.
Find the total of the frequency column, n . Add up the subtotals to find the total.
Divide the total by n.
The last step is to divide the total by n .
\text{mean}=\frac{\text{total}}{n}=\frac{191}{20}=9.55The mean is 9.55 people
Example 3: frequency table
The frequency table shows the ages, in years of 25 children in a club. Find the mean age.
Multiply the number values by the frequencies.
We can add an extra column next to the frequency column to help us find the subtotals.
Find the totals.
Find the total of the frequency column, n . Add up the subtotals to find the total.
Divide the total by n.
The last step is to divide the total by n .
\text{Mean}=\frac{\text{total}}{n}=\frac{123}{25}=4.92The mean is 4.92 years
How to estimate the mean from a grouped frequency table
In order to estimate the mean from a grouped frequency table:
- Find the midpoints of the groups.
- Multiply midpoints by the frequencies.
- Find the totals.
- Divide the total by n.
Mean from a grouped frequency table examples
Example 4: grouped frequency tables
The grouped frequency table shows the number of people in 10 train carriages. Estimate the mean number of people.
Find the midpoints of the groups.
We do not know the actual values of each item in the group, so we use the midpoint. We can find the midpoint by adding the smallest value and the largest value together and dividing by 2 . We can add a column for the midpoints.
Multiply midpoints by the frequencies.
We can add an extra column next to the frequency column to help us find the subtotals.
Find the totals.
Find the total of the frequency column, n . Add up the subtotals to find the total.
Divide the total by n.
The last step is to divide the total by n .
\text{mean}=\frac{\text{total}}{n}=\frac{110}{10}=11But remember that this is an estimate for the mean.
The estimated mean is 11 people
Example 5: grouped frequency tables
The grouped frequency table shows the number of marks in a test taken by 25 students. Estimate the mean number of marks.
Find the midpoints of the groups.
We do not know the actual values of each item in the group, so we use the midpoint. We can find the midpoint by adding the smallest value and the largest value together and dividing by 2 . We can add a column for the midpoints.
Multiply midpoints by the frequencies.
We can add an extra column next to the frequency column to help us find the subtotals.
Find the totals.
Find the total of the frequency column, n . Add up the subtotals to find the total.
Divide the total by n.
The last step is to divide the total by n .
\text{Mean}=\frac{\text{total}}{n}=\frac{542.5}{25}=21.7But remember that this is an estimate for the mean.
The estimated mean is 21.7 marks
Example 6: grouped frequency tables
The grouped frequency table shows the weight in grams of 30 potatoes.
Estimate the mean weight.
Give your answer to 1 decimal place.
Find the midpoints of the groups.
We do not know the actual values of each item in the group, so we use the midpoint. We can find the midpoint by adding the smallest value and the largest value together and dividing by 2 . We can add a column for the midpoints.
Multiply midpoints by the frequencies.
We can add an extra column next to the frequency column to help us find the subtotals.
Find the totals.
Find the total of the frequency column, n . Add up the subtotals to find the total.
Divide the total by n.
The last step is to divide the total by n .
\text{Mean}=\frac{\text{total}}{n}=\frac{1300}{30}=43.333… = 43.3 \ \text{(to 1 dp)}But remember that this is an estimate for the mean.
The estimated mean is 43.3 g (1 d.p.)
Common misconceptions
- Check which average you are being asked for
Check if you have been asked for the median, mode or mean average.
- Divide by the total frequency
Remember to divide by the total frequency, not by the number of rows in the table. Always check to see if your final answer is sensible.
- Decimals and fractions
The mean does not have to be a whole number, it can be a decimal or a fraction.
- Classes for grouped frequency tables can be written in different ways
The class intervals used in grouped frequency tables can be written in different ways. Be careful when finding the midpoint.
E.g.
0 to 5
0-5 0\le x <5- Estimated mean from grouped frequency tables
We only use the estimated mean when we have a grouped frequency table because we do not have the actual values for the data.
- Frequency distribution table
A frequency distribution table is the same as a frequency table.
Practice mean from a frequency table questions
1. The frequency table shows the number of pets of 15 students.
Find the mean number of pets.
Give your answer to 3 significant figures.


We need to multiply the numbers by the frequencies and find the total. The we divide the total by n , the frequency total
\text{Mean}=\frac{\text{total}}{n}=\frac{19}{15}=1.2666… = 1.27 \ \text{(3 s.f.)}
2. The frequency table shows the number of puppies in 21 litters.
Find the mean number of puppies.
Give your answer to 3 significant figures.


We need to multiply the numbers by the frequencies and find the total. The we divide the total by n , the frequency total
\text{Mean}=\frac{\text{total}}{n}=\frac{141}{21}=6.714… = 6.71 \ \text{(3 s.f.)}
3. The frequency table shows the price of a packet of biscuits in 16 different shops.
Find the mean price.
Give your answer to 3 significant figures.


We need to multiply the numbers by the frequencies and find the total. The we divide the total by n , the frequency total
\text{Mean}=\frac{\text{total}}{n}=\frac{957}{16}=59.81… = 59.8 \ \text{(3 s.f.)}
4. The grouped frequency table shows the number of children in 17 families.
Estimate the mean number of children.
Give your answer to 3 significant figures.


We need to use midpoints. Then we multiply the midpoints by the frequencies and find the total. The we divide the total by n , the frequency total
\text{mean}=\frac{\text{total}}{n}=\frac{53}{17}=3.117… = 3.12 \ \text{(3 s.f.)}
5. The grouped frequency table shows numbers of cars at midday in a car park over 14 days.
Estimate the mean number of cars.
Give your answer to 3 significant figures.


We need to use midpoints. Then we multiply the midpoints by the frequencies and find the total. The we divide the total by n , the frequency total
\text{Mean}=\frac{\text{total}}{n}=\frac{717}{14}=51.214… = 51.2 \ \text{(3 s.f.)}
6. The grouped frequency table shows weights of 21 newborn babies.
Estimate the mean weight of new born babies.
Give your answer to 3 significant figures.


3.5 to 4

We need to use midpoints. Then we multiply the midpoints by the frequencies and find the total. The we divide the total by n , the frequency total
\text{Mean}=\frac{\text{total}}{n}=\frac{71.75}{21}=3.4166… = 3.42 \ \text{(3 s.f.)}
Mean from a frequency table GCSE questions
1. Alex works in a restaurant.
At 1 pm one day she records the number of customers sitting at the tables in the restaurant. Here are the results.
(a) Work out the total number of tables in the restaurant.
(b) Work out the total number of customers sitting at the tables in the restaurant.
(c) Work out the mean number of customers per table in the restaurant.
(5 marks)
(a)
25
For the correct answer
(1)
(b)
(0\times 3)+(1\times 4)+(2\times 10)+(3\times 3)+(4\times 5)
For the sum of the products
(1)
=53
For the correct answer
(1)
(c)
=53\div 25
For the division
(1)
=2.12
For the correct answer
(1)
2. Here is some information about 10 buses leaving a station.
Work out an estimate for the mean number of minutes late.
(3 marks)
5, 15 and 25
For the midpoints
(1)
\frac{(5\times 5)+(3\times 15)+(2\times 25)}{10}
For the sum of the products divided by 10
(1)
=\frac{120}{10}=12
For the correct answer
(1)
3. The table shows the weight, w kg of 90 bags that people took on a coach trip.
Calculate an estimate for the mean weight of the 90 bags.
Give your answer to 3 significant figures.
(4 marks)
2.5, 7.5, 12.5, 17.5 and 22.5
For the midpoints
(1)
(12\times 2.5)+(19\times 7.5)+(23\times 12.5)+(31\times 17.5)+(5\times 22.5)
For the sum of the products
(1)
=\frac{1115}{90}=12.388…
For the dividing the sum of the products by 90
(1)
=12.388…=12.4 \ \text{(3 s.f.)}
For the correct answer
(1)
Learning checklist
You have now learned how to:
-
Find the mean from a frequency table
-
Find an estimate for the mean from a grouped frequency table
The next lessons are
Still stuck?
Prepare your KS4 students for maths GCSEs success with Third Space Learning. Weekly online one to one GCSE maths revision lessons delivered by expert maths tutors.

Find out more about our GCSE maths tuition programme.