GCSE Tutoring Programme
Our chosen students improved 1.19 of a grade on average - 0.45 more than those who didn't have the tutoring.
In order to access this I need to be confident with:
Negative numbers Decimals Fractions Arithmetic Mean, median and mode RoundingThis topic is relevant for:

Averages From Frequency Tables
Here we will learn about averages from frequency tables, including how to find the different averages from frequency tables and grouped frequency tables.
You can also download a free Averages from Frequency Tables Worksheet, suitable for those following Edexcel, AQA or OCR exam boards.
What are averages from frequency tables?
Averages from frequency tables allows us to find an average for a data set using frequency tables.
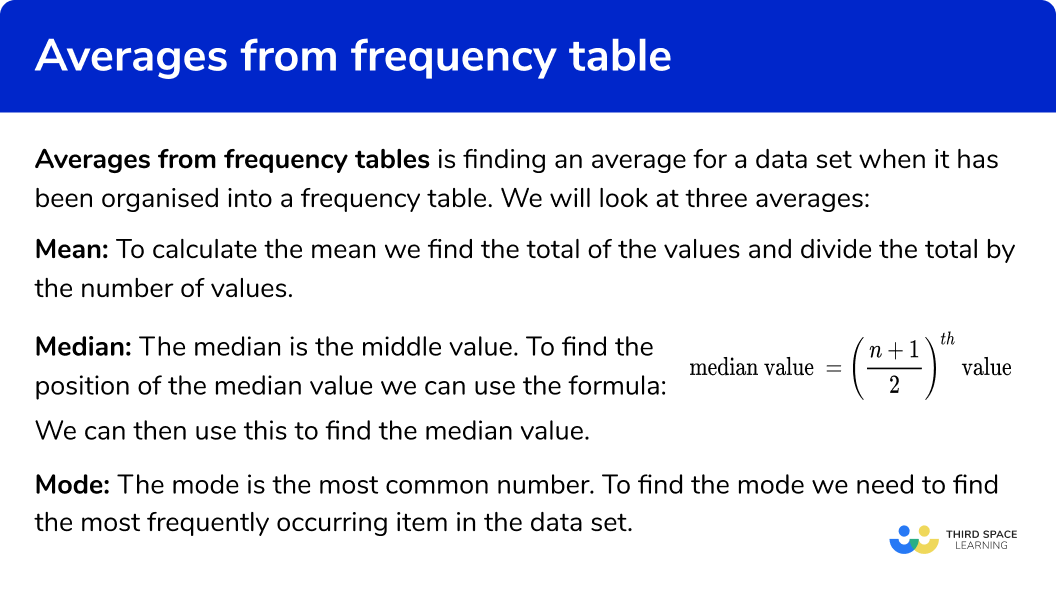
We will look at three averages:
- Mean:
To calculate the mean we find the total of the values and divide the total by the number of values.
- Median:
The median is the middle value.
To find the position of the median value we can use the formula:
\text {Median value }=\left(\frac{n+1}{2}\right)^{t h} \text { value }
We can then use this to find the median value.
- Mode:
The mode is the most common value.
To find the mode we need to find the most frequently occurring item in the data set.
E.g.
Here is a frequency table about the number of goals scored by a football team in 15 matches.

Mode:
We look at the frequency column for the highest frequency. The highest frequency is 7 which means that 7 teams scored no goals.
So 0 goals is the mode.
Median:
We look for the middle value.
\text {Median value }=\left(\frac{n+1}{2}\right)^{t h} \text { value }
There were 15 matches, so the middle value is the 8^\text{th} value.
The median number of goals scored is 1 goal.
Mean:
We need to find the total number of goals scored and then divide by the number of matches, n .
\text{Mean}=\frac{\text{total}}{n}=\frac{(0\times 7)+(1\times 3)+(2\times 3)+(3\times 1)+(4\times 1)}{15}=\frac{16}{15}=1.0666…
The mean number of goals scored is 1.07 goals (to 2 dp )
Step-by-step guide: Mean from frequency table
The number of goals scored is an example of discrete data, as it can only take specific values.
We can also find averages when the data are grouped.
E.g.
Here is a grouped frequency table of times taken by 25 people to complete a crossword problem.

Modal class:
We look down the frequency column for the highest frequency. The highest frequency is 11 . The time 40<t \le60 is the time interval taken by most people.
So 40<t \le60 is the modal class interval
Median:
We can find the class interval containing the median by using the formula:
\text {Median value }=\left(\frac{n+1}{2}\right)^{t h} \text { value }
There were 25 times recorded, so the middle value is the 13^\text{th} value.
The median time taken is in the class interval 20<t \le40 .
Estimated mean:
As we do not have the actual times taken we can only estimate the mean by using the midpoints of the class intervals.
We can then find the total and divide this by the number of values, n .
\text{Mean}=\frac{\text{total}}{n}=\frac{(10\times 5)+(30\times 9)+(50\times 11)}{25}=\frac{870}{25}=34.8 \ \text{minutes}
The estimated mean time taken is 34.8 minutes
What are averages from frequency tables?
How to find averages from frequency tables
In order to find averages from frequency tables, here are some tips to consider:
- Mode: find the highest frequency.
- Median: find the middle value.
- Mean: find the total and divide by the number of values.
How to find averages from frequency tables
Averages from frequency tables worksheet
Get your free averages from frequency tables worksheet of 20+ questions and answers. Includes reasoning and applied questions.
DOWNLOAD FREE Averages from frequency tables worksheet
Get your free averages from frequency tables worksheet of 20+ questions and answers. Includes reasoning and applied questions.
DOWNLOAD FREERelated lessons on frequency tables
Averages from frequency tables is part of our series of lessons to support revision on frequency tables. You may find it helpful to start with the main frequency table lesson for a summary of what to expect, or use the step by step guides below for further detail on individual topics. Other lessons in this series include:
Averages from frequency tables examples
Example 1: mode
The frequency table shows the ages of 44 students in the art club.
Find the modal age:

The highest frequency is 13 . The associated age is 14 .
The mode is 14
Example 2: modal class
The grouped frequency table shows the weight of 30 dogs
Find the modal class.

The highest frequency is 9 . The associated class interval is 20<w\le 30
The modal class is 20<w\le 30
Example 3: median
The frequency table shows the number of bedrooms in 49 houses.
Find the median number of bedrooms.

Since there are 49 values we can use a formula to help locate the middle value.
\text{Median}=(\frac{n+1}{2})^\text{th}=(\frac{49+1}{2})^\text{th}=25^\text{th}
We then need to add up the frequencies to find where the 25^\text{th} value is. This is called Cumulative Frequency.
We use the cumulative frequencies to find where the 25^\text{th} value is.

The row representing 3 bedrooms contains the 25^\text{th} value as it contains the 17^\text{th} to 32^\text{nd} values.
The median is 3
Example 4: median
The frequency table shows the scores in 15 rugby matches
Find the median number of bedrooms.

Since there are 15 values we can use a formula to help locate the middle value.
\text{Median}=(\frac{n+1}{2})^\text{th}=(\frac{15+1}{2})^\text{th}=8^\text{th}
We use the cumulative frequencies to find where the 8^\text{th} value is.

The class interval 10 to 19 contains the 8^\text{th} value as it contains the 5^\text{th} to 10^\text{th} values.
The class interval containing the median is 10 to 19
Example 5: mean
The frequency table shows the number of subjects taken by 30 students.
Find the mean number of classes taken.
Give your answer to 2 decimal places.

\text{Mean}=\frac{\text{total}}{n}=\frac{(7\times 3)+(8\times 8)+(9\times 11)+(10\times 5)+(11\times 2)+(12\times 1)}{30}=\frac{268}{30}=8.9333…
The mean number of subjects taken is 8.93 (to 2 dp)
The mean is 8.93 subjects (to 2 dp )
Example 6: mean
The frequency table shows the height of 20 plants.
Find the estimated mean number of classes taken.
Give your answer to 3 significant figures.

We can only find an estimate for the mean as we need to use the midpoints of the class intervals. Two extra columns can help set out the workings.

\text{Mean}=\frac{\text{total}}{n}=\frac{280}{15}=18.666…=18.7 \ \text{cm (to 3 sf)}
The estimated mean is 18.7 cm (to 3 sf )
Common misconceptions
- Check which average you are being asked for
Check if you have been asked for the median, mode or mean average.
- Class intervals notation
The class intervals used in grouped frequency tables can be written in different ways. Take care when writing them, or finding the midpoints.
E.g.
0 to 5
0-5
0\le x <5
- Position of the median
The value given by the median formula is not for the median, but for the position of the median. The formula gives us where the middle value is.
- Frequency distribution table
A frequency distribution table is the same as a frequency table
Practice averages from frequency tables questions
1. The frequency table shows the number of siblings for 15 children. Find the modal number of siblings:


1 is the mode as it has the highest frequency.
2. The frequency table shows the number of passengers for 35 trains. Find the modal class interval of passengers:

150 to 149
100 to 149
‘100 to 149’ is the modal class interval as it has the highest frequency.
3. The frequency table shows the number of pets for 15 children. Find the median number of pets:

There are 15 items of data. The middle value will be the 8thvalue. This will be ‘1’ . So 1 is the median
4. The frequency table shows the number of books read in a year for 35 members of a book club. Find the class interval which contains the median:

20 to 39
0 to 19
40 to 59
60 to 79
There are 35 items of data. The middle value will be the 18^\text{th} value. This will be in the class interval ‘20 to 39’ .
5. The frequency table shows the ages of 20 children in a computer science club. Find the mean age:

We need to multiply the ages by their frequencies to get the total.
\text{Mean}=\frac{\text{total}}{n}=\frac{(12\times 3)+(13\times 8)+(14\times 7)+(15\times 2)}{20}=\frac{268}{20}=13.4
The mean is 13.4 years
6. The frequency table shows the heights of 10 plants. Find the estimate for mean height:

We need to multiply the heights by their frequencies to get the total.
\text{Mean}=\frac{\text{total}}{n}=\frac{(5\times 5)+(15\times 2)+(25\times 2)+(35\times 1)}{10}=\frac{140}{10}=14
The estimate of the mean is 14 cm
Averages from frequency tables GCSE questions
1. The table shows the number of people living in 50 houses.

(a) Write down the modal number of people
(b) Find the median number of people
(2 marks)
(1)
3
(1)
2. The table shows the heights of 35 children

(a) State the modal class interval.
(b) Find the class interval which contains the median.
(2 marks)
(1)
160\le h<170
(1)
3. The frequency table shows the heights of 20 plants.

Calculate an estimate for the mean height.
Give your answer correct to 1 decimal place.
(4 marks)
12.5, 37.5, 62.5 and 87.5
For the midpoints
(1)
(3\times 12.5)+(11\times 37.5)+(5\times 62.5)+(1\times 87.5)
For the sum of the products
(1)
=\frac{850}{20}=42.5
For the dividing the sum of the products by 20
(1)
=42.5
For the correct answer
(1)
Learning checklist
You have now learned how to:
The next lessons are
Still stuck?
Prepare your KS4 students for maths GCSEs success with Third Space Learning. Weekly online one to one GCSE maths revision lessons delivered by expert maths tutors.

Find out more about our GCSE maths tuition programme.