GCSE Tutoring Programme
Our chosen students improved 1.19 of a grade on average - 0.45 more than those who didn't have the tutoring.
In order to access this I need to be confident with:
Tally chart Decimals Collecting data Inequalities Mean, median and mode RangeThis topic is relevant for:

Frequency Table
Here we will learn about frequency tables, including what a frequency table is and how to make a frequency table. We will also look at how they can be used to help analyse a set of data.
You can also download the following free frequency table resources all suitable for those following Edexcel, AQA or OCR exam boards:
What is a frequency table?
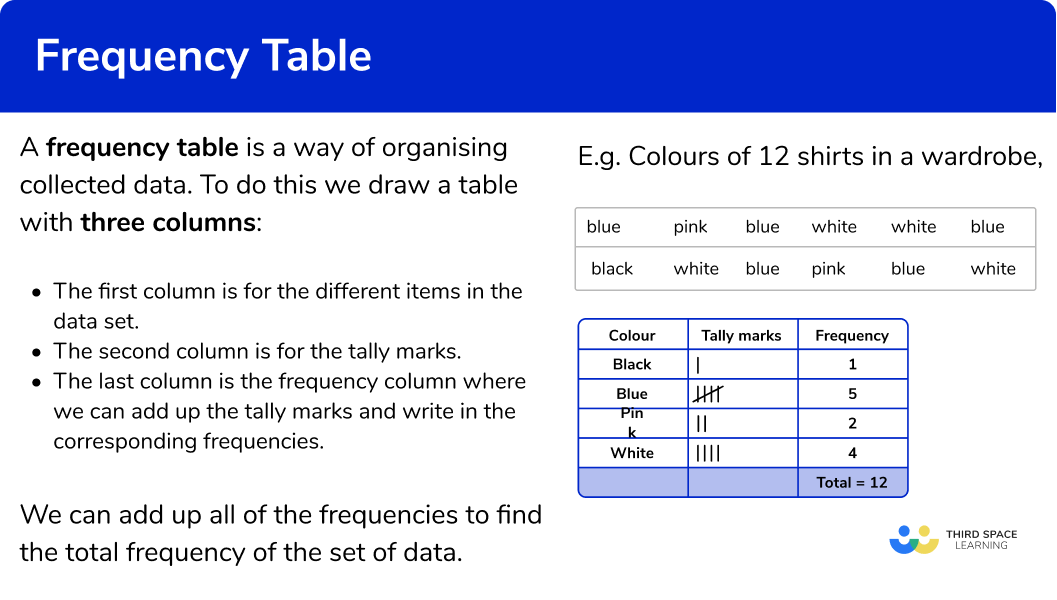
A frequency table is a way of organising collected data.
To do this we draw a table with three columns:
- The first column is for the different items in the data set.
- The second column is for the tally marks.
- The last column is the frequency column where we can add up the tally marks and write in the corresponding frequencies.
We can add up all of the frequencies to find the total frequency of the set of data.
For example,
Organise the colours of the 12 shirts in a wardrobe into a frequency table.
blue pink blue white white blue
black white blue pink blue white

The total number of shirts is 12.
What is a frequency table?
Averages from frequency tables
We use frequency tables to find descriptive statistics. These are values which help describe the set of data such as the mean, median and mode of a set of data.
For example,
A frequency table showing the ages of 25 students on a college course.

The mode is 18
The median is the 13^{th} value which is 18
The mean can be calculated using the total of all the values, divided by the total of the frequencies, n.
\text{mean}=\frac{\text{total}}{n}=\frac{(18\times 15)+(19\times 6)+(20\times 4)}{25}=\frac{464}{25}=18.56
Step-by-step guide: Averages from a frequency table
See also: Mean from a frequency table and Mode from a frequency table
Grouped frequency table
Numerical data can also be organised into grouped data. Here the data is put into different classes with class intervals.
For example,
A grouped frequency table showing the heights of 15 students.

The mode class is 140<h\leq150
The median is the 8^{th} value which is in the 140<h\leq150 class interval
We can only calculate an estimate for the mean using the midpoints of the class intervals. The total of the frequencies is n.
\text{mean}=\frac{\text{total}}{n}=\frac{(135\times 3)+(145\times 7)+(155\times 5)}{15}=\frac{2195}{15}=146.3 (1 d.p.)
Step-by-step guide: Grouped frequency table
See also: Median from a frequency table and Modal class
Frequency tables can be used to draw bar charts, pie charts or histograms. They can also be used to find cumulative frequency which in turn can be used to estimate median values and upper and lower quartiles for grouped data.
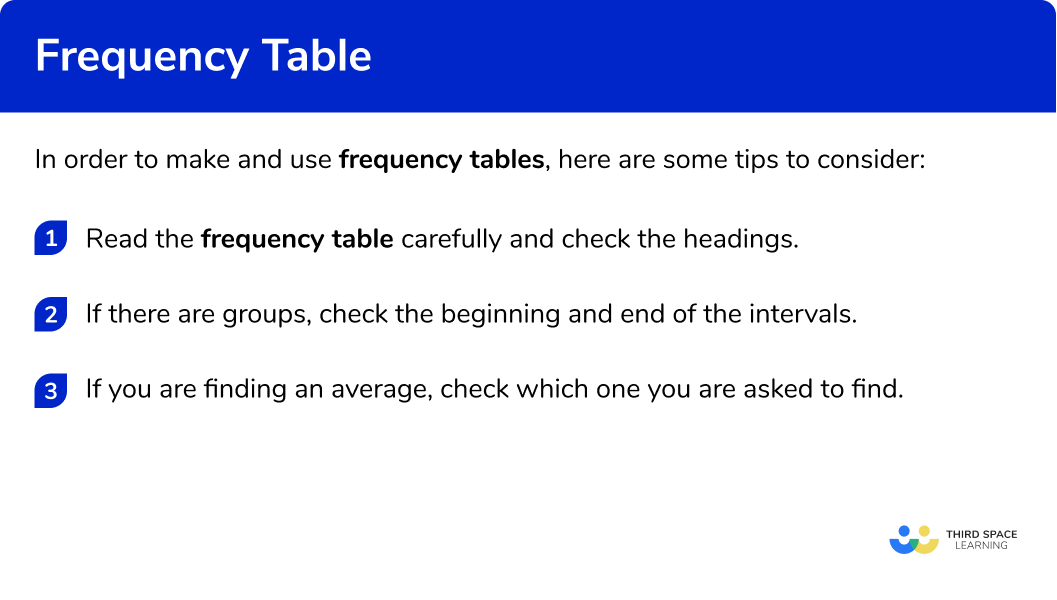
How to make and use frequency tables
In order to make and use frequency tables, here are some tips to consider:
- Read the frequency table carefully and check the headings.
- If there are groups, check the beginning and end of the intervals.
- If you are finding an average, check which one you are asked to find.
Explain how to make and use frequency tables
Frequency table worksheet
Get your free frequency table worksheet of 20+ questions and answers. Includes reasoning and applied questions.
DOWNLOAD FREE Frequency table worksheet
Get your free frequency table worksheet of 20+ questions and answers. Includes reasoning and applied questions.
DOWNLOAD FREEFrequency table examples
Example 1: categorical data
Here are the makes of 20 cars.
Ford BMW Honda Honda VW Toyota
Ford Toyota Honda Toyota Ford Honda
Honda VW Toyota Honda Ford Ford
- Complete the frequency table.

- Go along the data set and for each item put a tally mark in the table. When you have finished, add up the tally marks to find the frequencies.

- Add up the frequencies in the final column to get the total number of items in the data set.
Example 2: numerical data
Here are the temperatures at midday for 7 days (in ०C)
23 \quad \quad \quad 24 \quad \quad \quad 24 \quad \quad \quad 23 \quad \quad \quad 24 \quad \quad \quad 25 \quad \quad \quad 21
- Complete the frequency table.

- Go along the data set and for each item put a tally mark in the table. When you have finished, add up the tally marks to find the frequencies.

- Add up the frequencies in the final column to get the total number of items in the data set.
Example 3: grouped data
Here are the speeds of 20 vehicles, to the nearest mph.
\begin{aligned} &45 \quad \quad 65 \quad \quad 72 \quad \quad 48 \quad \quad 74 \quad \quad 67 \quad \quad 68 \quad \quad 46 \quad \quad 56 \quad \quad 53 \\\\ &58 \quad \quad 68 \quad \quad 72 \quad \quad 64 \quad \quad 62 \quad \quad 49 \quad \quad 72 \quad \quad 55 \quad \quad 67 \quad \quad 51 \end{aligned}
- Complete the grouped frequency table:

- Go along the data set and for each item put a tally mark in the table. When you have finished, add up the tally marks to find the frequencies. Take care with the inequalities and the minimum value and the maximum value in each class interval.

- Add up the frequencies in the final column to get the total number of items in the data set.
Example 4: average from a frequency table
Write down the mode.

- The mode is ‘Car’ as it has the highest frequency. The modal vehicle is ‘Car’.
Example 5: averages from a frequency table
Find the mode, median and mean from this frequency table

- The mode is 20^{\circ}
- The median is the 11^{th} value which is 19^{\circ}
- The mean is
\frac{(17\times 1)+(18\times 4)+(19\times 6)+ (20\times 8)+(21\times 2)}{21}=\frac{405}{21}=19.3^{\circ} (1 d.p.)
Example 6: averages from a grouped frequency table
Find the modal class, the class interval in which the median lies and the estimated mean from this grouped frequency table

- The modal class is the one with the highest frequency which is 60 \leq x <70 degrees
- The median will be the 13^{th} value which is in the interval 60 \leq x <70
- An estimate for the mean can be found from using the midpoints. Where n is the total frequency.
\text{Mean}=\frac{\text{total}}{n}=\frac{(45times 4)+(55\times 8)+(65\times 10)+ (75\times 3)}{25}=\frac{1495}{25}=59.8 \ \text{mph}
Common misconceptions
- Counting the items
When attempting to count the items in each group and fill in the frequencies it is easy to make a mistake. Using tally marks can help with accuracy.
- Check which average you are being asked for
Check if you have been asked for the median, mode or mean average.
- Classes for grouped frequency tables can be written in different ways
The class intervals used in grouped frequency tables can be written in different ways. Take care with inequalities that the item goes in the correct group, especially the minimum value and the maximum value.
E.g.
0 to 5
0-5
0\le x<5
0<x \le5
Practice frequency table questions
1. Which is the correct frequency table for the following set of data?
golf football hockey athletics football
athletics rugby hockey football rugby
hockey football golf hockey rugby
football hockey rugby football athletics


Athletics occurs 3 times in the data set, football 6 times, golf 2 times, hockey 5 times and rugby 4 times.
2. Which is the correct frequency table for the following set of data?
\begin{aligned} &11 \quad \quad 12 \quad \quad 14 \quad \quad 13 \quad \quad 12 \\\\ &14 \quad \quad 15 \quad \quad 12 \quad \quad 11 \quad \quad 11 \\\\ &12 \quad \quad 11 \quad \quad 15 \quad \quad 14 \quad \quad 15 \\\\ &12 \quad \quad 11 \quad \quad 13 \quad \quad 14 \quad \quad 11 \end{aligned}


The number 11 occurs six times in the data set, the number 12 five times, the number 13 two times, the number 14 five times and the number 15 three times.
3. Which is the correct grouped frequency table for the following set of data?
\begin{aligned} &11 \quad \quad 23 \quad \quad 30 \quad \quad 17 \quad \quad 24 \\\\ &38 \quad \quad 37 \quad \quad 7 \quad \quad \;\; 12 \quad \quad 5 \\\\ &8 \quad \quad \;\; 15 \quad \quad 33 \quad \quad 19 \quad \quad 27 \end{aligned}


Checking the first group, there are 3 numbers in the 0 to 9 class. Checking the second group, there are 5 numbers in the 10 to 19 class. There are 3 numbers in the 20 to 29 class and 4 numbers in the 30 to 39 class.
4. The frequency table shows the number of passengers for 20 buses. Find the modal class interval of passengers:

15 to 19
30 to 44
‘30 to 44’ is the modal class interval as it has the highest frequency.
5. The frequency table shows the number of siblings for 45 children. Find the median number of siblings:

There are 45 items of data. The middle value will be the 23^{rd} value. This will be ‘1’. So 1 is the median
6. The frequency table shows the heights of 20 shrubs. Find the estimate for mean height:

We need to multiply the heights by their frequencies to get the total.
\text{Mean}=\frac{\text{total}}{n}=\frac{(10\times 2)+(30\times 6)+(50\times 7)+(70\times 4)+(90\times 1)}{20}=\frac{920}{20}=46
The estimate of the mean is 46
Frequency table GCSE questions
1. Mrs Smith asked 20 children how they got to school.
Here are the results:

(a) Complete the frequency table.

(b) Write the mode.
(3 marks)
(a)

For at least one correct tally or frequency
(1)
For all frequencies correct
(1)
(b) Mode is ‘walk’
(1)
2. The price of 1 pint of milk is recorded from 40 different shops.
Here are the results, in a grouped frequency table.

(a) State the mode.
(b) Find the median.
(c) Calculate the mean price.
(4 marks)
(a) 50
(1)
(b) 49
(1)
(c)
\frac{(48\times 8)+(49\times 13)+(50\times 14)+(51\times 2)+(52\times 2)+(53\times 1)}{40}=\frac{1908}{40}
(1)
=49.5
(1)
3. Jai times 23 people on how long it takes for them to complete a wordsearch.
Here are the results, in a grouped frequency table.

(a) State the modal class interval.
(b) Find the class interval which contains the median.
(c) Calculate an estimate for the mean time.
Give your answer correct to 1 decimal place.
(5 marks)
(a) 20<t\leq 30
(2)
(b) 10<t\leq 20
(1)
(c)
5, 15, 25 and 35
For the midpoints
(1)
\frac{(5\times 5)+(15\times 8)+(25\times 9)+(35\times 1)}{23}=\frac{405}{23}=17.6087…
For the dividing the sum of the products by 23
(1)
=17.6087…=17.6 \ \text{(3 s.f.)}
For the correct answer
(1)
Learning checklist
You have now learned how to:
The next lessons are
Still stuck?
Prepare your KS4 students for maths GCSEs success with Third Space Learning. Weekly online one to one GCSE maths revision lessons delivered by expert maths tutors.

Find out more about our GCSE maths tuition programme.