FREE DOWNLOAD
Frequency Table Worksheet
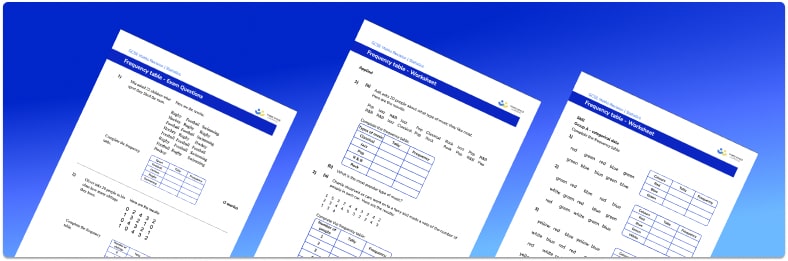
Help your students prepare for their Maths GCSE with this free frequency table worksheet of 20 questions and answers
- Section 1 of the frequency table worksheet contains 12 skills-based frequency table questions, in 3 groups to support differentiation
- Section 2 contains 4 applied frequency table questions with a mix of worded problems and deeper problem solving questions
- Section 3 contains 4 foundation and higher level GCSE exam style questions on frequency tables
- Answers and a mark scheme for all frequency table questions are provided
- Questions follow variation theory with plenty of opportunities for students to work independently at their own level
- All questions created by fully qualified expert secondary maths teachers
Suitable for GCSE maths revision for AQA, OCR and Edexcel exam boards
Raise maths attainment across your school with hundreds of flexible and easy to use GCSE maths worksheets and lessons designed by teachers for teachers.
Frequency table at a glance
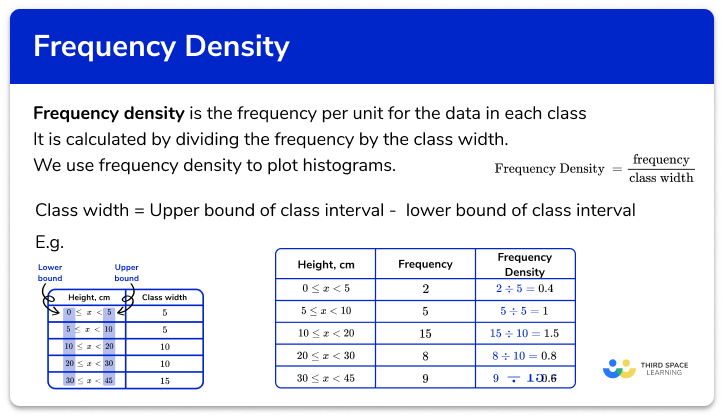
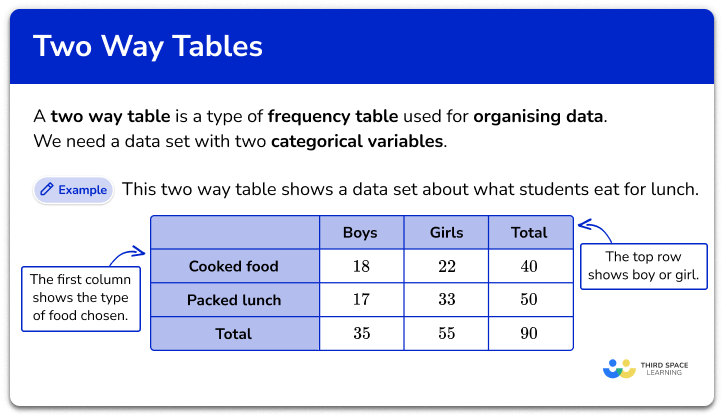
A frequency table is used to display a data set; it is often the starting point for graphing frequency diagrams such as bar charts, pictograms and histograms. The first column in a frequency table shows the data values – categorical or quantitative. The second column is the frequency of each data value. For example, a frequency table might display the number of goals scored by a football team over a given number of matches – in this case, the first column would have the number of goals (0, 1, 2, 3,…).
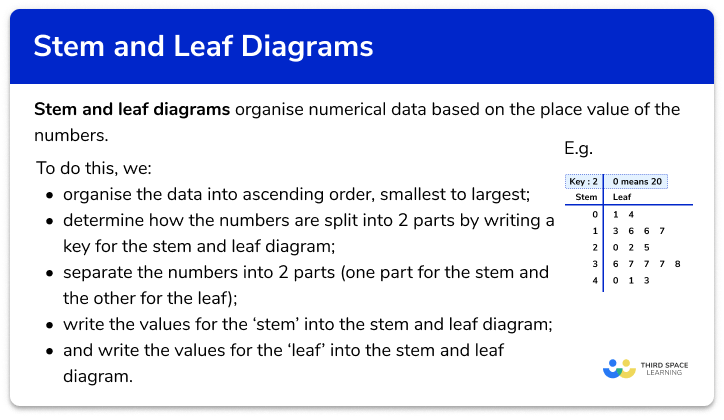
When constructing a frequency table, it is often useful to begin with a tally chart to organise and count the number of data items in each category or group.
We can easily find the mode from a frequency table by identifying the category or group with the highest frequency.
To find the mean for ungrouped data, we multiply the data value by its frequency for each category, then sum and divide by the number of pieces of data. To estimate the mean for grouped data, we use the same process as above, using the midpoint of each group to estimate the data value.
Looking forward, students can then progress to additional Statistics worksheets, for example a mean, median, mode and range worksheet or pie chart worksheet.
For more teaching and learning support on Statistics our GCSE maths lessons provide step by step support for all GCSE maths concepts.
Do you have students who need additional support?
With Third Space Learning's secondary maths tutoring programmes, students in Year 7-11 receive regular one to one maths tutoring to address gaps, build confidence and boost progress.
"My confidence in the tutoring is high. We've had some phenomenal results. I even had one girl get a Grade 8 this year; she came to every tutoring session."
Stacey Atkins, Maths Director, Outwood Grange Academies Trust