GCSE Tutoring Programme
Our chosen students improved 1.19 of a grade on average - 0.45 more than those who didn't have the tutoring.
In order to access this I need to be confident with:
Quartile Percentage of an amount Fractions of amountsThis topic is relevant for:

Interquartile range
Here we will learn about interquartile range, including finding the interquartile range from the quartiles for a set of data, comparing data sets using the median and the interquartile range and analysing data using quartiles and the interquartile range.
You can also download a free Interquartile Range Worksheet, suitable for those following Edexcel, AQA or OCR exam boards.
What is interquartile range?
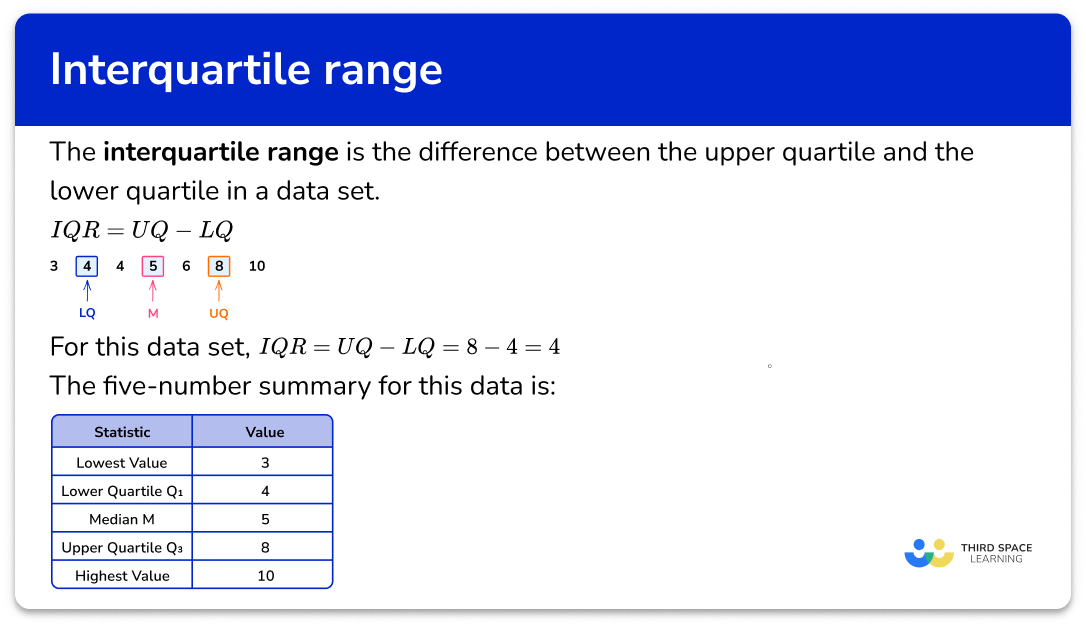
Interquartile range is the difference between the upper quartile (or third quartile) and the lower quartile (or first quartile) in an ordered data set.
Interquartile range \bf{=} upper quartile \bf{-} lower quartile
IQR=UQ-LQ\text{ or }IQR=Q_{3}-Q_{1}
The data must be in order (smallest to largest).
Remember,
- The first quartile, Q_{1} is \frac{1}{4} of the way through the data – the lower quartile.
- The second quartile, Q_{2} is \frac{1}{2} of the way through the data – the median value.
- The third quartile, Q_{3} is \frac{3}{4} of the way through the data – the upper quartile.
We can also consider each quartile as a percentile where,
- The lower quartile LQ is the \bf{25} th percentile as 25\% of the data lies below this value.
- The median M is the \bf{50} th percentile as 50\% of the data lies below (or above) this value.
- The upper quartile UQ is the \bf{75} th percentile as 75\% of the data lies below this value.
Note: the lower quartile is the median of the lower half of the data, the upper quartile is the median of the upper half of the data.
Step-by-step guide: Quartile
For example,
Find the interquartile range of the following data.
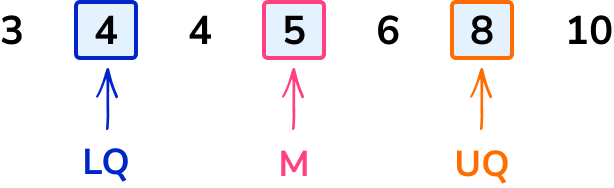
Here, IQR=UQ-LQ=8-4=4
The interquartile range (IQR) is a descriptive statistic, and measures the variability or spread of the data.
The larger the interquartile range, the wider the spread of the central 50\% of data.
The smaller the value for the interquartile range, the narrower the central 50\% of data for the data set.
The IQR is far more representative of the spread of this data set because it is not affected by extreme values.
The median and lower and upper quartiles, along with the minimum value and the maximum value of the data set, form a five-number summary of descriptive statistics for the data set. This information can then be presented in a box plot (box and whisker diagram) making it easy to compare with other sets of data.
The interquartile range is not part of this five-number summary, but is useful alongside it as a measure of dispersion or spread.
What is interquartile range?
How to find the interquartile range
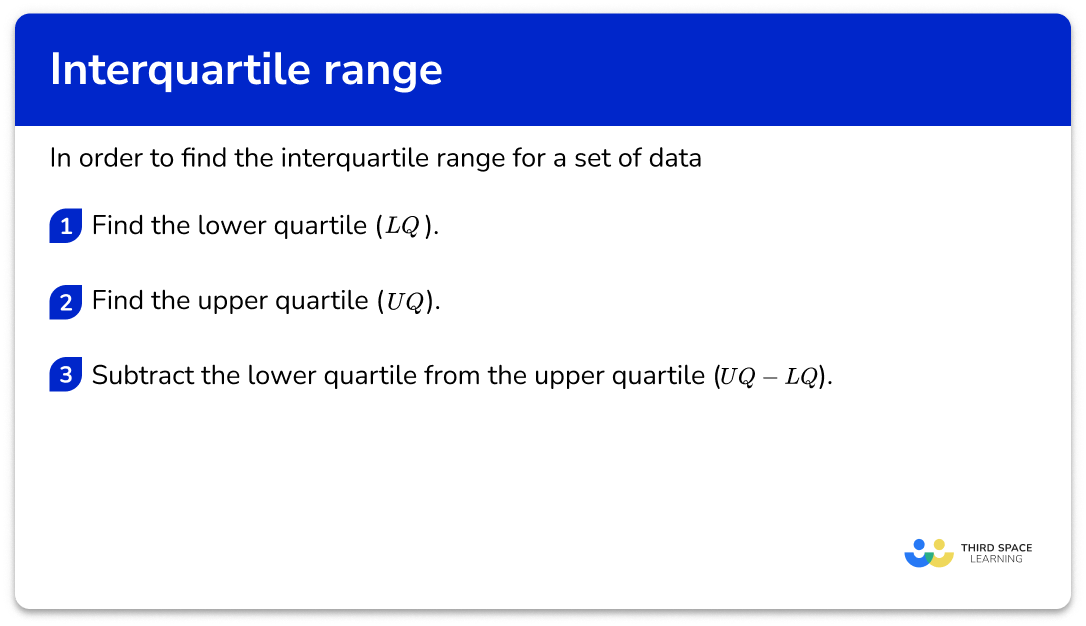
In order to find the interquartile range for a set of data:
- Find the lower quartile ( LQ ).
- Find the upper quartile ( UQ ).
- Subtract the lower quartile from the upper quartile ( UQ-LQ ).
Explain how to find the interquartile range
Interquartile range worksheet
Get your free interquartile range worksheet of 20+ questions and answers. Includes reasoning and applied questions.
DOWNLOAD FREE Interquartile range worksheet
Get your free interquartile range worksheet of 20+ questions and answers. Includes reasoning and applied questions.
DOWNLOAD FREERelated lessons on cumulative frequency
Interquartile range is part of our series of lessons to support revision on cumulative frequency. You may find it helpful to start with the main cumulative frequency lesson for a summary of what to expect, or use the step by step guides below for further detail on individual topics. Other lessons in this series include:
Interquartile range examples
Example 1: odd number of ordered data values
Find the interquartile range for the following set of data.
1, 1, 2, 3, 5, 7, 7, 8, 10, 12, 15
Step-by-step guide: Quartile (Example 1)
- Find the lower quartile ( LQ ).
The median is the middle value, 7 , and so the lower quartile is the middle number in the lower half of the data, excluding the median.
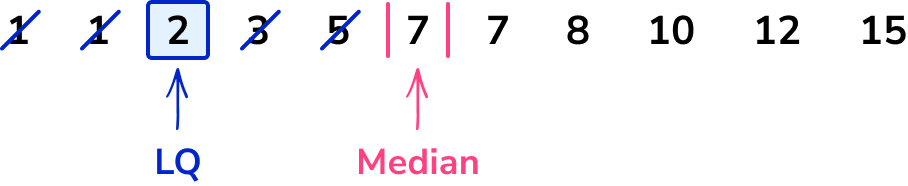
LQ = 2
2Find the upper quartile ( UQ ).
The upper quartile is the middle value in the upper half of the data, excluding the median value (7) .
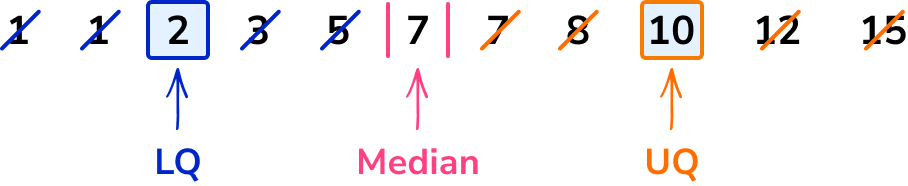
UQ = 10
3Subtract the lower quartile from the upper quartile ( UQ-LQ ).
As LQ=2 and UQ=10
IQR=UQ-LQ=10-2=8
Example 2: small continuous data set (even amount of data values)
The data below shows birth weights of 10 babies in kilograms.
\begin{aligned} &3.3 \quad 3.7 \quad 2.5 \quad 3.5 \quad 3.0 \\ &4.3 \quad 3.1 \quad 4.1 \quad 1.9 \quad 3.6 \end{aligned}
Calculate the interquartile range for the data set.
Step-by-step guide: Quartile (Example 2)
The median for an even number of data values in a data set is the average of these two middle values. Here, the median is 3.4 . The lower quartile is the middle of the lower half of the data.
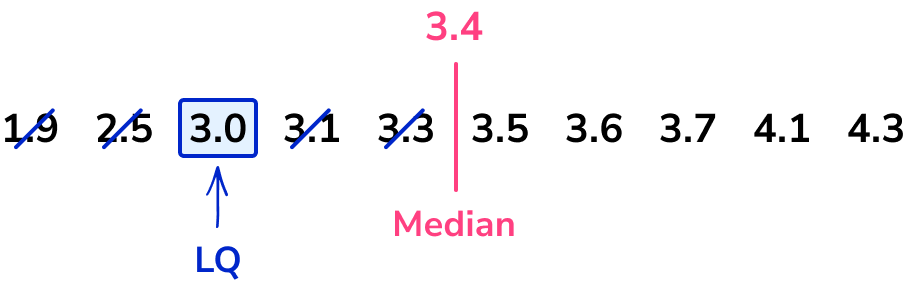
LQ = 3.0
The upper quartile is the middle value of the upper half of the data set.
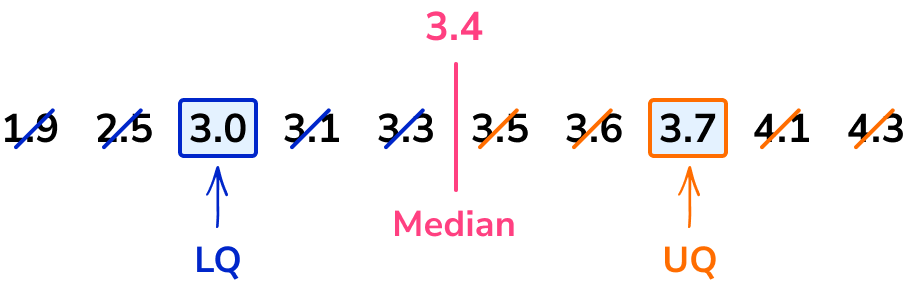
UQ = 3.7
As LQ=3.0 and UQ=3.7,
IQR=UQ-LQ=3.7-3.0=0.7kg
Example 3: odd number of unordered data values
Find the interquartile range.
13, 8, 20, 16, 3, 5, 40, 14, 34
Step-by-step guide: Quartile (Example 3)
Using the ordered data set, we have
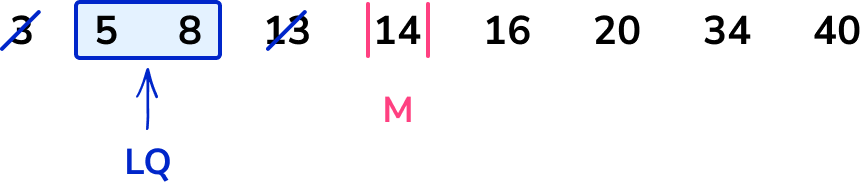
The midpoint of the two data values 5 and 8 is 6.5.
LQ = 6.5
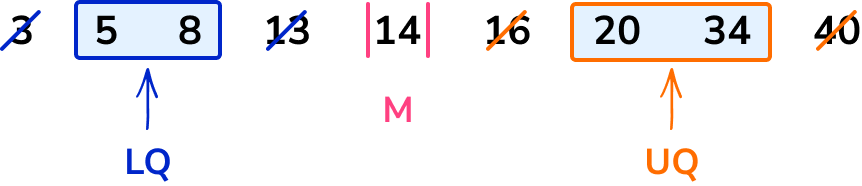
The midpoint of the two data values 20 and 34 is 27.
UQ = 27
As LQ=6.5 and UQ=27,
IQR=UQ-LQ=27-6.5=20.5
Example 4: IQR from a stem and leaf diagram
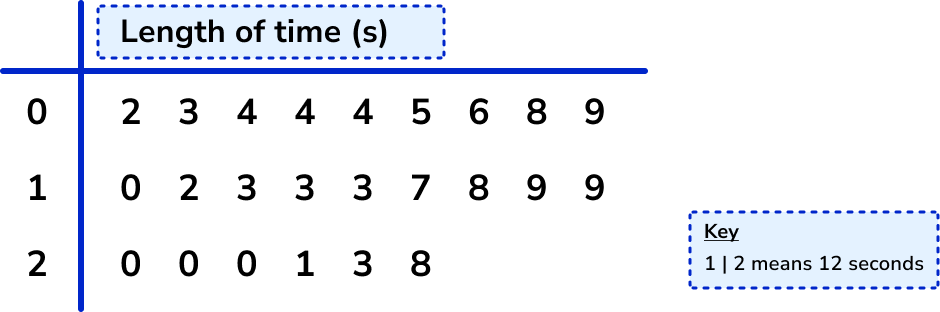
Find the interquartile range from the data in the stem and leaf diagram.
Step-by-step guide: Quartile (Example 4)
n is the number of values in the data set; here n=24.
As we have an even number of items in the data set, we use the formula \frac{n+1}{4} with n=24 to give
\frac{24+1}{4}=\frac{25}{4}=6.25
So the lower quartile lies between the 6th and 7th data point. It is sufficient at GCSE just to use the midpoint of these two values.
Using the stem and leaf diagram, we have
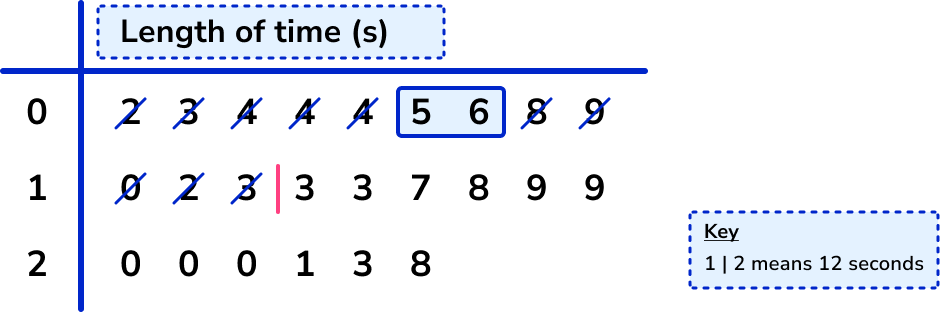
After using the key, the 6th and 7th of values are 5 and 6. The midpoint of these is 5.5, so the lower quartile is 5.5.
We use the formula 3\times\frac{n+1}{4} with n=24 to give
3 \times \frac{24+1}{4}=3 \times \frac{25}{4}=3 \times 6.25=18.75
Note that if you’ve already found that the lower quartile is the 6.25th value, you can simply multiply 6.25 by 3 to get 18.75.
So the upper quartile lies between the 18th and 19th data point, and we use the midpoint of these values.
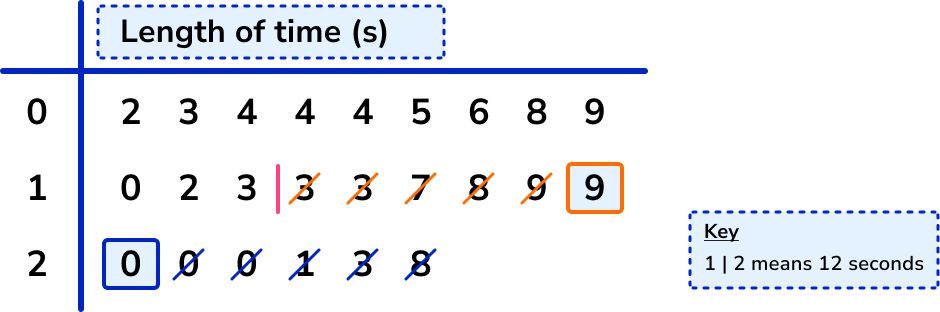
Using the key, the 18th and 19th values are 19 and 20 respectively. The midpoint of these is 19.5, so the upper quartile is 19.5.
As LQ=5.5 and UQ=19.5,
IQR=UQ-LQ=19.5-5.5=14
Example 5: IQR from a five-number summary
Below is a table showing a summary of statistical values for a reaction time experiment.
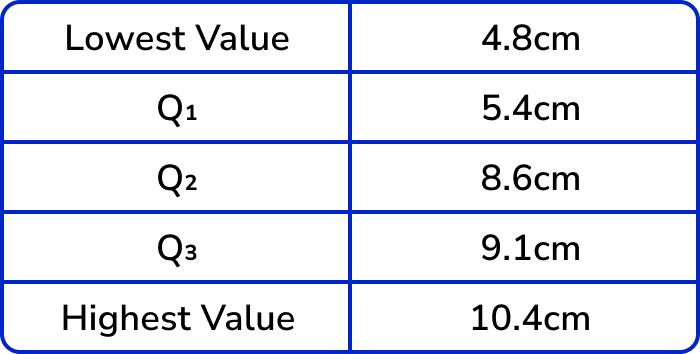
Determine the interquartile range of reaction times.
The lower quartile is the value Q_1. Here LQ=5.4cm.
The upper quartile is the value Q_3. Here UQ=9.1cm.
IQR=UQ-LQ=9.1-5.4=3.7cm
Example 6: IQR from a cumulative frequency curve
The cumulative frequency curve below shows the total marks achieved by a sample of students in an exam. Calculate the interquartile range of the data set.
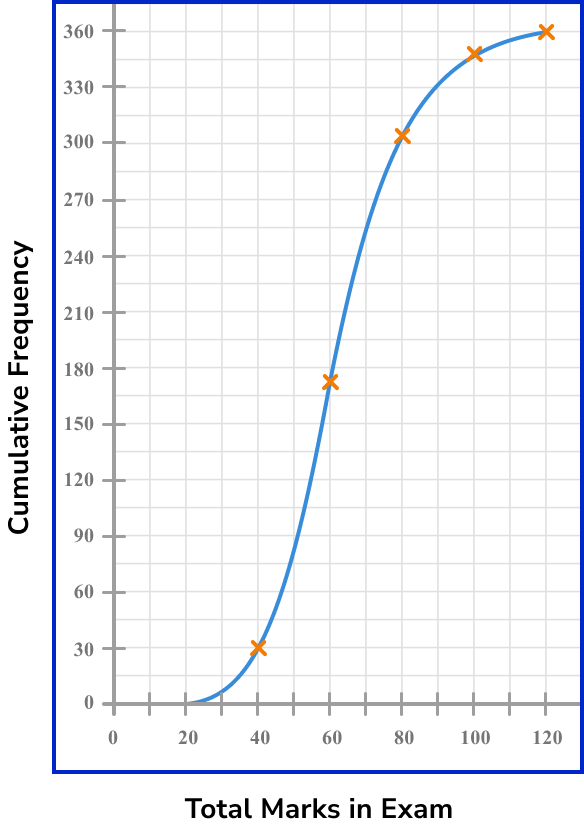
The sample size is 360 students. The lower quartile is the value that represents the lowest 25\% of the data. To find this, we need to calculate 25\% of the total number of students.
360\times{0.25}=90.
We then draw a horizontal line from 90 on the vertical axis to the cumulative frequency curve, and then from the curve to the horizontal axis, and read off the value.
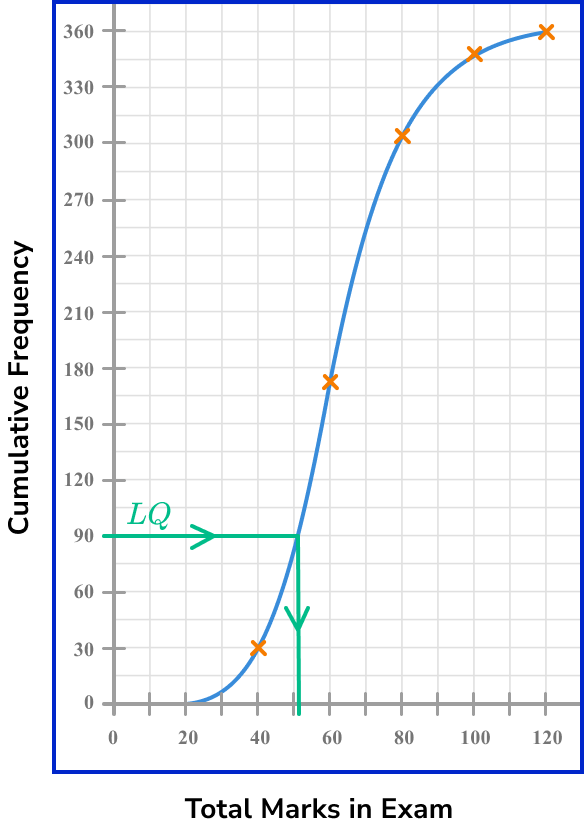
Here, the lower quartile is 51.
The upper quartile represents the value where 75\% of the data lies below. Calculating 75\% of 360, we have
360\times{0.75}=270.
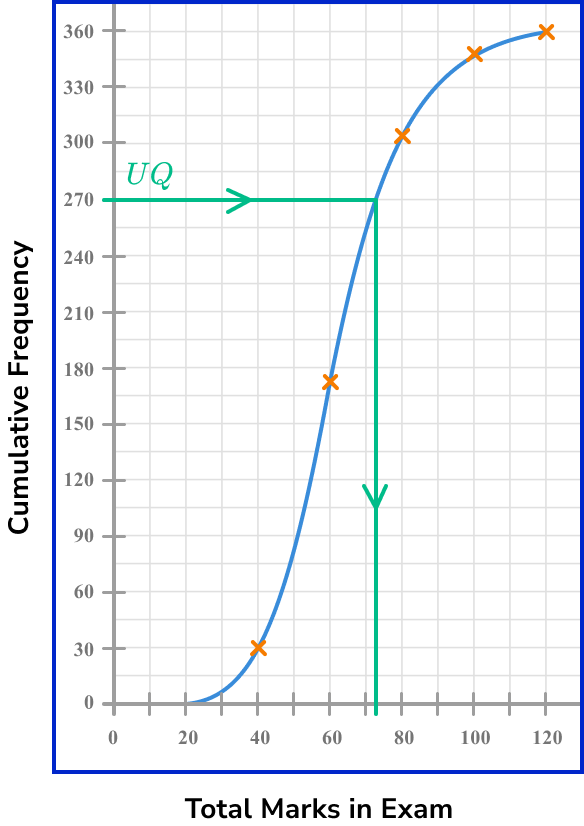
Using the same approach for the upper quartile as finding the lower quartile, we draw a horizontal line across from 270 on the vertical axis to the curve, and then down to the horizontal axis, and read off the value.
The upper quartile is therefore 72.
As UQ=72 and LQ=51,
IQR=UQ-LQ=72-51=21
Step-by-step guide: Cumulative frequency (coming soon)
Example 7: IQR from a box plot
The box plot below shows the distribution of the age of trees in a woodland.
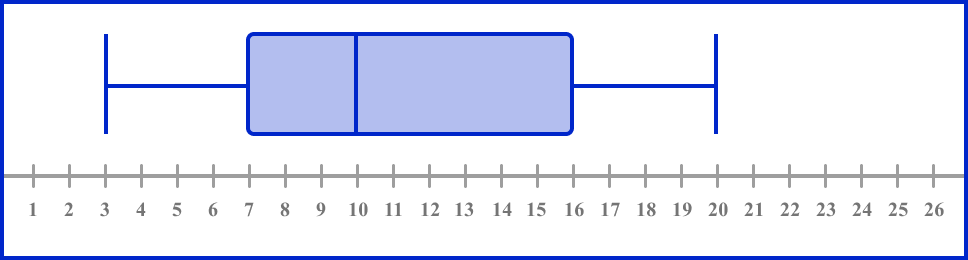
Calculate the interquartile range of ages of trees.
The lower quartile of a box plot is the left hand edge of the box within the box plot. This line is positioned above the value 7 on the scale and so
LQ=7
The upper quartile of a box plot is the right hand edge of the box within the box plot. This line is positioned above the value 16 on the scale and so
UQ=16
As UQ=16 and LQ=7,
IQR=UQ-LQ=16-7=9
Step-by-step guide: Box plots (coming soon)
Common misconceptions
- Forgetting to order the data set before finding the median or quartiles
The list/data set must be in order from smallest to largest before you start finding the key values.
- Stating the quartile value as the number given by the formula, rather than counting and finding that value in the data
For example, for the data set 3, 4, 6, 7, 10, the formula for the lower quartile gives \frac{5-1}{4}=\frac{6}{4}=1.5. This tells you which data values to select (in this case, the midpoint of the 1 st and 2 nd values); do not just write LQ=1.5.
- The range is calculated instead of the interquartile range
The range is the smallest value subtracted from the largest value whereas the interquartile range is the lower quartile, subtracted from the upper quartile.
Practice interquartile range questions
1. Calculate the interquartile range for the following list of values.
19,20,21,21,23,23,27


2. Find the interquartile range for the data set.
3,4,4,5,8,10,13,14,14
3. Find the interquartile range.
6,14,45,12,19,33,21,23,15
Ordering the data first, we get:
6, 12, 14, 15, 19, 21, 23, 33, 45
\begin{aligned} &LQ=13, \quad UQ=28 \\\\ &IQR=UQ-LQ=28-13=15 \end{aligned}
4. This table shows the shoe sizes of 18 boys. Calculate the interquartile range for the data.

5. This table shows the five-number summary for a set of data.
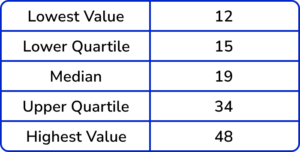
Calculate the interquartile range.
LQ=15, \ UQ=34 and then 34-15=19
6. This table shows some descriptive statistics for a set of data.
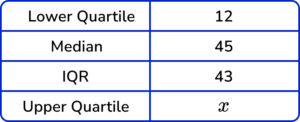
Calculate the value for the upper quartile, x.
LQ=12 and IQR=43.
To calculate the UQ, we add the interquartile range to the value for the lower quartile:
x=LQ+IQR=12+43=55.
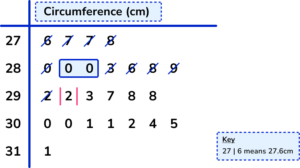
7. Data was collected about the circumference of apples in an orchard. The data was sorted into the stem and leaf diagram below.
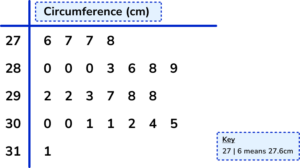
Calculate the interquartile range of circumferences of apples within the orchard.
There are 25 apples in the data set.
The median for an odd number of data values is found in the position \frac{n+1}{2}. As n=25, the median is in the 13th position and so the value for the median is 29.2cm.
The lower quartile is the middle value of the lower half of the data, excluding the median value (29.2cm). Here, the lower quartile is between the two values 28.0cm and 28.0cm and so the lower quartile is 28.0cm.
The upper quartile is the middle of the upper half of the data, excluding the median. Here the upper quartile is halfway between 30.0cm and 30.1cm which is equal to 30.05cm.
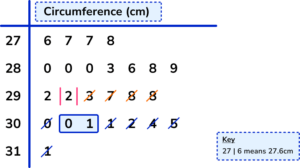
As IQR=UQ-LQ,
IQR=30.05-28.0=2.05cm.
Interquartile range GCSE questions
1. The following data shows the maths test results of 15 students.
12,17,18,19,19,20,23,24,24,25,26,27,28,30,35
Work out the interquartile range.
(2 marks)
Either LQ=19 \; or \; UQ=27
(1)
IQR=8(1)
2. (a) This data set shows the yearly salary paid to each worker at a small company.
£23,000, \;\; £25,000, \;\; £25,500, \;\; £27,000, \;\; £32,000, \;\; £60,000
Why should the interquartile range be used to describe the spread of this data?
(b) Calculate the interquartile range.
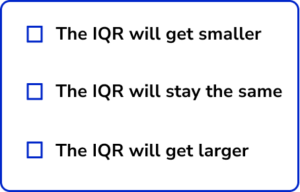
(c) Each member of staff receives a 1\% pay increase. Without any calculation, how will this affect the interquartile range? Tick the correct answer and state your reason why.
(5 marks)
(a)
IQR should be used because the data set contains an extreme value/outlier (£60,000) .
(1)
(b)
Either LQ=£25,000 \; or \; UQ=£32,000
(1)
IQR=7(1)
(c)
The IQR will get larger (with appropriate reason).
(1)
The upper quartile will increase by a larger value than the lower quartile as 1\% of a larger quantity is a greater value than 1\% of a smaller quantity.
(1)
3. A shopkeeper records the number of people in her shop at half-hour intervals throughout the day:
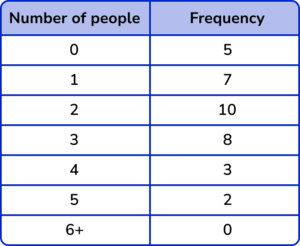
(a) Find the median number of shoppers.
(b) Calculate the interquartile range.
(c) Work out the total number of shoppers during the day.
(6 marks)
(a)
Median 18th data point so median =2 .
(1)
(b)
Lower quartile 9th data point so LQ=1 .
(1)
Upper quartile 27th data point so UQ=3 .
(1)
IQR=3-1=2(1)
(c)
(0 \times 5)+(1 \times 7)+(2 \times 10)+(3 \times 8)+(4 \times 3)+(5 \times 2)+(6 \times 0)
(1)
=73(1)
Learning checklist
You have now learned how to:
The next lessons are
Still stuck?
Prepare your KS4 students for maths GCSEs success with Third Space Learning. Weekly online one to one GCSE maths revision lessons delivered by expert maths tutors.

Find out more about our GCSE maths tuition programme.