GCSE Tutoring Programme
Our chosen students improved 1.19 of a grade on average - 0.45 more than those who didn't have the tutoring.
This topic is relevant for:

Quartile
Here we will learn about a quartile, including what a quartile is, how to find the lower quartile and upper quartile for a set of data, and why these measures are useful.
You can also download the following free quartile resources all suitable for those following Edexcel, AQA or OCR exam boards:
What is a quartile?
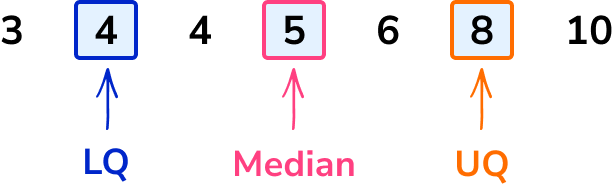
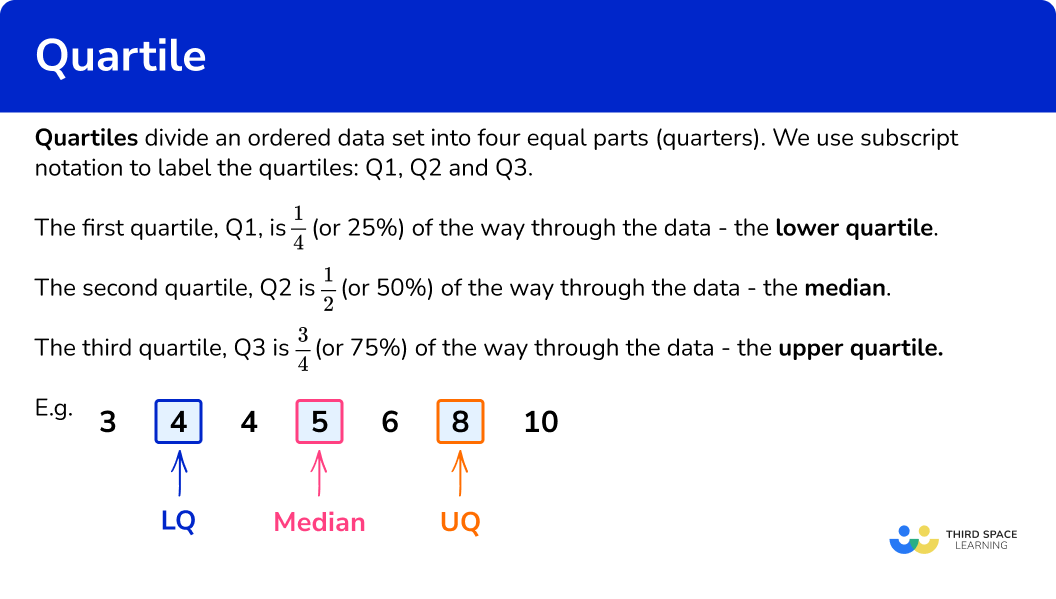
A quartile divides an ordered data set into four equal parts (quarters). We use subscript notation to label the quartiles: Q_{1}, Q_{2} and Q_{3}.
The first quartile, Q_{1}, is \frac{1}{4} (or 25\% ) of the way through the data – the lower quartile.
The second quartile, (Q_{2}) is \frac{1}{2} (or 50\% ) of the way through the data – the median.
The third quartile, (Q_{3}) is \frac{3}{4} (or 75\% ) of the way through the data – the upper quartile.
You can only find quartiles for quantitative (numerical) data sets, but they can be found for both discrete and continuous quantitative data sets. Remember, discrete data is data that can only take certain values (counted data), whereas continuous data can take any value within a given range (measured data).
For a small data set, you can find quartiles by simply counting and finding the correct data points.
E.g.
For a larger data set, there are a few different methods that can be used. The one we use at GCSE is very similar to calculating the median although different methods can give slightly different answers.
Step-by-step guide: Median
What is a quartile?
Interquartile range
Finding the lower and upper quartiles for a data set allows you to examine the middle half of the data centralised around the median – this is useful if a data set contains a lot of outliers or extreme values.
The lower and upper quartiles can also be used to calculate the interquartile range (IQR), which is a measure of the variability or spread of the data.
IQR=UQ-LQ\text{ or }IQR=Q_{3}-Q_{1}
Step-by-step guide: Interquartile range
Box plot
The median and lower and upper quartiles, along with the minimum value and the maximum value of the data set, form a five-number summary of descriptive statistics for the data set.
This information can then be presented in a box plot (box and whisker diagram), making it easy to compare with other sets of data.
Step-by-step guide: Box plot
Percentiles
Quartiles are one way of splitting data to analyse; you may see the word percentiles used when discussing data sets in different contexts such as news reports. For example, you might see something about ‘the top 10\% of exam results’ – to calculate this, you would find the 90th percentile using a similar method to that for quartiles.
There is a link between quartiles and percentiles as follows
- First/lower quartile – 25th percentile
- Second quartile/median – 50th percentile
- Third/upper quartile – 75th percentile
Percentiles are not examined in GCSE Maths, but they are included in GCSE Statistics and at A Level along with standard deviation (a measure of dispersion or central tendency), determining outliers, using the the normal distribution including quantiles and deciles, and more exploratory data analysis techniques.
How to find a quartile for a small data set
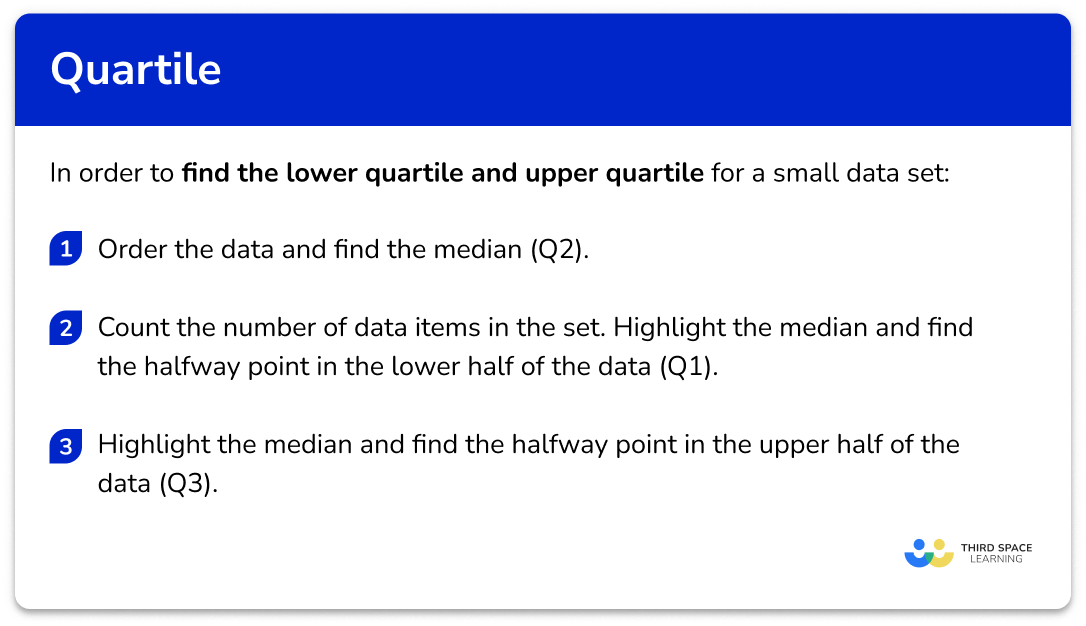
In order to find the quartiles for a small data set:
- Order the data and find the median \bf{(Q_{2})} .
- Count the number of data items in the set. Highlight the median and find the halfway point in the lower half of the data \bf{(Q_{1})} .
- Highlight the median and find the halfway point in the upper half of the data \bf{(Q_{3})} .
Explain how to find a quartile for a small data set
Quartile and interquartile range worksheet
Get your free quartile and interquartile range worksheet of 20+ questions and answers. Includes reasoning and applied questions.
DOWNLOAD FREE Quartile and interquartile range worksheet
Get your free quartile and interquartile range worksheet of 20+ questions and answers. Includes reasoning and applied questions.
DOWNLOAD FREERelated lessons on cumulative frequency
Quartile is part of our series of lessons to support revision on cumulative frequency. You may find it helpful to start with the main cumulative frequency lesson for a summary of what to expect, or use the step by step guides below for further detail on individual topics. Other lessons in this series include:
Quartile examples
Example 1: small discrete data set, odd number of data points
Find the lower and upper quartiles.
1, \quad 1, \quad 2, \quad 3, \quad 5, \quad 7, \quad 7, \quad 8, \quad 10, \quad 12, \quad 15
- Order the data and find the median \bf{(Q_{2})} .
The data is ordered, so we go straight ahead and find the median. For a small data set, you can just cross numbers off from either end in turn until you reach the middle.
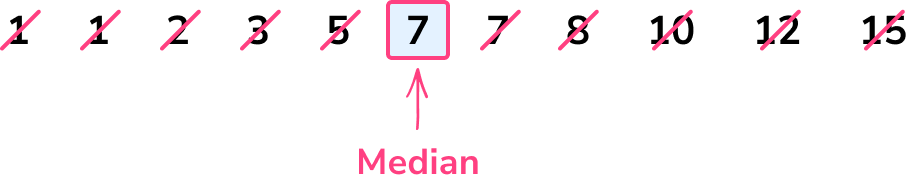
The median (Q_{2}) is 7.
2Count the number of data items in the set. Highlight the median and find the halfway point in the lower half of the data \bf{(Q_{1})} .
There are 11 items of data. As there is an odd number of data items, we do not include the median when looking at the lower half of the data. If we mark 7 (the median) using two vertical lines either side of the number, as if to fence off the value from further calculations, the lower half of the data is
1, \quad 1, \quad 2, \quad 3, \quad 5
Repeating the process of crossing off to find the middle value for the lower half of the data, we have
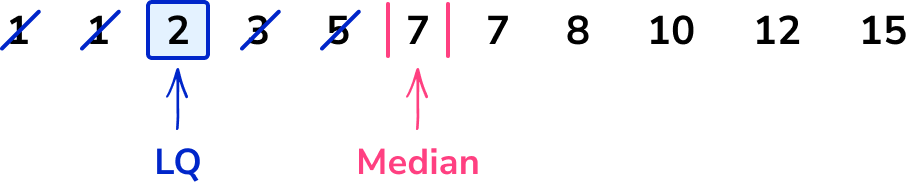
The lower quartile (Q_{1}) is 2.
3Highlight the median and find the halfway point in the upper half of the data \bf{(Q_{3})} .
Excluding the median, the upper half of the data is
7, \quad 8, \quad 10, \quad 12, \quad 15
Repeating the process of crossing off to find the middle value for the upper half of the data, we have
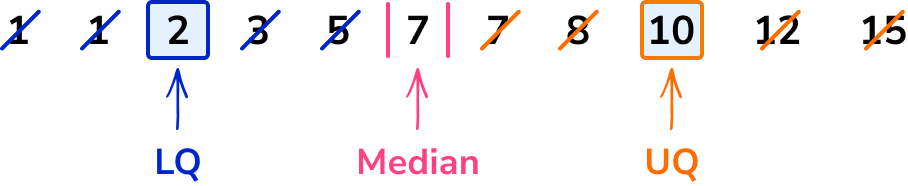
The upper quartile (Q_{3}) is 10.
Example 2: small data set, even number of data points
The data below shows birth weights of 10 babies in kilograms.
Find the lower and upper quartiles.
\begin{aligned} &3.3 \quad 3.7 \quad 2.5 \quad 3.5 \quad 3.0 \\ &4.3 \quad 3.1 \quad 4.1 \quad 1.9 \quad 3.6 \end{aligned}
Ordering the data, we get
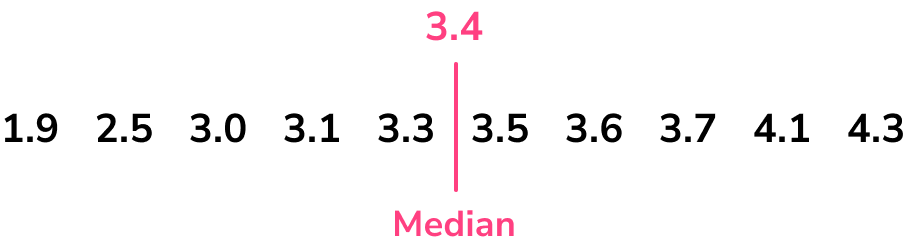
1.9, \quad 2.5, \quad 3.0, \quad 3.1, \quad 3.3, \quad 3.5, \quad 3.6, \quad 3.7, \quad 4.1, \quad 4.3
Now, find the median by crossing numbers off from either end in turn until you reach the middle.

There are two middle values and so we need to calculate the midpoint of these.
(3.3+3.5)\div{2}=3.4
The median (Q_{2}) is 3.4kg.
The median was 3.4. Marking this on our set of data, we still do not include this value when calculating the lower quartile, but we do find the middle of all of the values below the median.
We mark 3.4, which is the median. The lower half of the data is
1.9, \quad 2.5, \quad 3.0, \quad 3.1, \quad 3.3
We do include the 3.3 value we used in the median calculation, as this wasn’t actually the median value.
Repeating the process of crossing off values to find the middle value for the lower half of the data, we have
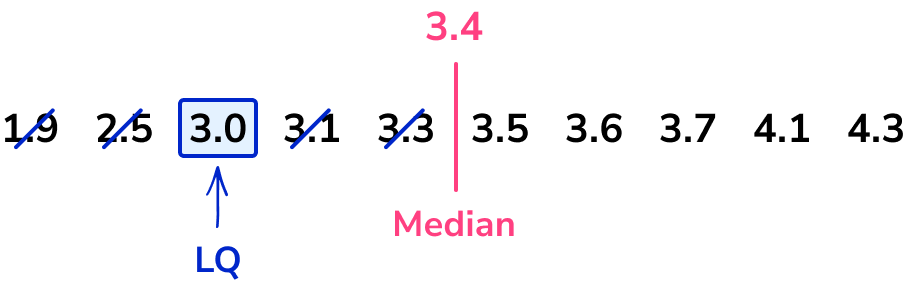
The lower quartile (Q_{1}) is 3.0kg.
Excluding the median, the upper half of the data is
3.5, \quad 3.6, \quad 3.7, \quad 4.1, \quad 4.3
Again, note that we do include the data point 3.5.
Repeat the process of crossing off to find the middle value for the upper half of the data.
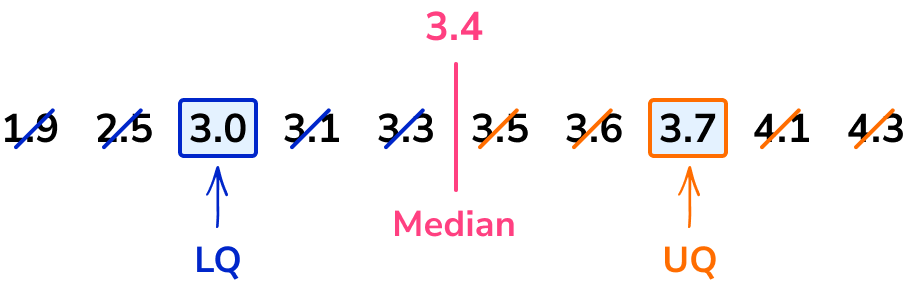
The upper quartile (Q_{3}) is 3.7kg.
Example 3: small discrete data set, using midpoints for quartiles
Find the lower and upper quartiles for the following data set.
13, \quad 8, \quad 20, \quad 16, \quad 3, \quad 5, \quad 40, \quad 14, \quad 34
Ordering this data set from smallest to largest, we have
3, \quad 5, \quad 8, \quad 13, \quad 14, \quad 16, \quad 20, \quad 34, \quad 40
As this is a small data set, just cross numbers off from either end in turn until you reach the middle.
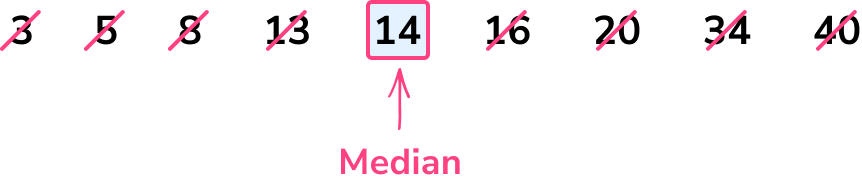
The median (Q_{2}) is 14.
As there is an odd number of data values, we do not use the median value when finding the other two quartiles. We mark 14, which is the median and so the lower half of the data is
3, \quad 5, \quad 8, \quad 13
Repeating the process of crossing off to find the middle value for the lower half of the data, we have
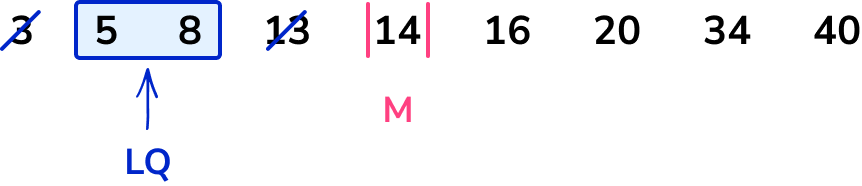
As there are two data points, 5 and 8, we need to calculate the midpoint of these two values.
\frac{5+8}{2}=\frac{13}{2}=6.5
The lower quartile (Q_{1}) is therefore 6.5.
The values in the upper half of the data are
16, \quad 20, \quad 34, \quad 40
Again, note that we don’t include the median data point in the upper half.
Repeat the process of crossing off to find the middle value for the upper half of the data.
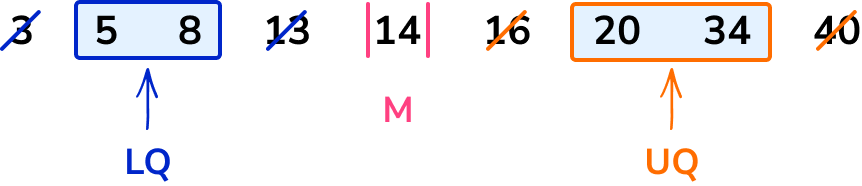
Again there are two data points, 20 and 34, in the middle of the data so we find the midpoint of these, which is 27.
If you weren’t sure on the midpoint, you could do the calculation
\frac{20+34}{2}=\frac{54}{2}=27
The upper quartile (Q_{3}) is 27.
Working with a large data set
For a large data set, crossing numbers off a list can be time-consuming and a bit confusing, particularly if the data spans over two or more lines when listed. Here we can use an alternative method to find the lower and upper quartiles.
For a data set containing n values
- The lower quartile, (Q_{1}) , is located at the position \frac{n+1}{4}.
- The median, (Q_{2}) , is located at the position \frac{n+1}{2}.
- The upper quartile, (Q_{3}) , is located at the position 3\times\frac{n+1}{4}.
Note that you are finding out the position of the lower or upper quartile. You still need to count through the data set to find which values these are.
In situations where data is grouped, this method can also be used to find the class intervals in which the lower and upper quartile lie. This is particularly when estimating the quartiles in a histogram.
How to find quartiles for a large data set
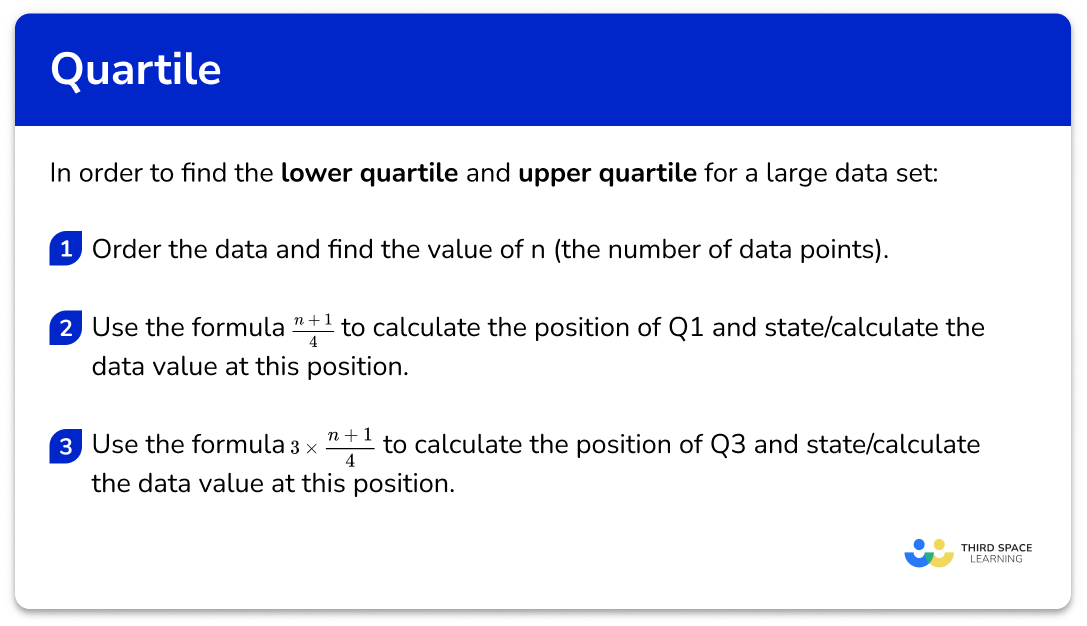
In order to find the lower quartile and upper quartile for a large data set:
- Order the data and find the value of \bf{n} (the number of data points).
- Use the formula \bf{\frac{n+1}{4}} to calculate the position of \bf{(Q_{1})} and state/calculate the data value at this position.
- Use the formula \bf{3\times\frac{n+1}{4}} to calculate the position of \bf{(Q_{3})} and state/calculate the data value at this position.
Explain how to find quartiles for a large data set
Quartile for a large data set examples
Example 4: large data set
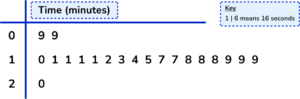
A set of data has been arranged into a stem and leaf diagram. Calculate the value of each quartile for the following data.
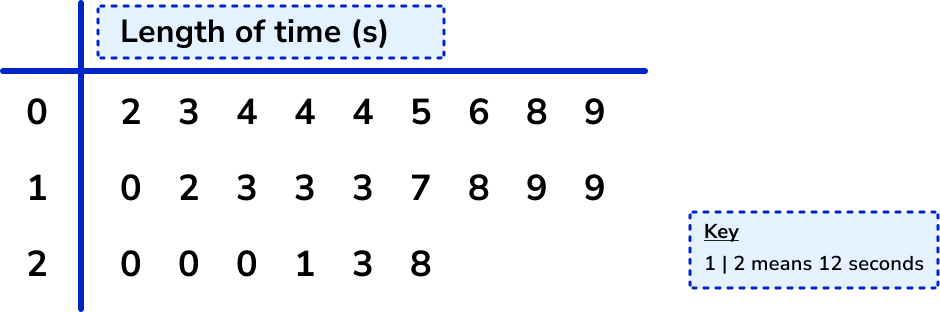
The data is already ordered. There are 24 pieces of data, so n=24.
Using the formula \frac{n+1}{4} with n=24, we have
\frac{24+1}{4}=\frac{25}{4}=6.25
So the lower quartile lies between the 6th and 7th data point. It’s sufficient at GCSE just to use the midpoint of these two values – you may see other methods used which may occasionally give different answers.
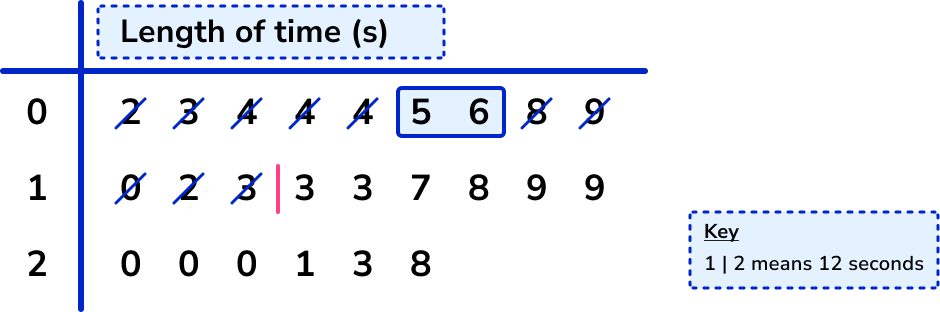
The values are 5 and 6, and the midpoint of these is 5.5, so the lower quartile is 5.5.
We use the formula 3\times\frac{n+1}{4} with n=24 to give
3 \times \frac{24+1}{4}=3 \times \frac{25}{4}=3 \times 6.25=18.75
Note that if you’ve already found that the lower quartile is the 6.25th value, you can simply multiply 6.25 by 3 to get 18.75.
So the upper quartile lies between the 18th and 19th data point, and we use the midpoint of these values.
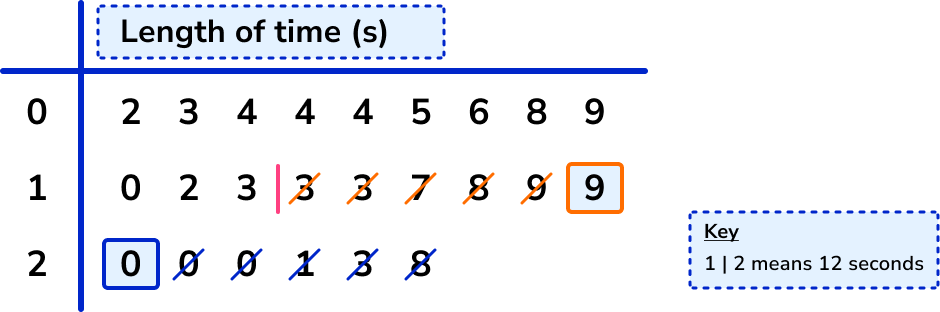
The values are 19 and 20, and the midpoint of these is 19.5, so the upper quartile is 19.5.
Example 5: grouped data
The heights (h) of 40 students are given in the table below. In which class intervals do the lower and upper quartiles lie?
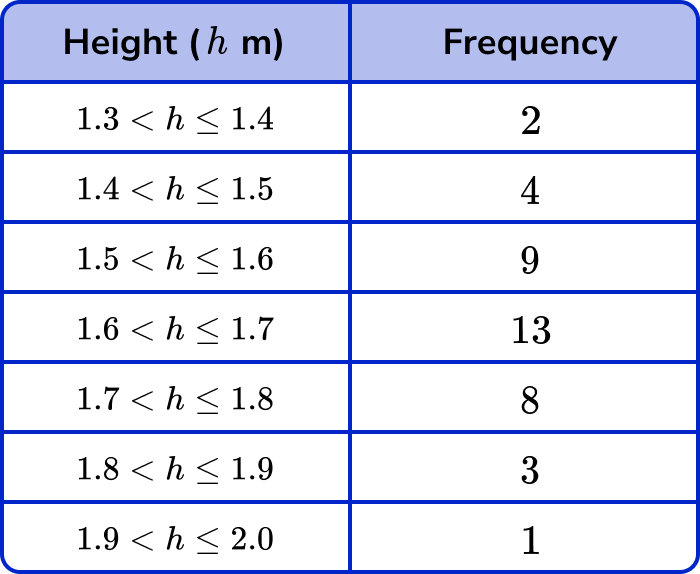
We don’t need to order the data. There are 40 pieces of data, so n=40.
Note that you are told this in the question!
Using the formula \frac{n+1}{4} with n=40, we have
\frac{40+1}{4}=\frac{41}{4}=10.25
So the lower quartile value lies between the 10th and 11th data points.
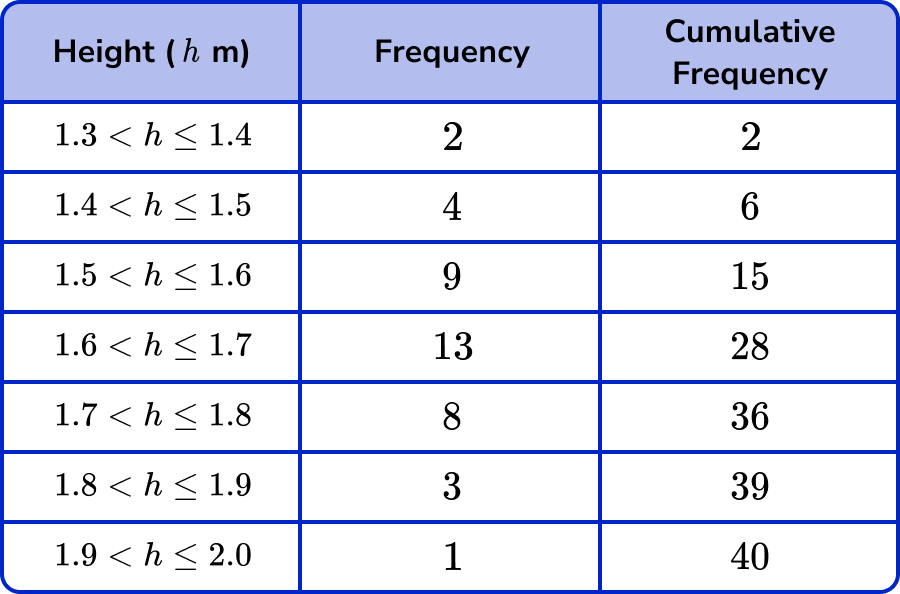
The 10th and the 11th values both lie in the class interval 1.5 < h \leq 1.6 because, by using the cumulative frequency, we can see that 15 items of data have a height h\leq{1.6}\text{m}
The lower quartile lies in the group 1.5 < h \leq 1.6
Using the formula 3\times\frac{n+1}{4} with n=40, we have
3 \times \frac{40+1}{4}=3 \times \frac{41}{4}=3 \times 10.25=30.75
So the upper quartile value lies between the 30th and 31st data points.
So the upper quartile lies between the 18th and 19th data point, and we use the midpoint of these values.
Looking back at the table with the cumulative frequency column, the 30th and the 31st values both lie in the class interval 1.7<h \leq 1.8 as there are 36 values for h \leq 1.8m so this interval is our answer to the position of the upper quartile.
This type of question doesn’t come up on GCSE exam papers very frequently (you are much more likely to be asked to state the median class interval), but, if it does, the question will be written in such a way that both values will be in the same class interval.
If you study Statistics beyond GCSE, you will learn how to more accurately estimate the median, lower and upper quartiles for grouped data using a technique called interpolation.
Example 6: quartiles from a cumulative frequency diagram
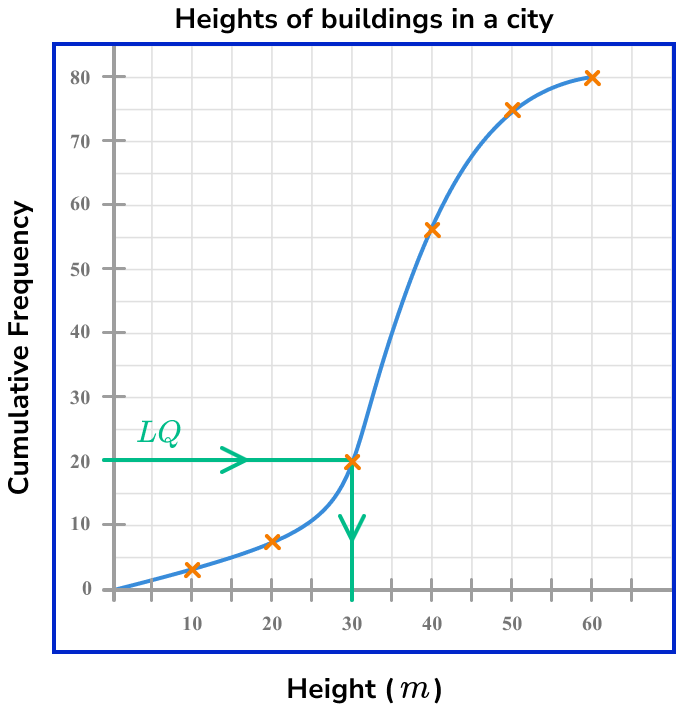
The cumulative frequency diagram below shows the distribution of heights of buildings in a city, in metres.
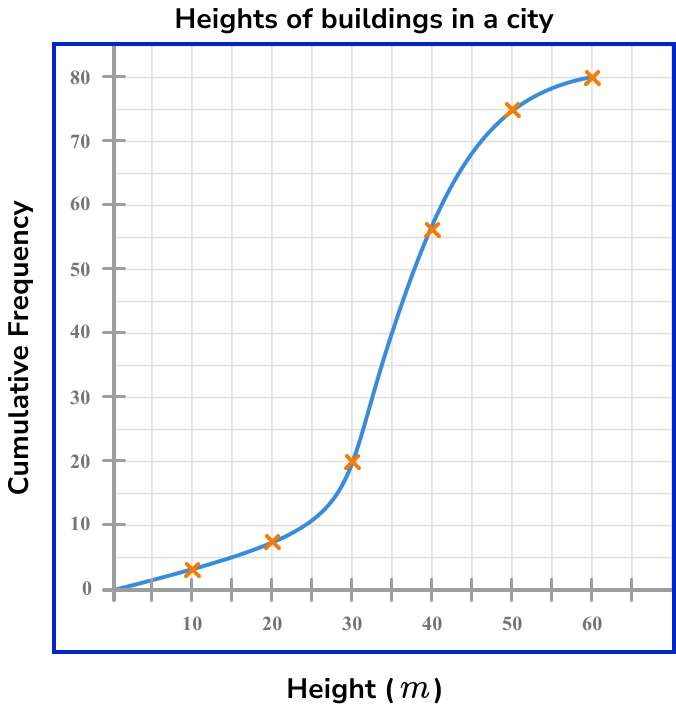
Use the diagram to calculate the values for (Q_{1}) and (Q_{3}) for this set of data.
The data within a cumulative frequency diagram is already ordered from smallest to largest. The value n is the highest value for the cumulative frequency on the graph. Here, n=80.

Quartiles from a cumulative frequency are just estimates so we can use a simplified formula \frac{n}{4} with n=80, the position of (Q_{1}) is
\frac{80}{4}=20
This is the value on the cumulative frequency axis. Drawing a horizontal line to the curve, and then down to the x -axis, we can see that the value for the lower quartile is approximately 30m (see diagram below).
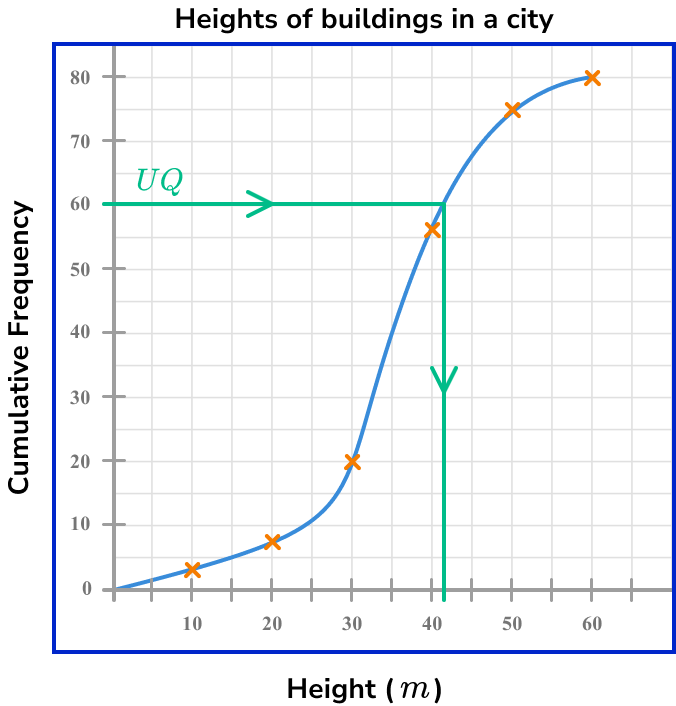
The upper quartile is located a 3\times\frac{n}{4}. When n=80
Q_{1}=3\times\frac{n}{4}=3\times\frac{80}{4}=3\times{20}=60
Drawing a horizontal line from the cumulative frequency axis at the value 60, across to the curve and then down to the x -axis, the upper quartile is approximately 42m (see diagram below).
Common misconceptions
- Forgetting to order the data set before finding the median or quartiles
The list must be in order before you start finding the key values!
- Stating the quartile value as the number given by the formula, rather than counting and finding that value in the data
e.g. for the data set 3, \ 4, \ 6, \ 7, \ 10, the formula for the lower quartile gives \frac{5-1}{4}=\frac{6}{4}=1.5. This tells you which data values to select (in this case, the midpoint of the 1st and 2nd values); do not just write LQ=1.5.
Practice quartile questions
1. Find the value of the lower and upper quartiles for the following 11 items of data.
\begin{aligned} &4 \;\; 6 \;\; 6 \;\; 7 \;\; 12 \;\; 17 \\ &18 \;\; 20 \;\; 21 \;\; 32 \;\; 35 \end{aligned}


The median is 17, so mark this, then find the median of the lower half of the data (4,6,6,7, 12) and the median of the upper half of the data (18,20,21,32,35).
The LQ is 6 and the UQ is 21.
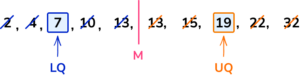
2. Find the lower and upper quartiles.
2,\;\; 4, \;\; 7, \;\; 10, \;\; 13, \;\; 13, \;\; 15, \;\; 19, \;\; 22, \;\; 32
The median is the middle value in an ordered list. The list is already ordered but there are two values at the middle of the data.
As they are both 13, the median is 13.
The middle of the lower half of the data (2, 4, 7, 10, 13) is 7 so the lower quartile is 7.
The middle of the upper half of the data (13, 15, 19, 22, 32) is 19 so the upper quartile is 19.
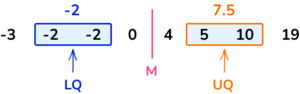
3. Find the lower and upper quartiles for the following set of data.
-3, \;\; 4, \;\; -2, \;\; 10, \;\; 19, \;\; -2, \;\; 0, \;\; 5
Ordering the data first, we have
-3, \;\; -2, \;\; -2, \;\; 0, \;\; 4, \;\; 5, \;\; 10, \;\; 19
The the median is the midpoint of 0 and 4; mark this, then find the median of the lower half of the data (-3,-2,-2,0) and the median of the upper half of the data (4,5,10,19).
There are an even number of data points, so use the midpoint of the 2nd and 3rd for the LQ and the midpoint of the 6th and 7th for the UQ.
4. This table shows the shoe sizes of 15 girls. Find the lower and upper quartiles.

Use the formulae to find out which values to pick for the lower quartile and the upper quartile.
There are 15 pieces of data, so n=15.
LQ=\frac{15+1}{4}=4 so the lower quartile is the 4th data point, which is 5.
UQ=3\times\frac{15+1}{4}=12 so the upper quartile is the12th data point, which is 7.
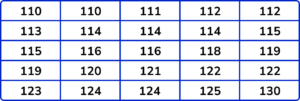
5. Raheem writes down how long his bus journey to school takes on 20 different days. The times are given to the nearest minute. Find the lower and upper quartiles for his data set.
Use the formulae to find out which values to pick for the lower quartile and the upper quartile.
There are 20 pieces of data, so n=20.
LQ=\frac{20+1}{4}=5.25 so by finding the midpoint of the 5th and 6th data points, which are both 11 (remember to use the key), the lower quartile is 11.
UQ=3\times\frac{15+1}{4}=15.75 so the midpoint of the 15th and 16th data points, which are both 18 (using the key), gives us the upper quartile of 18.
6. The weights (w) of 30 teenagers are given in the table below. Which class interval contains the upper quartile?
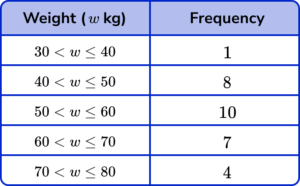
Using the formula 3\times\frac{n+1}{4} to determine the upper quartile with n=1+8+10+7+4=30, we have
UQ=3\times\frac{30+1}{4}=3\times\frac{31}{4}=23.25
So the upper quartile is between the 23rd and 24th item of data. Counting the cumulative frequency for the data set, we have
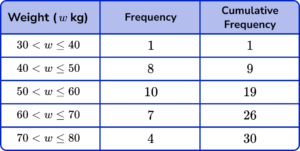
The 23rd and 24th items of data both lie in the class interval 60 < w\leq{70}.
Quartile GCSE questions
1. This table shows the heights of 25 primary school children in centimetres.
Find the lower and upper quartiles.
(2 marks)
(1)
UQ =122(1)
2. This table shows the number of goals scored by a football team.
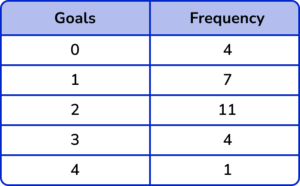
(a) Determine the median number of goals scored.
(b) Calculate the difference between the upper quartile and the lower quartile for this set of data.
(c) Work out the total number of goals scored by the football team.
(8 marks)
(a)
Total frequency (=30) stated or used
(1)
Cumulative frequencies written (4, 11, 22, 26, 30) or use of \frac{n+1}{2} so Median = \frac{31}{2}=15.5
(1)
Median =2
(1)
(b)
\frac{31}{4}=7.75 and LQ=1
(1)
3\times\frac{31}{4}=23.25 and UQ=3
(1)
3-1 = 2(1)
(c)
(0 \times 4)+(1 \times7)+(2 \times 11)+(3 \times 4)+(4 \times 4)
(1)
=57(1)
3. This table shows the birth weights of 100 babies born in 2011.
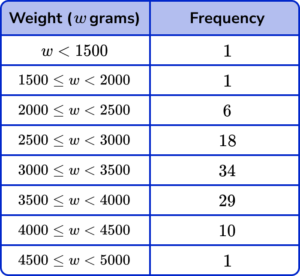
(a) Find the class interval in which the median birth weight lies.
(b) The interquartile range (IQR) is the difference between the upper and lower quartiles.
What is the largest possible value for the interquartile range for this data set? Write your answer to 2 significant figures.
(8 marks)
(a)
\frac{n+1}{2}=\frac{101}{2}=50.5 or Median lies between 50th and 51st data points
(1)
Cumulative frequencies stated up to a minimum of the 5th class interval (1, 2, 8, 26, 60, 89, 99, 100)
(1)
3000 \leq w <3500(1)
(b)
\frac{n+1}{4}=\frac{101}{4}=25.25
(1)
The lower quartile lies in the class interval 2500 \leq w < 3000
(1)
3\times\frac{n+1}{4}=3\times\frac{101}{4}=75.75(1)
The upper quartile lies in the class interval 3500\leq{w} <4000
(1)
Max value for UQ \ (4000) – Min value for LQ \ (2500) =1500g \ (2sf)
(1)
Learning checklist
You have now learned how to:
The next lessons are
Still stuck?
Prepare your KS4 students for maths GCSEs success with Third Space Learning. Weekly online one to one GCSE maths revision lessons delivered by expert maths tutors.

Find out more about our GCSE maths tuition programme.