High Impact Tutoring Built By Math Experts
Personalized standards-aligned one-on-one math tutoring for schools and districts
Interquartile range
Here you will learn about interquartile range, including finding the interquartile range from the quartiles for a set of data, comparing data sets using the median and the interquartile range, and analyzing data using quartiles and the interquartile range.
Students will first learn about interquartile range as part of statistics and probability in 6 th grade.
What is interquartile range?
Interquartile range is the difference between the upper quartile (or third quartile) and the lower quartile (or first quartile) in an ordered data set.
Interquartile range \textbf{=} upper quartile \textbf{-} lower quartile
I Q R=U Q-L Q \, or \, I Q R=Q 3-Q 1
The set of numbers that make up the data set must be in ascending order (lowest value to highest value).
Remember,
- The first quartile (Q1) is \cfrac{1}{4} of the way through the data – the lower quartile.
- The second quartile (M or Q2) is \cfrac{1}{2} of the way through the data – the median value.
- The third quartile (Q3) is \cfrac{3}{4} of the way through the data – the upper quartile.
You can also consider each quartile as a percentile where,
- The lower quartile (Q1) is the \bf{25} th percentile as 25 \% of the data lies below this value.
- The median (M or Q2) is the \bf{50} th percentile as 50 \% of the data lies below (or above) this value.
- The upper quartile (Q3) is the \bf{75} th percentile as 75 \% of the data lies below this value.
Note: the lower quartile is the median of the lower half of the data, the upper quartile is the median of the upper half of the data.
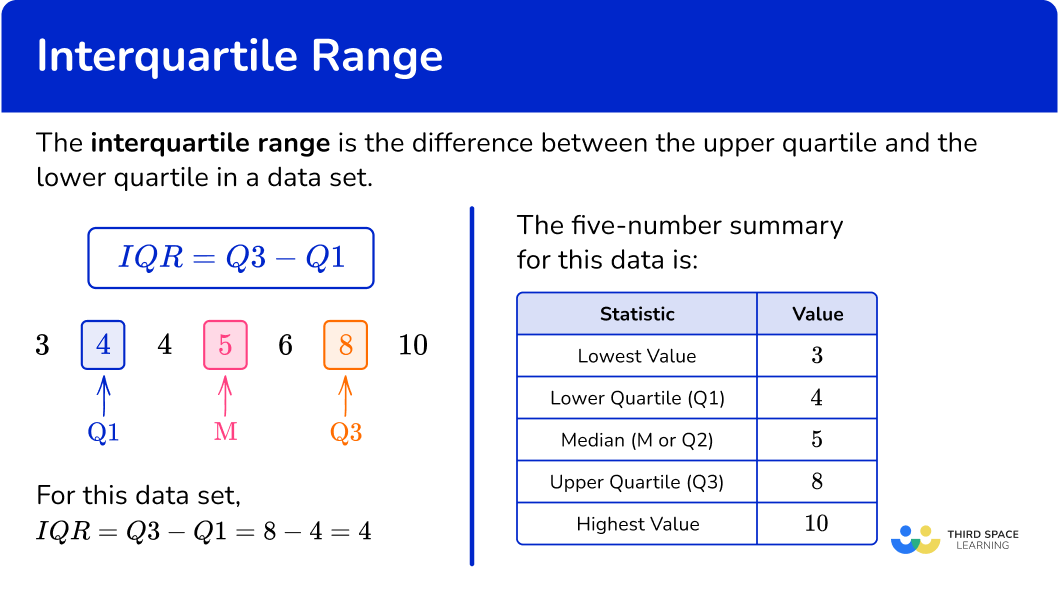
For example, find the interquartile range of the following data.
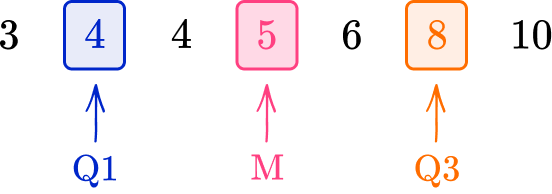
Here, IQR=Q3-Q1=8-4=4
The interquartile range (IQR) is a descriptive statistic and measures the variability or spread of the data.
The larger the interquartile range, the wider the spread of the central 50 \% of data.
The smaller the value for the interquartile range, the narrower the central 50 \% of data for the data set.
The IQR is far more representative of the spread of this data set than the range because it is not affected by extreme values.
The median and lower and upper quartiles, along with the minimum value and the maximum value of the data set, form a five-number summary of descriptive statistics for the data set. This information can then be presented in a box plot (box and whisker plot or diagram) making it easy to compare with other sets of data.
The interquartile range is not part of this five-number summary, but is useful alongside it as a measure of dispersion or spread.
What is interquartile range?
![[FREE] Representing Data Worksheet (Grade 6 to 7)](https://thirdspacelearning.com/wp-content/uploads/2023/11/Representing-Data-listing-image.png)
[FREE] Representing Data Worksheet (Grade 6 to 7)
Use this quiz to check your grade 6th to 7th students’ understanding of representing data. 10+ questions with answers covering a range of 6th and 7th grade representing data topics to identify areas of strength and support!
DOWNLOAD FREE [FREE] Representing Data Worksheet (Grade 6 to 7)
Use this quiz to check your grade 6th to 7th students’ understanding of representing data. 10+ questions with answers covering a range of 6th and 7th grade representing data topics to identify areas of strength and support!
DOWNLOAD FREECommon Core State Standards
How does this relate to 6 th grade math?
- Grade 6 – Statistics and Probability (6.SP.B.4)
Display numerical data in plots on a number line, including dot plots, histograms, and box plots.
How to find the interquartile range
In order to find the interquartile range for a set of data:
- Find the lower quartile \textbf{(Q1)}.
- Find the upper quartile \textbf{(Q3)}.
- Subtract the lower quartile from the upper quartile \textbf{(Q3 - Q1)}.
Interquartile range examples
Example 1: odd number of ordered data values
Find the interquartile range for the following set of data.

- Find the lower quartile \textbf{(Q1)}.
The median is the middle value, 7 , and so the lower quartile is the middle number in the lower half of the data, excluding the median.
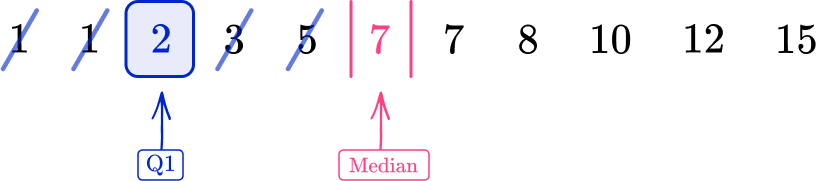
Q1=2
2Find the upper quartile \textbf{(Q3)}.
The upper quartile is the middle value in the upper half of the data, excluding the median value (7).
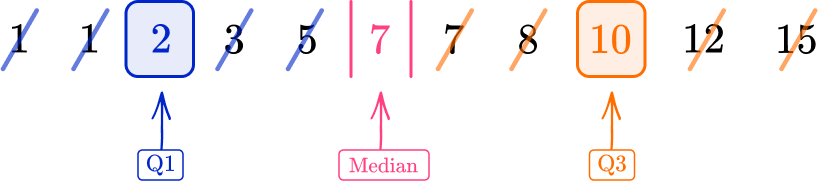
Q3=10
3Subtract the lower quartile from the upper quartile \textbf{(Q3 - Q1)}.
As Q1=2 and Q3=10
IQR=Q3-Q1=10-2=8
Example 2: small continuous data set (even amount of data values)
The data below shows birth weights of 10 babies in kilograms.
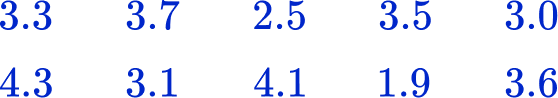
Calculate the interquartile range for the data set.
The median for an even number of data values in a data set is the average of these two middle values. Here, the median is 3.4. The lower quartile is the middle of the lower half of the data.
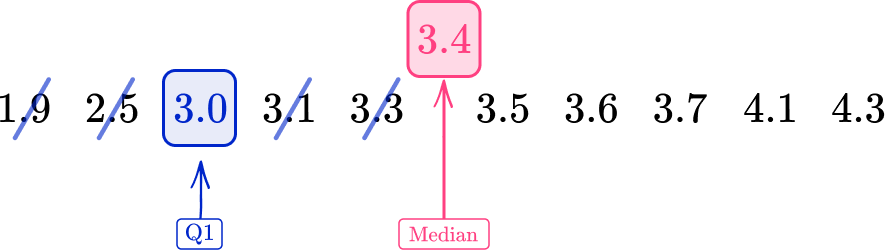
Q1=3.0
The upper quartile is the middle value of the upper half of the data set.
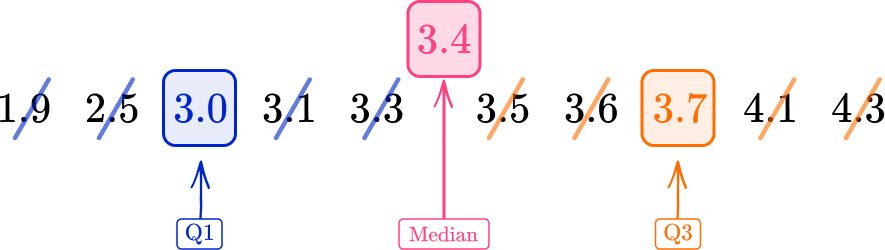
Q3=3.7
As Q1=3.0 and Q3=3.7
IQR=Q3-Q1=3.7-3.0=0.7 \, kg
Example 3: odd number of unordered data values
Find the interquartile range.

Using the ordered data set, you have
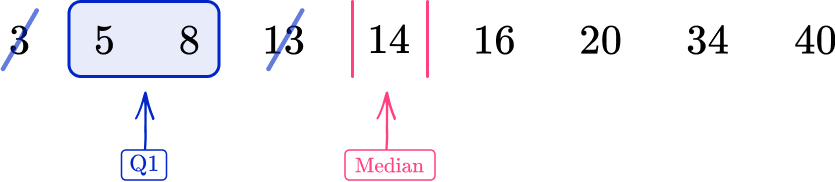
The midpoint of the two data values 5 and 8 is 6.5.
Q1=6.5
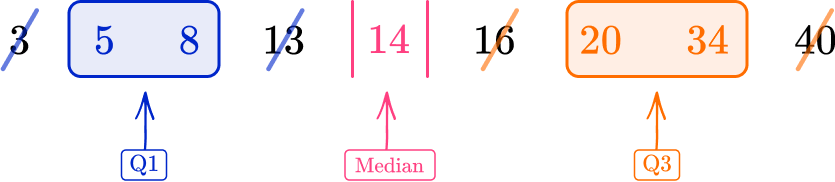
The midpoint of the two data values 20 and 34 is 27.
Q3=27
As Q1=6.5 and Q3=27
IQR=Q3-Q1=27-6.5=21.5
Example 4: IQR from a stem and leaf diagram
Find the interquartile range from the data in the stem and leaf diagram.
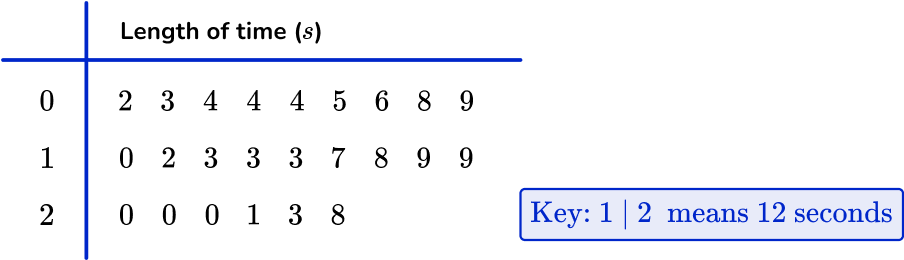
n is the number of values in the data set; here n=24.
As you have an even number of values in the data set, you use the formula \cfrac{n+1}{4} with n=24 to give
\cfrac{24+1}{4}=\cfrac{25}{4}=6.25
So the lower quartile lies between the 6 th and 7 th data point. You can use the midpoint of these two values.
Using the stem and leaf diagram, you have
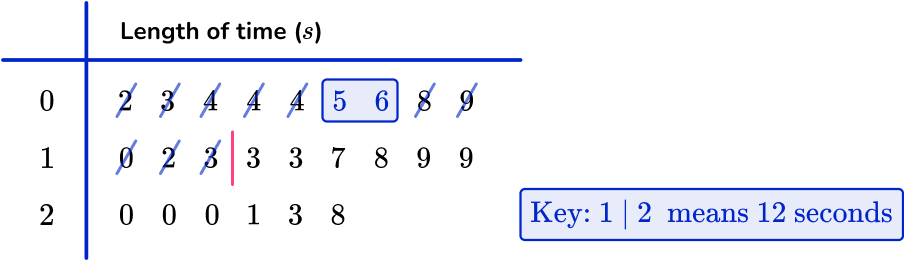
After using the key, the 6 th and 7 th of values are 5 and 6. The midpoint of these is 5.5, so the lower quartile is 5.5.
You can use the formula 3 \times \, \cfrac{n+1}{4} with n=24 to give
3 \times \cfrac{24+1}{4}=3 \times \cfrac{25}{4}=3 \times 6.25=18.75
Note that if you’ve already found that the lower quartile is the 6.25 th value, you can simply multiply 6.25 by 3 to get 18.75.
So the upper quartile lies between the 18 th and 19 th data point, and you use the midpoint of these values.
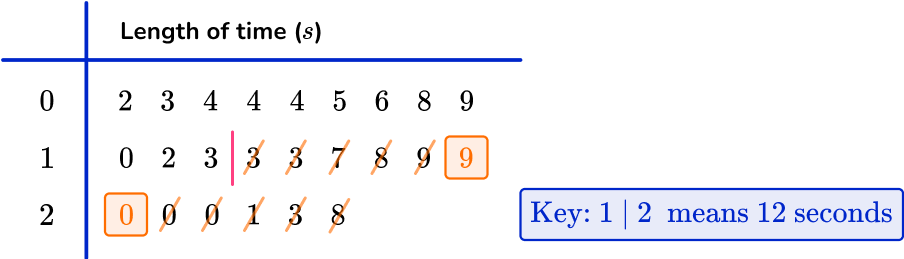
Using the key, the 18 th and 19 th values are 19 and 20 respectively. The midpoint of these is 19.5, so the upper quartile is 19.5.
As Q1=5.5 and Q3=19.5
IQR=Q3-Q1=19.5-5.5=14
Example 5: IQR from a five-number summary
Below is a table showing a summary of statistical values for a plant growth experiment.
| Lowest Value | 4.8 \, cm |
| Lower Quartile (Q1) | 5.4 \, cm |
| Median (M or Q2) | 8.6 \, cm |
| Upper Quartile (Q3) | 9.1 \, cm |
| Highest Value | 10.4 \, cm |
Determine the interquartile range of reaction times.
The lower quartile is the value Q1. Here Q1=5.4 \, cm.
The upper quartile is the value Q3. Here Q3=9.1 \, cm.
IQR=Q3-Q1=9.1-5.4=3.7 \, cm
Example 6: IQR from a box plot
The box plot below shows the distribution of the age of trees in a woodland.
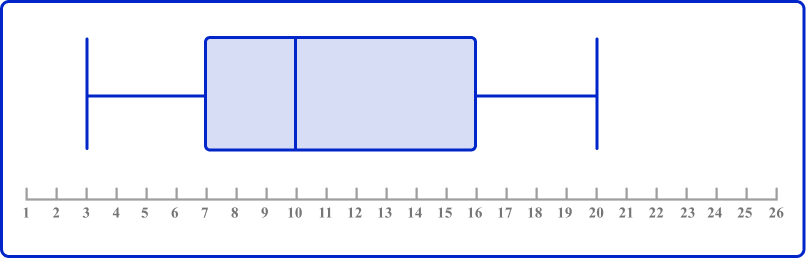
Calculate the interquartile range of ages of trees.
The lower quartile of a box plot is the left edge of the box within the box plot. This line is positioned above the value 7 on the scale and so,
Q1=7
The upper quartile of a box plot is the right edge of the box within the box plot. This line is positioned above the value 16 on the scale and so,
Q3=16
As Q3=16 and Q1=7,
IQR=Q3-Q1=16-7=9
Teaching tips for interquartile range
- Begin by explaining the basics of data and its representation using measures like mean, median, and range (each being a measure of central tendency). Then, introduce the interquartile range as a measure of variability that focuses on the middle 50 \% of the data.
- Provide ample opportunities for students to practice calculating interquartile range. Start with simple examples and gradually increase the complexity of the data sets as well as the number of data points as their proficiency improves.
- Incorporate technology tools such as spreadsheet software or online graphing calculators to facilitate data analysis and calculate the interquartile range. Students can even use an online interquartile range calculator. These tools can help students visualize and manipulate data more efficiently.
Easy mistakes to make
- Forgetting to order the data set before finding the median or quartiles
The list/data set must be in order from lowest value to highest value before you start finding the key values.
- Stating the quartile value as the number given by the formula, rather than counting and finding that value in the data
For example, for the data set 3, 4, 6, 7, 10, the formula for the lower quartile gives \cfrac{5+1}{4}=\cfrac{6}{4}=1.5. This tells you which data values to select (in this case, the midpoint of the 1 st and 2 nd values); do not just write Q1=1.5.
- The range is calculated instead of the interquartile range
The range is the smallest value subtracted from the largest value whereas the interquartile range is the lower quartile subtracted from the upper quartile.
Related representing data lessons
Practice interquartile range questions
1. Calculate the interquartile range for the following list of values.
![]()


Find the lower quartile (Q1) and the upper quartile (Q3). Then subtract the lower quartile from the upper quartile to get the IQR.
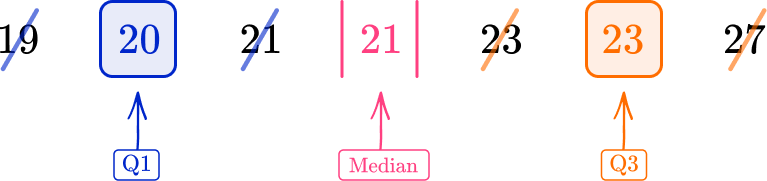
Q1=20, \, Q3=23
IQR=Q3-Q1=23-20=3
2. Find the interquartile range for the data set.
![]()
Find the lower quartile (Q1) and the upper quartile (Q3). Then subtract the lower quartile from the upper quartile to get the IQR.
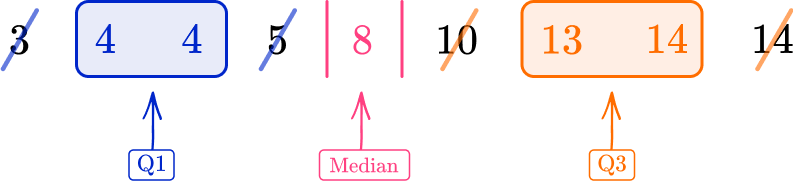
Q1=4, \, Q3=13.5
IQR=Q3-Q1=13.5-4=9.5
3. Find the interquartile range.
![]()
First, you need to order the data from lowest value to highest value:
6, 12, 14, 15, 19, 21, 23, 33, 45
Then, find the lower quartile (Q1) and the upper quartile (Q3). Finally, subtract the lower quartile from the upper quartile to get the IQR.
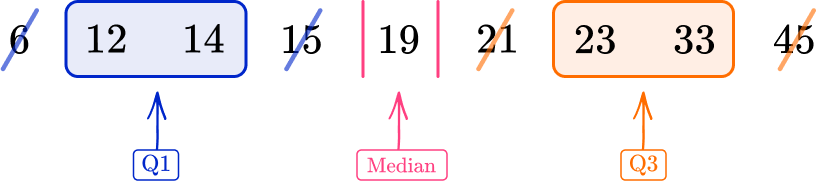
Q1=13, \, Q3=28
IQR=Q3-Q1=28-13=15
4. This table shows the shoe sizes of 18 boys. Calculate the interquartile range for the data.
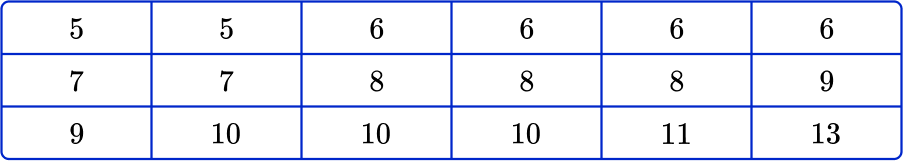
Find the lower quartile (Q1) and the upper quartile (Q3). Then subtract the lower quartile from the upper quartile to get the IQR.
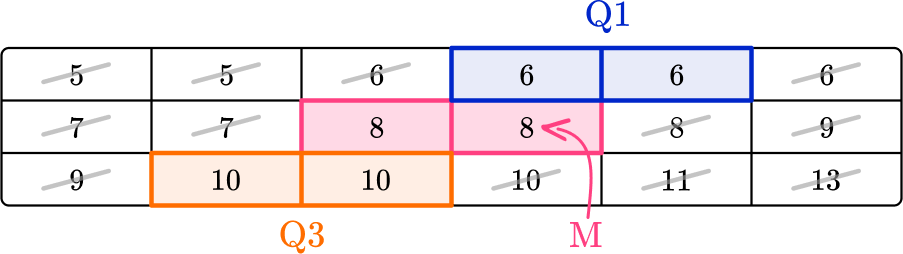
Q1=6, \, Q3=10
IQR=Q3-Q1=10-6=4
5. This table shows the five-number summary for a set of data.
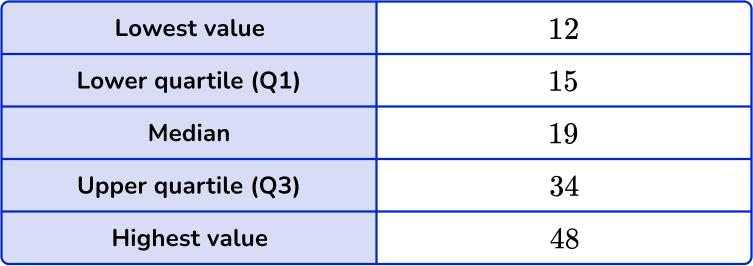
Calculate the interquartile range.
Find the lower quartile (Q1) and the upper quartile (Q3). Then subtract the lower quartile from the upper quartile to get the IQR.
Q1=15, \, Q3=34 and then 34-15=19
6. This table shows some descriptive statistics for a set of data.
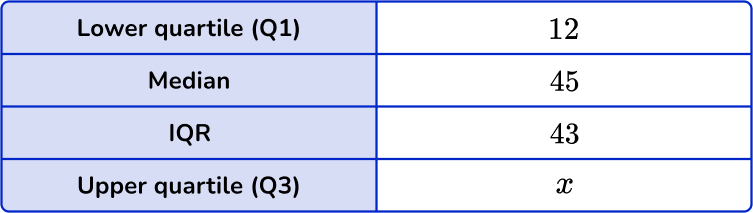
Calculate the value for the upper quartile, x.
Q1=12 and IQR=43.
To calculate the Q3, you add the interquartile range to the value for the lower quartile:
x=Q1+IQR=12+43=55.
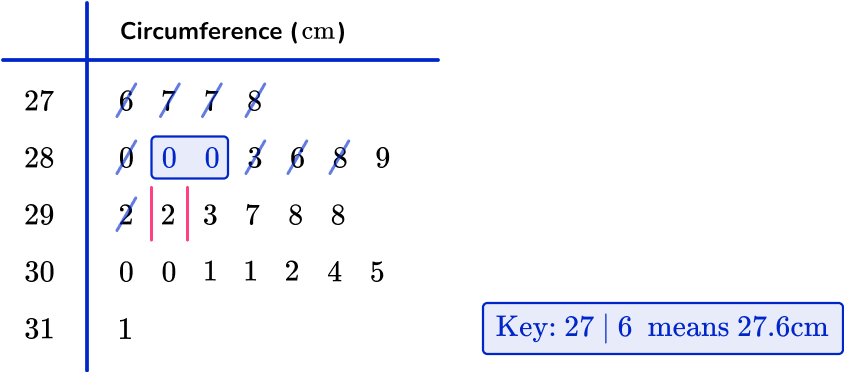
7. Data was collected about the circumference of apples in an orchard. The data was sorted into the stem and leaf diagram below.
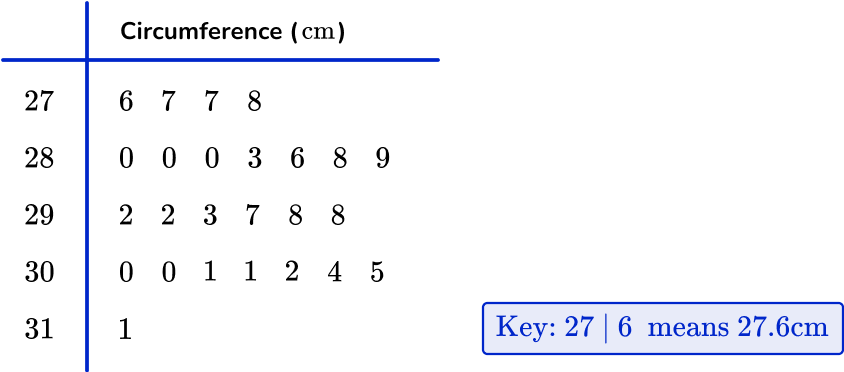
Calculate the interquartile range of circumferences of apples within the orchard.
There are 25 apples in the data set.
The median for an odd number of data values is found in the position \cfrac{n+1}{2}.
As n=25, the median is in the 13 th position and so the value for the median is 29.2 \, cm.
The lower quartile is the middle value of the lower half of the data, excluding the median value (29.2 \, cm). Here, the lower quartile is between the two values 28.0 \, cm and 28.0 \, cm and so the lower quartile is 28.0 \, cm.
The upper quartile is the middle of the upper half of the data, excluding the median. Here the upper quartile is halfway between 30.0 \, cm and 30.1 \, cm which is equal to 30.05 \, cm.
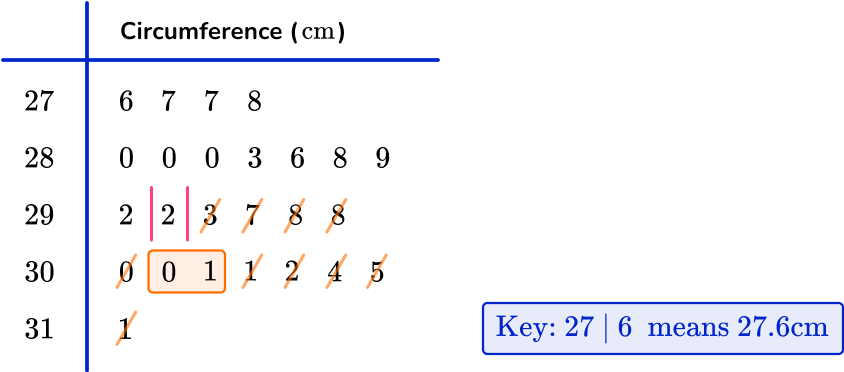
As IQR=Q3-Q1,
IQR=30.05-28.0=2.05 \, cm.
Interquartile range FAQs
The interquartile range (IQR) is a measure of the spread or range of values in a dataset. It represents the difference between the upper quartile ( 75 th percentile) and the lower quartile ( 25 th percentile). It shows the range of values that fall within the middle 50 \% of the data.
To find the interquartile range (IQR) of a data set, subtract the lower quartile (Q1) from the upper quartile (Q3).
Outliers can change the interquartile range (IQR) by making it larger or smaller. This happens because outliers can shift the upper and lower quartiles, which are used to calculate the IQR. However, the IQR is less affected by outliers compared to other measures of spread.
The next lessons are
- Frequency table
- Frequency graph
- Sampling methods
- Ratio and proportion
- Represent and interpret data
Still stuck?
At Third Space Learning, we specialize in helping teachers and school leaders to provide personalized math support for more of their students through high-quality, online one-on-one math tutoring delivered by subject experts.
Each week, our tutors support thousands of students who are at risk of not meeting their grade-level expectations, and help accelerate their progress and boost their confidence.

Find out how we can help your students achieve success with our math tutoring programs.
[FREE] Common Core Practice Tests (3rd to 8th Grade)
Prepare for math tests in your state with these 3rd Grade to 8th Grade practice assessments for Common Core and state equivalents.
Get your 6 multiple choice practice tests with detailed answers to support test prep, created by US math teachers for US math teachers!