Here you will learn about the measures of central tendency, which is the mean, median and mode of data sets, including what they are and how to find them.
Students first learn about measures of central tendency in the 6 th grade and expand this knowledge as they move through middle school and high school statistics.
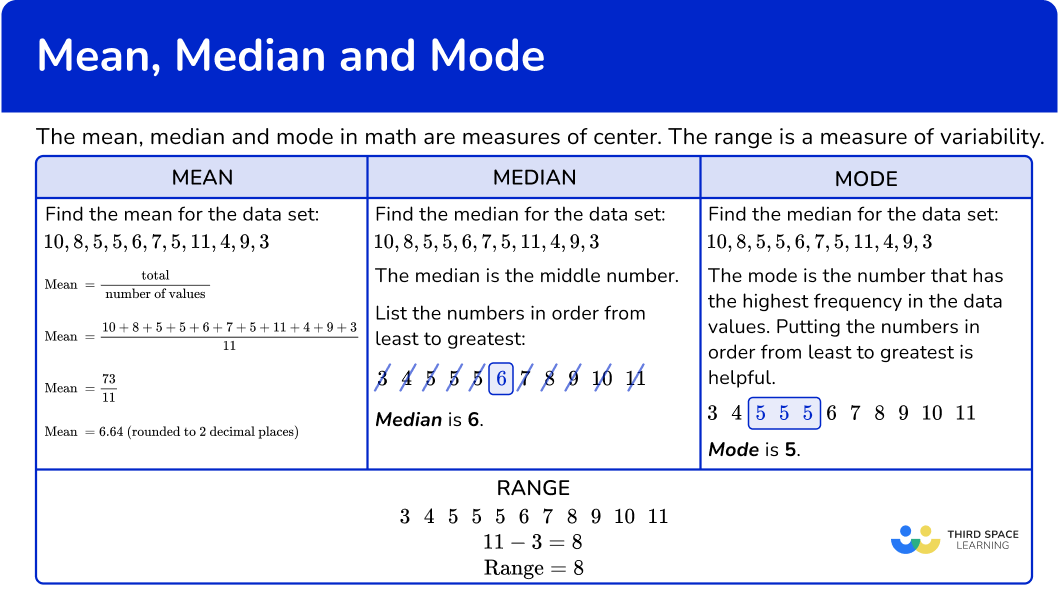
What is mean median mode?
The mean, median and mode are different measures of center of a numerical data set. They are a way of summarizing a data set with a single number.
[FREE] Mean Median Mode Worksheet (Grade 6)
Use this worksheet to check your 6th grade students’ understanding of mean, median, mode. 15 questions with answers to identify areas of strength and support!
Use this worksheet to check your 6th grade students’ understanding of mean, median, mode. 15 questions with answers to identify areas of strength and support!
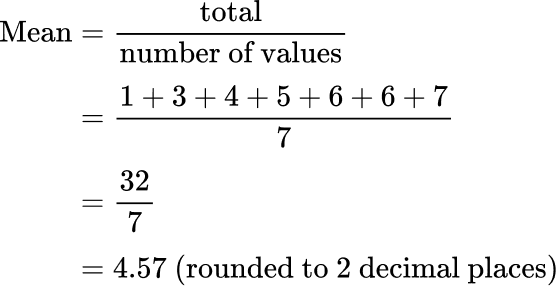
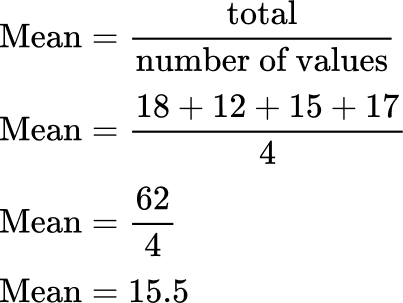
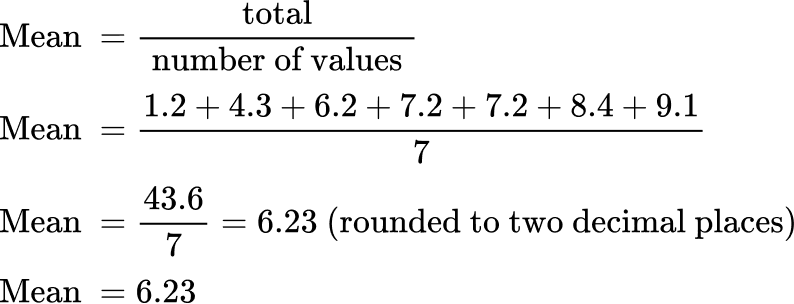
To calculate the mean, find the total of the values and divide the total by the number of values.
The “number of values” is sometimes referred to as the “number of numbers”.
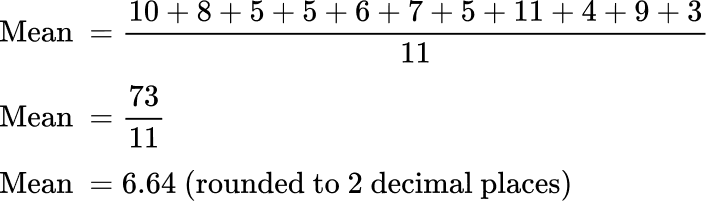
Let’s find the mean of this data set.
The mean is 4.57 (rounded to 2 decimal places)
Median
The median is the middle number of a numerical data set.
To find the median, we need to arrange the values in numerical order, from the smallest value to the highest value, and find the middle value.
The middle value is the median value.
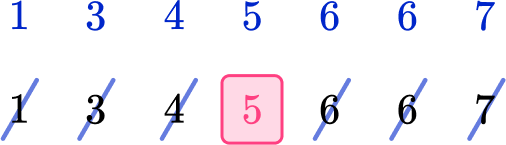
Let’s find the median of the same data set.
The median is 5 because it is the middle number of data points.
Mode
The mode is the most common number. To find the mode, we need to find the value in the data set that occurs the most number of times.
Let’s find the mode of the data set.
The number that occurs the most or is most frequent is 6.
The mode is 6.
Range
The range is the difference between the greatest value and the least value of a data set. It is a measure of variability not a measure of center.
Let’s find the range of the data set.
7 - 1 = 6
The range is 6.
What is mean median mode?
Common Core State Standards
How does this apply to 6 th grade math?
Grade 6 – Statistics and Probability 6.SP.A.3 Recognize that a measure of center for a numerical data set summarizes all of its values with a single number, while a measure of variation describes how its values vary with a single number.
Grade 6 – Statistics and Probability 6.SP.A2 Understand that a set of data collected to answer a statistical question has a distribution which can be described by its center, spread, and overall shape.
Grade 6 – Statistics and Probability 6.SP.B.5c Giving quantitative measures of center (median and/or mean) and variability (interquartile range and/or mean absolute deviation), as well as describing any overall pattern and any striking deviations from the overall pattern with reference to the context in which the data were gathered.
How to find the mean median mode
In order to find the mean, median or mode:
List the numbers in order from least to greatest.
To find the mean, find the total of the numbers in the data set and divide by the number of values in the data set.
To find the median, find value(s) in the middle of the data set.
To find the mode, look for the value(s) that occur the most; there may be more than one mode.
To find the range, find the difference between the largest value and the smallest value.
Mean median mode examples
Example 1: finding the mode
Find the mode for the given data set.
List the numbers in order from least to greatest.
4To find the mode, look for the value(s) that occur the most; there may be more than one mode.
7 occurs the most, so the mode is 7.
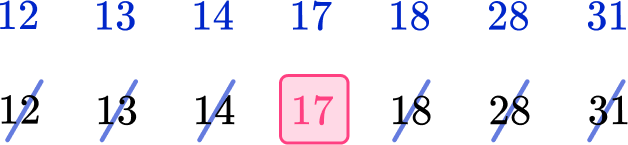
Example 2: finding the median
Find the median for the given data set.
The value in the middle is 9. The median is 9.
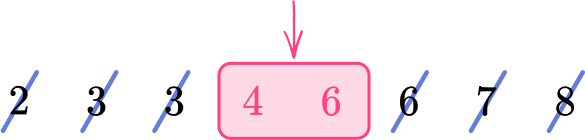
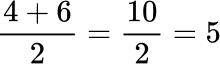
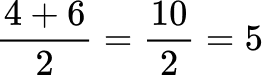
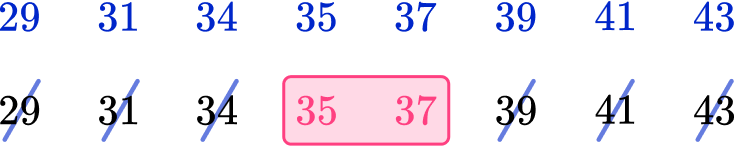
Example 3: finding the median
Find the median of the given data set.
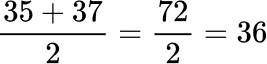
Find the middle of the data set. There is an even number of values, so we have a middle pair. To find the median, find the average of the two middle numbers or the midpoint of 4 and 6.
The average of 4 and 6 or the midpoint between 4 and 6 is 5. So, the median is 5.
Example 4: finding the mean
Find the mean of the given data set.
Although not necessary, it can be helpful to put the values in order.
The mean is 7.6.
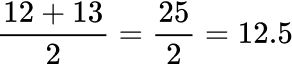
Example 5: finding the mean, median, and mode
Find the mean, median, and mode of the data set.
The mean is 13.
There are an even number of data points in the data set, so there are two values in the middle, 12 and 13. To find the median, find the average of the two numbers of the midpoint.
The median is 12.5.
12 is the value that occurs the most which means it is the mode.
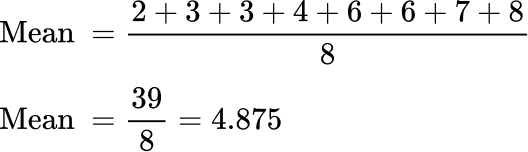
Example 6: finding the mean, median, mode, and range
Find the mean, median, and mode of the data set.
The mean is 4.875.
There are an even amount of values in the data set, 4 and 6 are in the middle. To find the median find the average of 4 and 6 or find the midpoint of 4 and 6.
The median is 5.
3 and 6 both occur twice, so there are two modes, 3 and 6. Since there are two modes, the data is bimodal.
The modes are 3 and 6.
8 - 2 = 6
The range is 6.
Teaching tips for mean, median, mode
Incorporate project based data science learning activities where students have opportunity to collect their own data, as well as do data analysis/statistical analysis on the collected data.
Although worksheets and paper-based quizzes have their place, consider alternate forms of formative assessments that engage students to gain a global perspective by having them summarize data in real time with real world data points.
Easy mistakes to make
Mixing up the measures of center For example, if a student is asked to find the median and they find the mean.
Listing the numbers in descending order instead of ascending order When summarizing data, the best way to list the data is in ascending order (from least to greatest) not descending order (greatest to least).
Thinking that the mean and median have to be a whole number When summarizing data, the mean and median do not necessarily have to be whole numbers. For example, for this data set, the mean is not a whole number.
At Third Space Learning, we specialize in helping teachers and school leaders to provide personalized math support for more of their students through high-quality, online one-on-one math tutoring delivered by subject experts.
Each week, our tutors support thousands of students who are at risk of not meeting their grade-level expectations, and help accelerate their progress and boost their confidence.
We use essential and non-essential cookies to improve the experience on our website. Please read our Cookies Policy for information on how we use cookies and how to manage or change your cookie settings.Accept
Privacy & Cookies Policy
Privacy Overview
This website uses cookies to improve your experience while you navigate through the website. Out of these, the cookies that are categorized as necessary are stored on your browser as they are essential for the working of basic functionalities of the website. We also use third-party cookies that help us analyze and understand how you use this website. These cookies will be stored in your browser only with your consent. You also have the option to opt-out of these cookies. But opting out of some of these cookies may affect your browsing experience.
Necessary cookies are absolutely essential for the website to function properly. This category only includes cookies that ensures basic functionalities and security features of the website. These cookies do not store any personal information.
Any cookies that may not be particularly necessary for the website to function and is used specifically to collect user personal data via analytics, ads, other embedded contents are termed as non-necessary cookies. It is mandatory to procure user consent prior to running these cookies on your website.
![[FREE] Mean Median Mode Worksheet (Grade 6)](https://thirdspacelearning.com/wp-content/uploads/2025/01/Mean-Median-Mode-Worksheet-listing-image.png)