High Impact Tutoring Built By Math Experts
Personalized standards-aligned one-on-one math tutoring for schools and districts
In order to access this I need to be confident with:
Frequency table Mean from frequency table Grouped frequency tableCumulative frequency
Here you will learn about cumulative frequency, including how to complete a cumulative frequency table as well as how to create and interpret cumulative frequency graphs.
Students first learn about cumulative frequency in middle school and expand their knowledge in high school statistics.
What is cumulative frequency?
Cumulative frequency is the running total of frequencies in a frequency distribution.
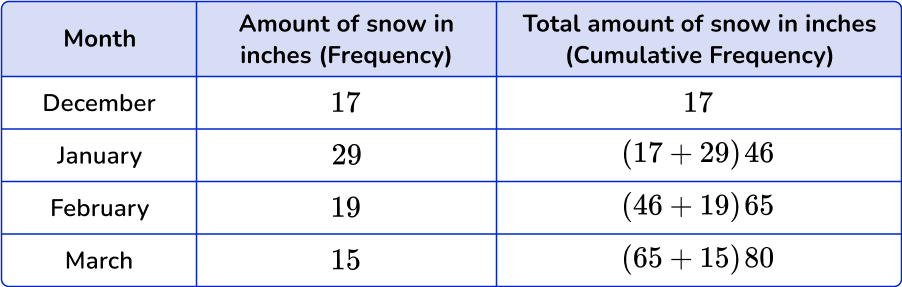
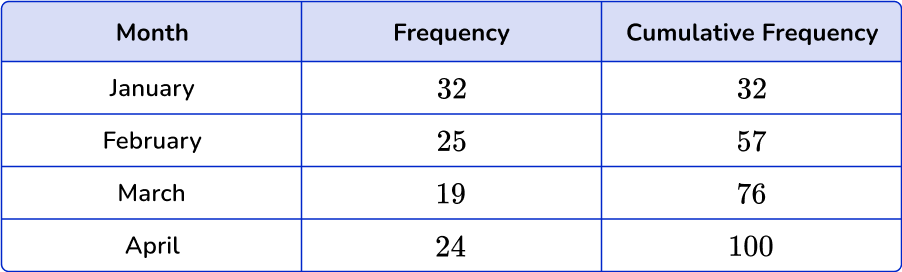
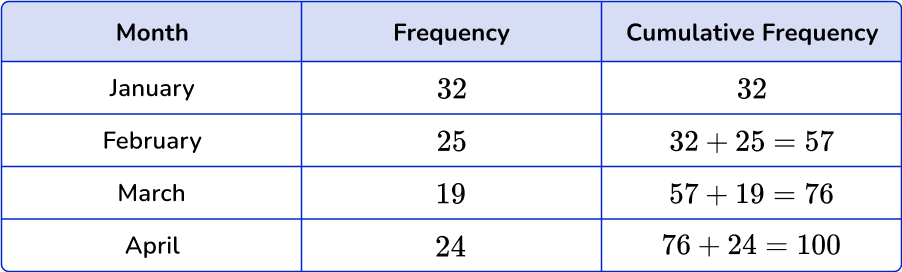
For example, the frequency distribution table below shows the individual frequencies for each month and the cumulative frequencies for each month. The frequency table shows the amount of snow that fell in Yellowstone, Montana in the months of December, January, February, and March.
Notice how the cumulative frequency is found by totaling the frequency from one class to the next.
Cumulative frequency graphs (or cumulative frequency diagrams) are useful when representing or analyzing a cumulative frequency distribution of large grouped data sets. Cumulative frequency graphs are called ogive graphs.
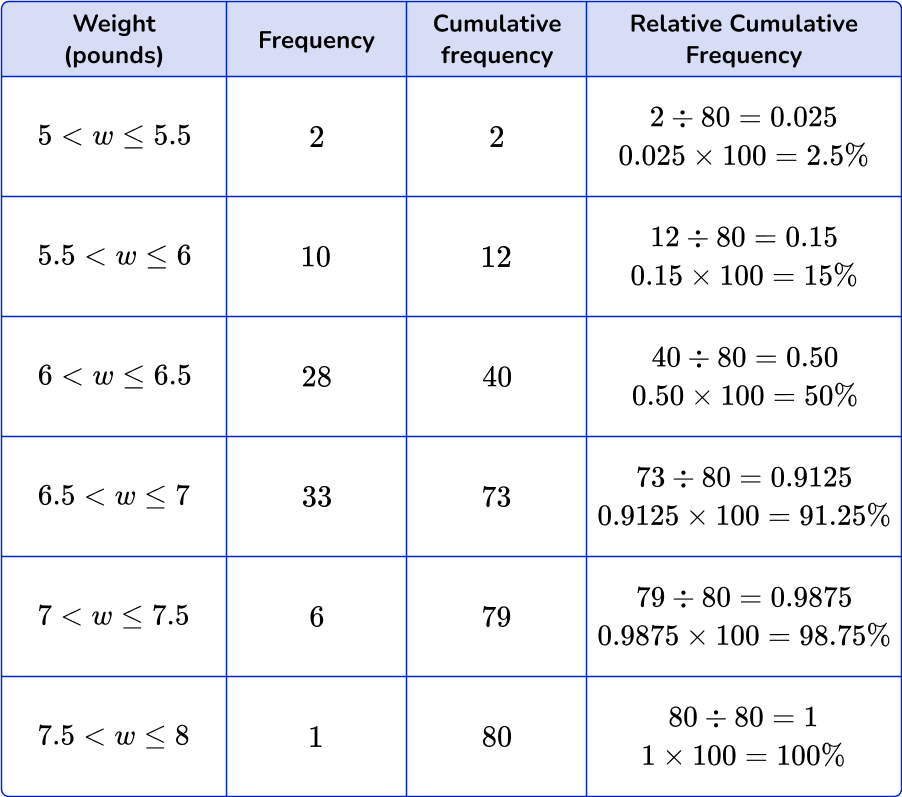
You can also find the relative cumulative frequency from the frequency distribution table by dividing the cumulative frequency of each interval by the total number of observations and then converting it to a percent.
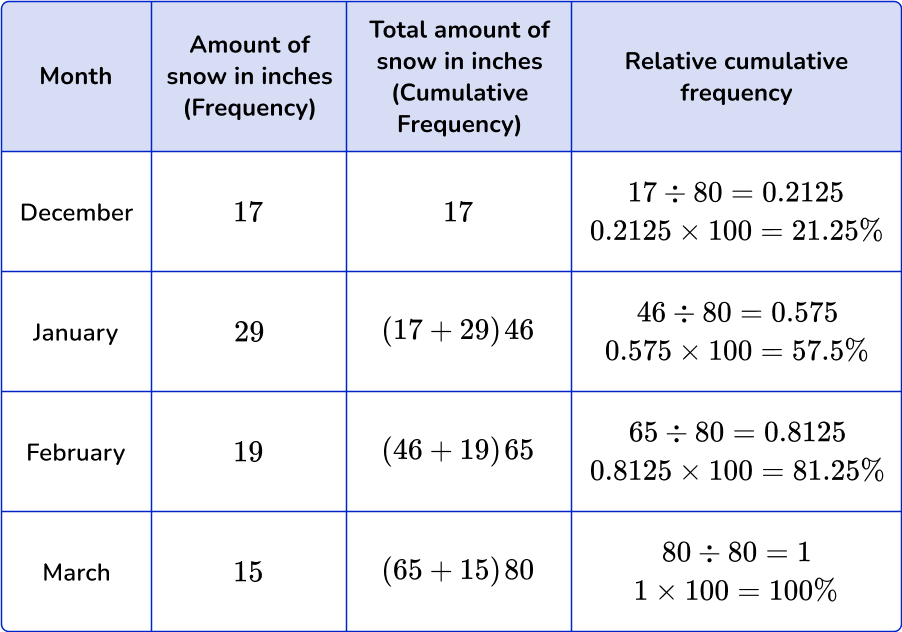
Notice how the relative cumulative frequencies get larger from row to row and end with 100 \%.
Let’s look at another example.
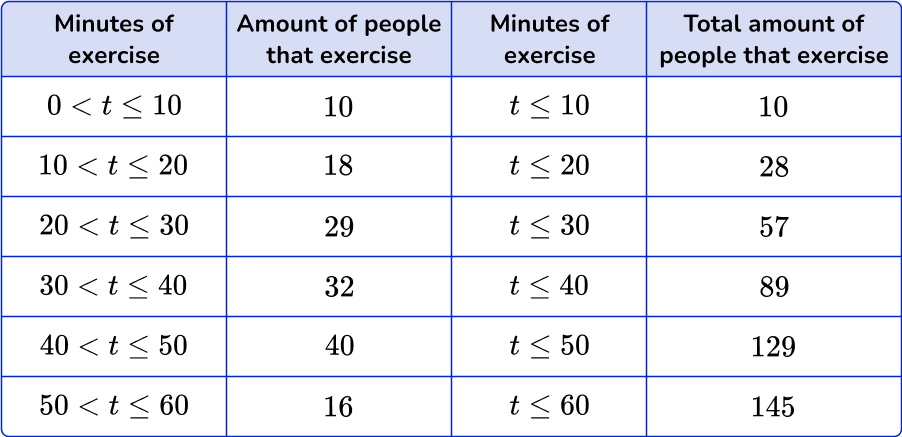
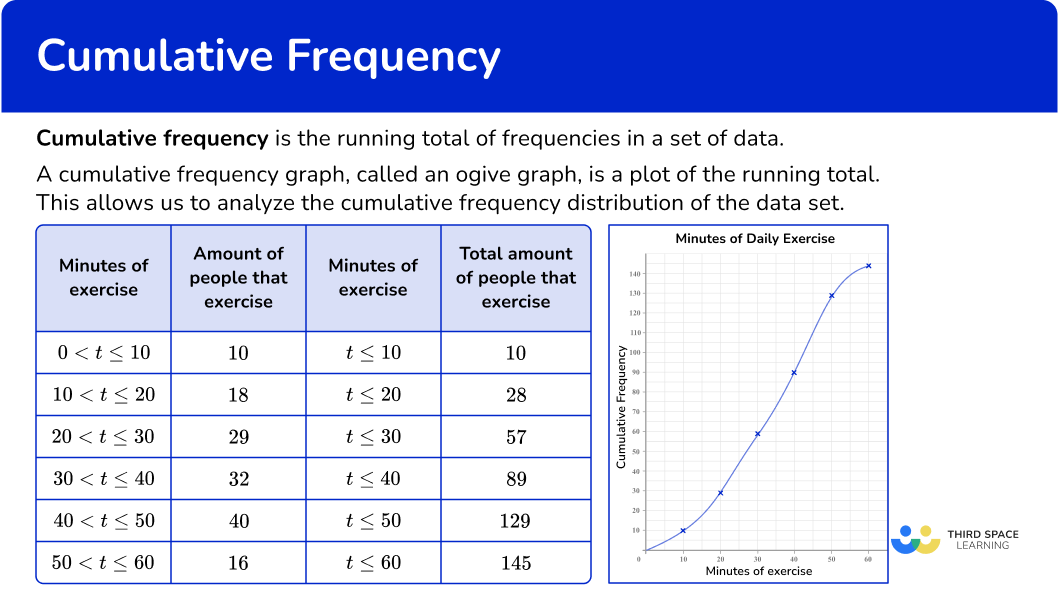
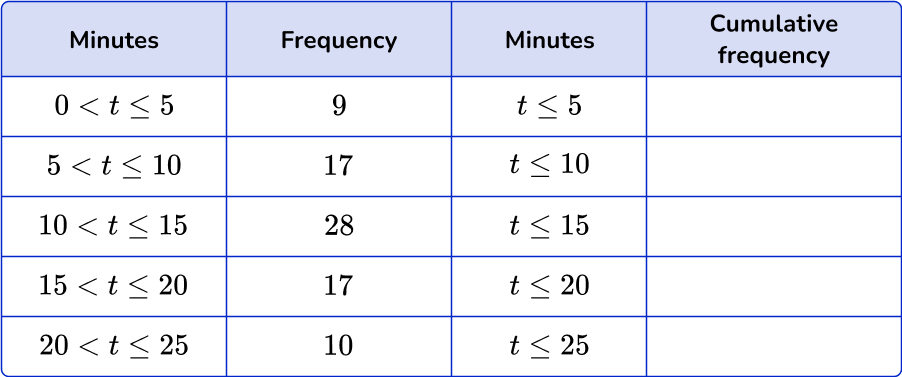
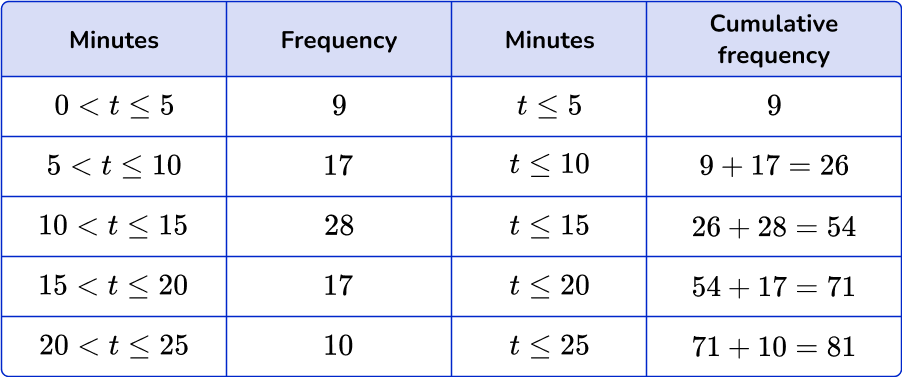
145 people were randomly surveyed about the amount of minutes they exercise daily. The frequency distribution table below gives the frequency and the cumulative frequency.
Notice how the class intervals for the cumulative frequencies have class limits (an upper limit and lower limit). This is because cumulative frequency is a running total.
Let’s create a cumulative frequency graph from this table. When creating the graph, the horizontal access is marked with the upper class boundary on a continuous scale. The vertical axis of a cumulative frequency graph is always labeled cumulative frequency.
The points that are plotted on the cumulative frequency graph are:
(10, 10), (20, 28), (30, 57), (40, 89), (50, 129), (60, 145) → The x coordinate is the upper bound of the interval and the y coordinate is the cumulative frequency.
![[FREE] Cumulative Frequency and Frequency Table Worksheet (Grades 1 to 8)](https://thirdspacelearning.com/wp-content/uploads/2023/10/common-core-practice-tests.png)
[FREE] Cumulative Frequency and Frequency Table Worksheet (Grades 1 to 8)
Check your grade 1 to 8 students’ understanding of frequency table and cumulative frequency. Includes 15 questions with answers to identify areas of strength and support!
DOWNLOAD FREE [FREE] Cumulative Frequency and Frequency Table Worksheet (Grades 1 to 8)
Check your grade 1 to 8 students’ understanding of frequency table and cumulative frequency. Includes 15 questions with answers to identify areas of strength and support!
DOWNLOAD FREEMinutes of daily exercise
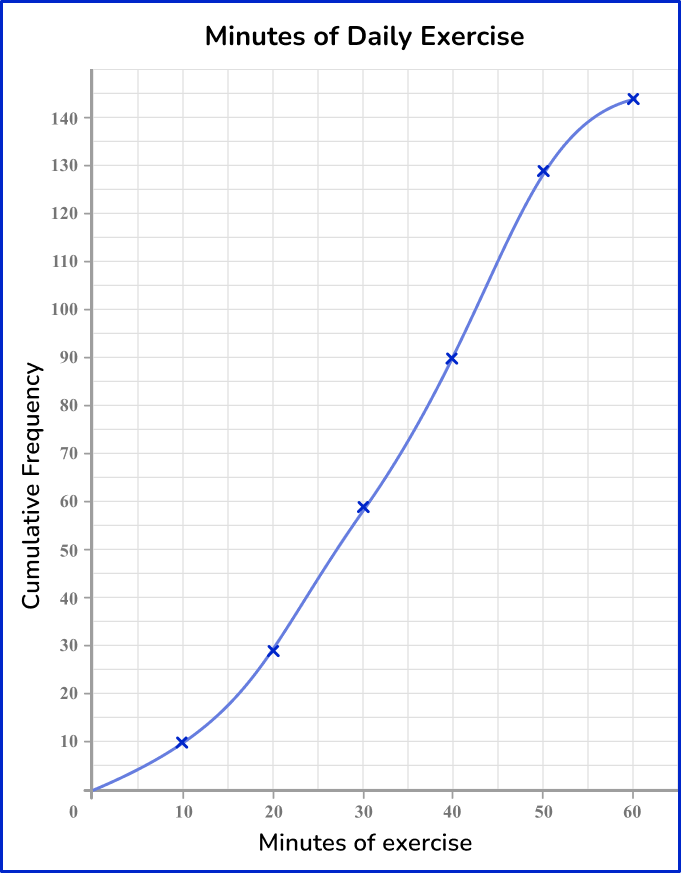
In many cases, a cumulative frequency curve has a distinctive ‘s-shape’, like the one above.
This is because the majority of data is usually located in the middle class intervals, with fewer items of data at the furthest values in the range of the data set. You should not assume this for all cumulative frequency diagrams.
What is cumulative frequency?
Common Core State Standards
How does this relate to 6 th grade and 7 th grade math?
- Grade 6 – Statistics and Probability (6.SP.B.4)
Display numerical data in plots on a number line, including dot plots, histograms, and box plots.
- Grade 6 – Statistics and Probability (6.SP.B.5)
Summarize numerical data sets in relation to their context.
- Grade 6 – Ratios and Proportional Relationships (6.RP.A.3c)
Find a percent of a quantity as a rate per 100 (example, 30 \% of a quantity means \cfrac{30}{100} times the quantity); solve problems involving finding the whole, given a part and the percent.
- Grade 7 – Ratio and Proportional Relationships (7.RP.A.3)
Use proportional relationships to solve multistep ratio and percent problems. Examples: simple interest, tax, markups and markdowns, gratuities and commi
How to complete a cumulative frequency table
In order to draw a cumulative frequency table:
- Start at row \bf{1} , enter the frequency.
- Go to row \bf{2} , add the frequency of row \bf{1} to the frequency of row \bf{2} .
- Continue in the pattern until the table is complete.
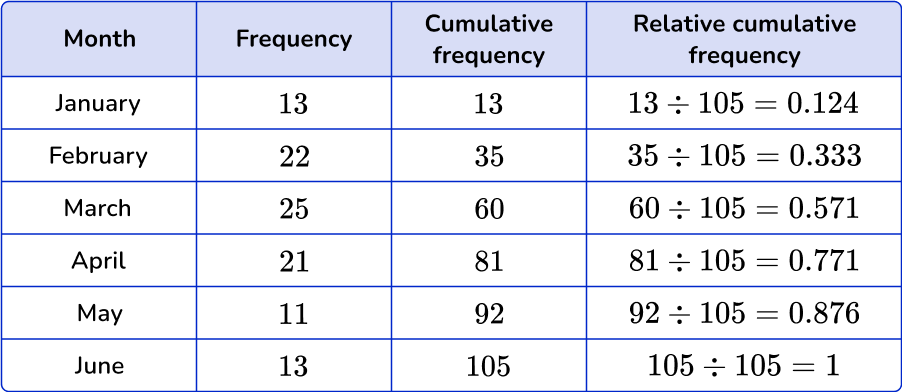
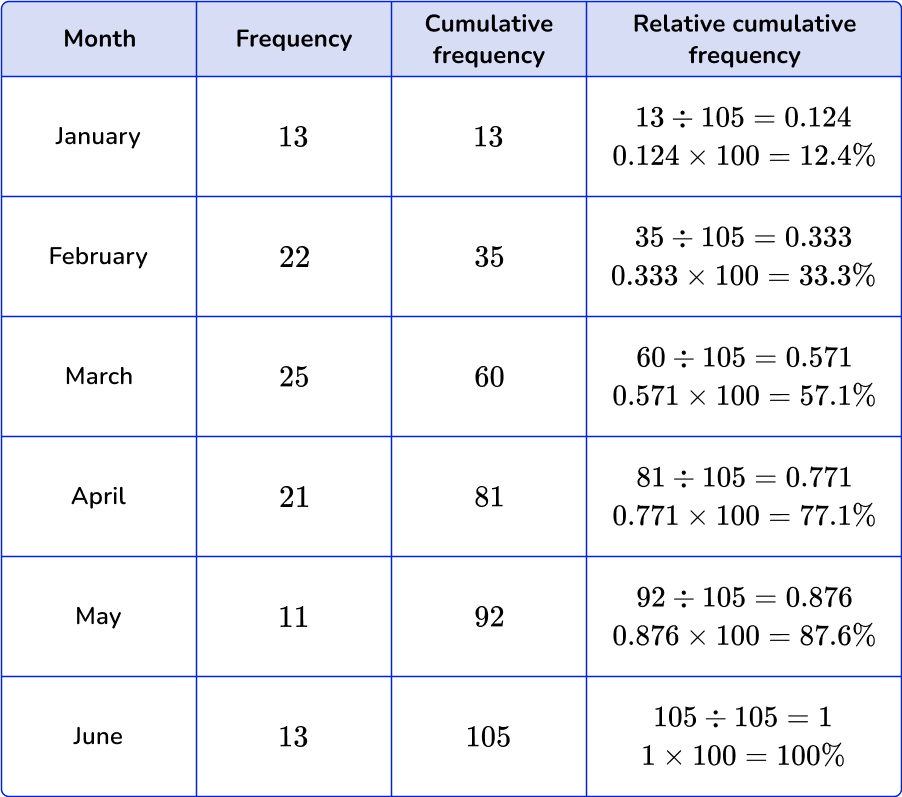
How to calculate relative cumulative frequency
In order to calculate relative cumulative frequency:
- Take the cumulative frequency for each class and divide it by the total observations.
- Convert the decimal answer to a percent.
Cumulative frequency examples
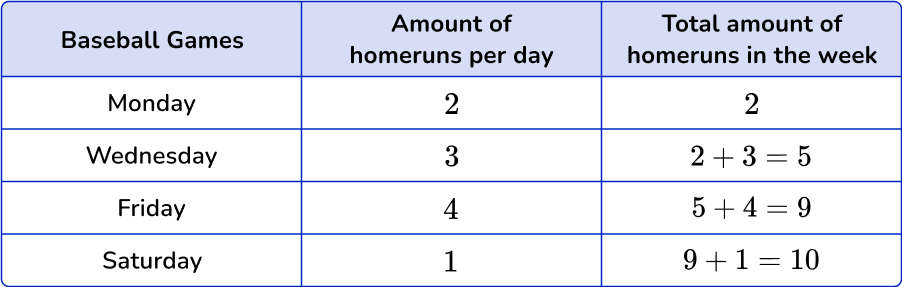
Example 1: cumulative frequency table
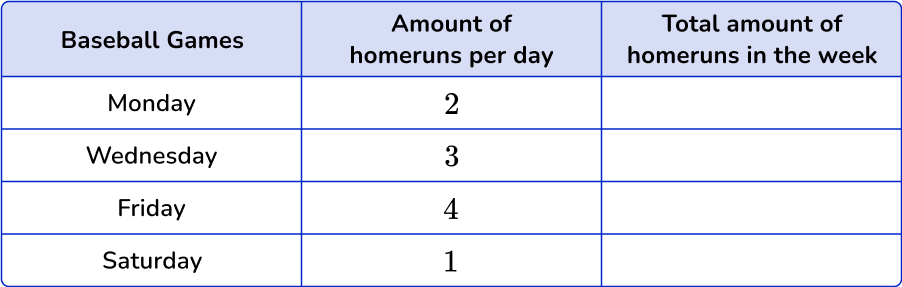
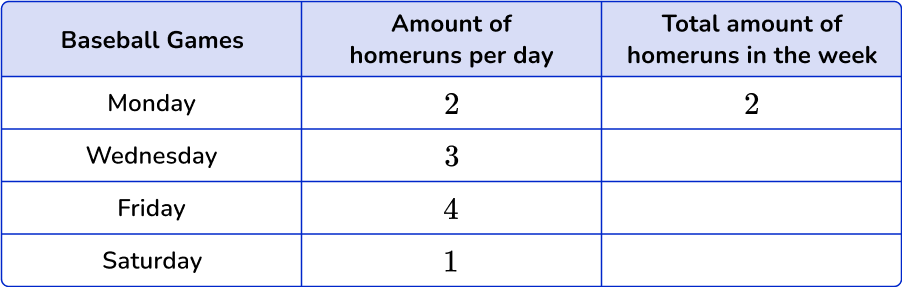
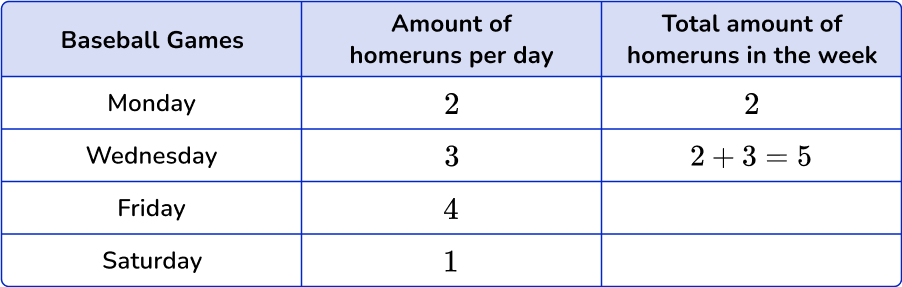
Complete the cumulative frequency table on the total number of homeruns for the local baseball team in the week.
- Start at row \bf{1} , enter the frequency.
2Go to row \bf{2} , add the frequency of row \bf{1} to the frequency of row \bf{2} .
3Continue in the pattern until the table is complete.
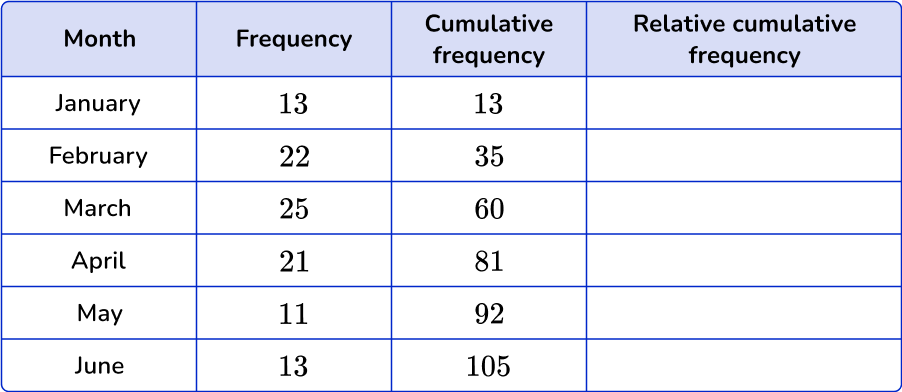
Example 2: relative cumulative frequency
A car dealership is tracking the amount of cars they sold for the first half of the year. Complete the frequency table to include the relative cumulative frequency.
Example 3: cumulative frequency table
The table shows the time people had to wait in line to ride the new rollercoaster at the amusement park. Complete the cumulative frequency table.

Notice how the intervals on the cumulative frequency table do not include a lower bound. This is because there is no lower bound on when totaling frequencies.
How to create a cumulative frequency graph
In order to create a cumulative frequency graph:
- Calculate the cumulative frequency values for the data set.
- Draw a set of axes with suitable labels.
- Plot each value at the end of the interval.
- Join the points with a smooth curved line.
- Add a title to the cumulative frequency graph.
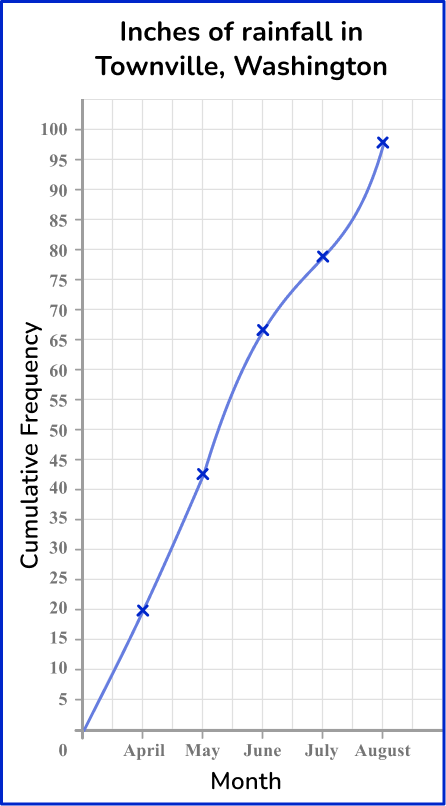
Example 4: creating a cumulative frequency graph
The table shows the amount of rainfall in inches in Townville, Washington. Make a cumulative frequency graph from the table.
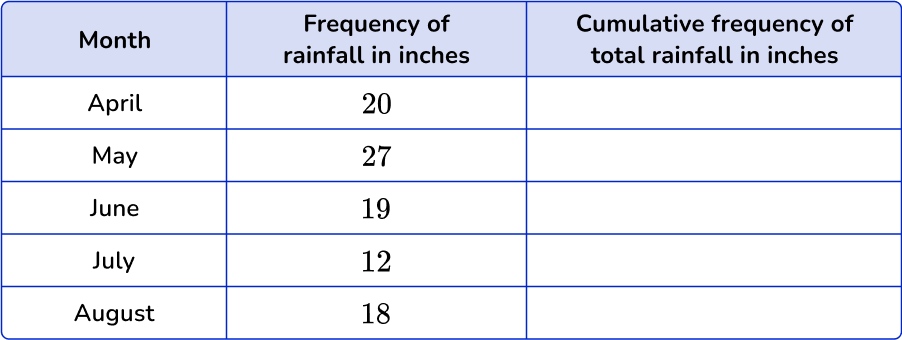
The vertical axis ( y -axis) is the cumulative frequency. The horizontal axis ( x -axis) is the months.
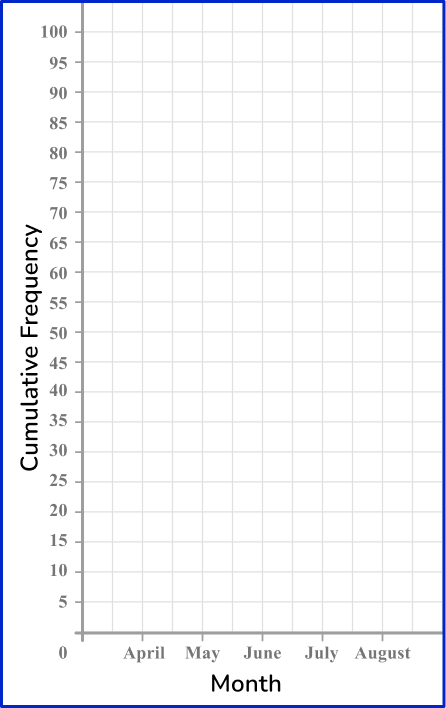
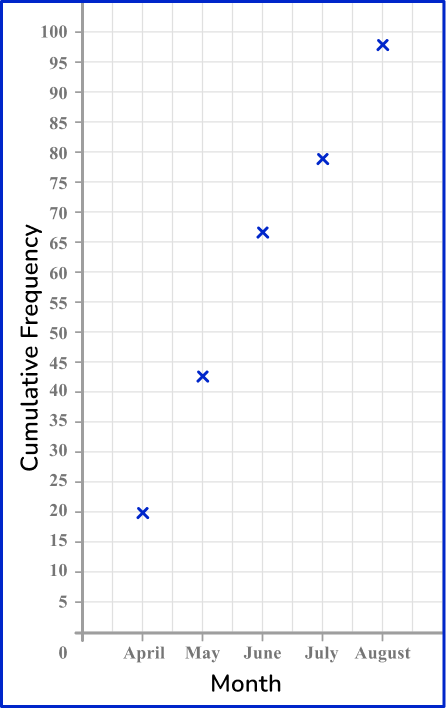
Inches of rainfall in Townville, Washington.
Example 5: drawing a cumulative frequency graph
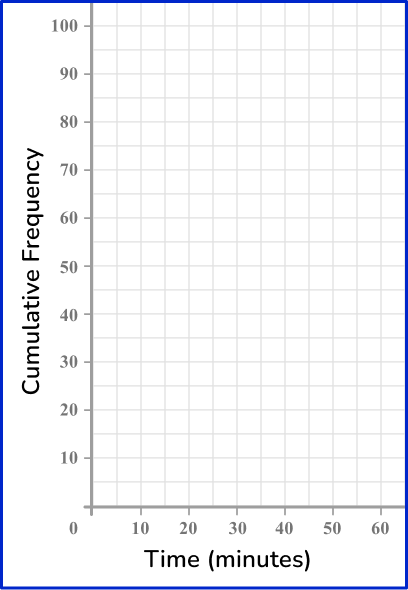
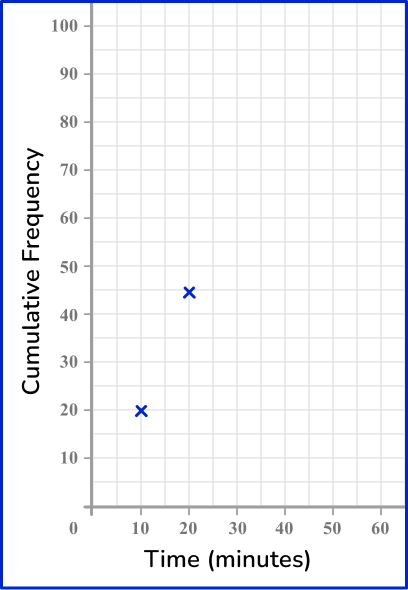
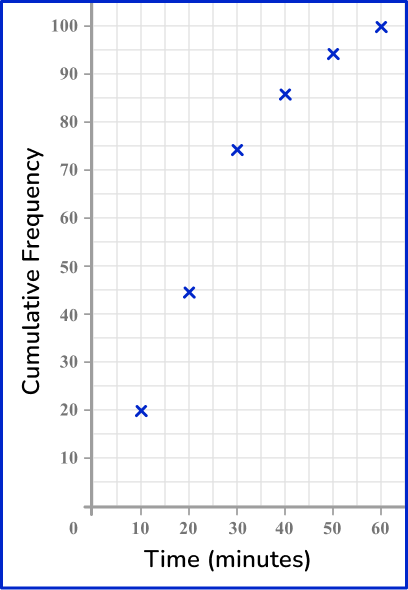
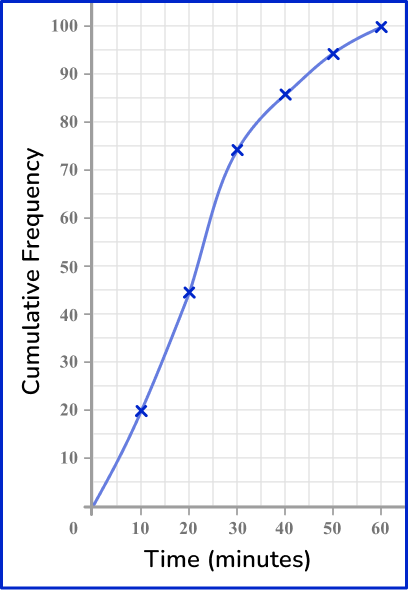
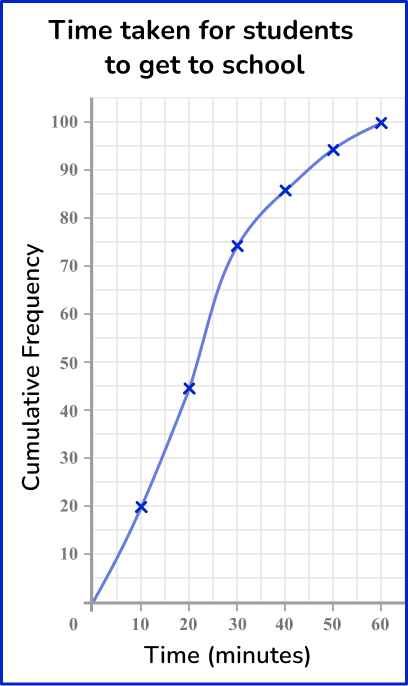
This table shows the time (in minutes) that 100 students take to get to school.
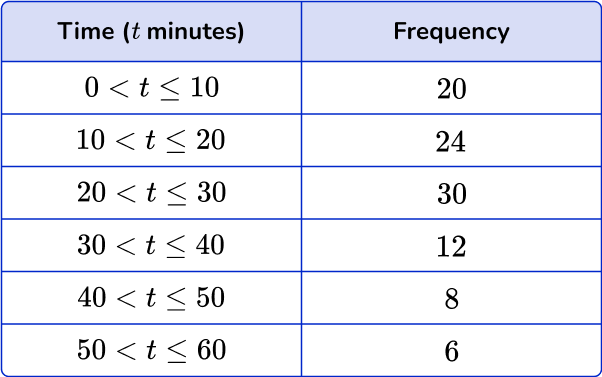
Draw a cumulative frequency graph to represent this distribution.
The cumulative frequency is the running total for the data. Follow the steps from above.
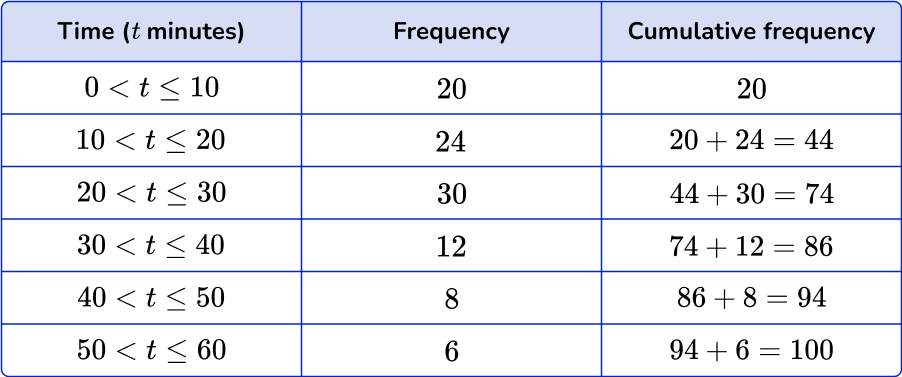
The horizontal x -axis is time in minutes, so you should label this axis from 0 to 60.
Cumulative frequency is on the vertical y -axis, and so label this axis from 0 to 100.
Since you know the total frequency at the end of the interval, plot the cumulative frequency at the upper class boundary.
For the interval 0 < t \leq 10 with a cumulative frequency of 20, plot the coordinate (10,20).

For the next interval, plot the coordinate (20,44).
Continuing this for all the remaining intervals, and you get the following plot.
The line must be continuous and go through each point of the cumulative frequency.
As the initial frequency is 0, the curve must start at (0,0).
Example 6: drawing a cumulative frequency graph with an axis break
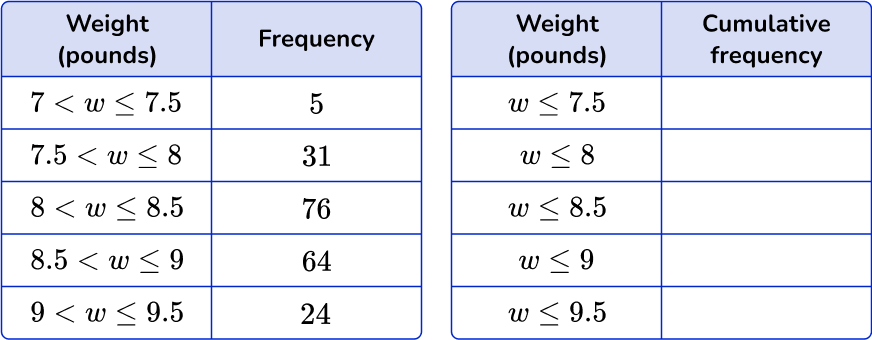
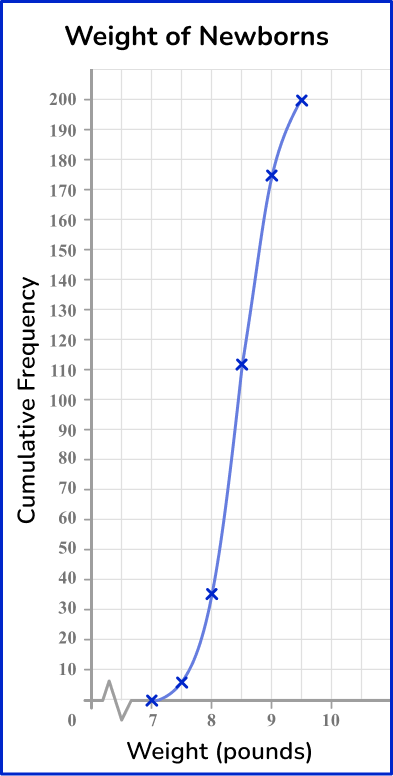
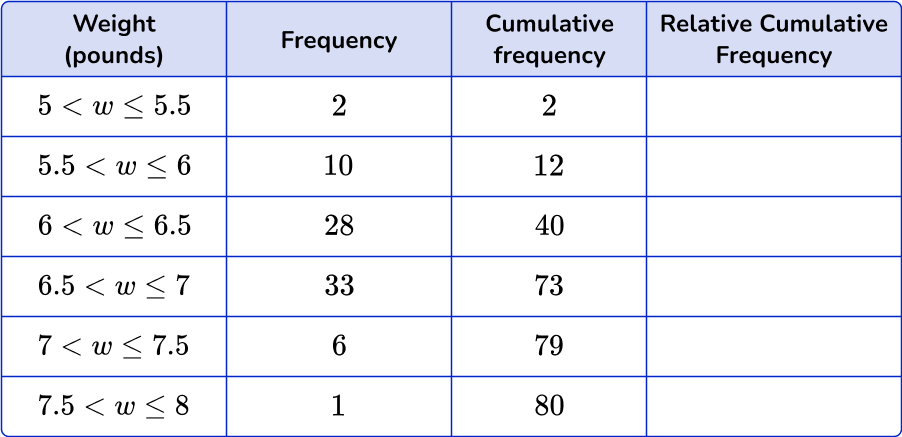
The frequency tables below show the birth weights (pounds) of 200 babies.
Draw a cumulative frequency graph to represent this distribution.
The first table shows the frequency of each class interval as the weight w has an upper and lower boundary. Like in the example 3, the second table above shows the cumulative frequency.
The inequalities do not contain a lower bound because it includes all frequencies up to that weight.
The cumulative frequency for the first interval is 5.
The cumulative frequency for the second interval is 5+31=36, and so on.
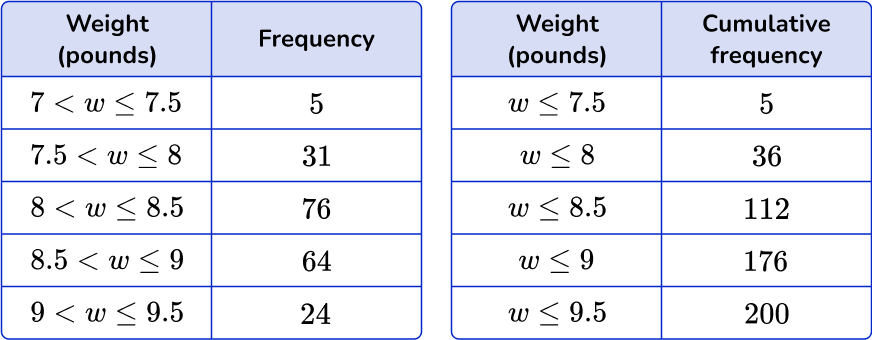
Again, the final cumulative frequency value is 200, which matches the frequency in the question.
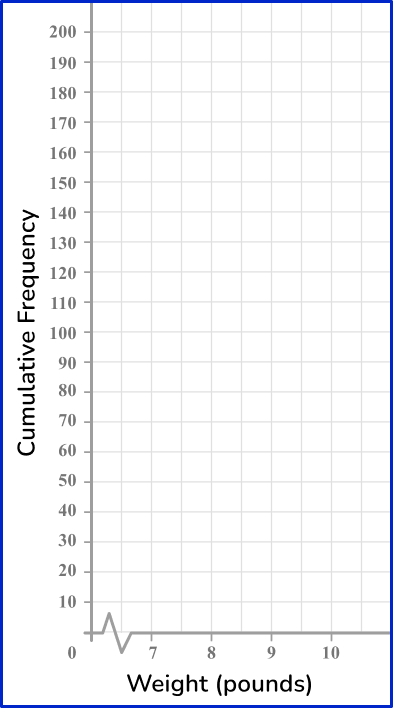
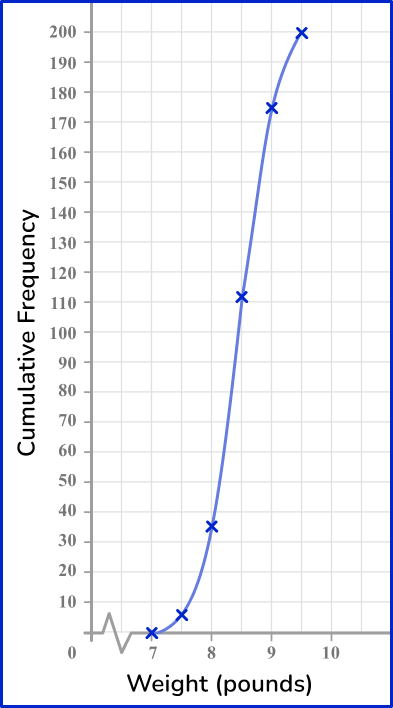
The horizontal axis values have a range of 7 to 9.5. If you started the axis at 0, there would be a lot of blank space before the cumulative frequency curve begins.
So, draw a break (a zigzag line) in the axis to compress the space that does not contain values, and write 7 as the first value after the break on the axis.
The vertical axis is the cumulative frequency. This axis must start at 0 and does not contain a break. The total frequency is 200 and so we can label the vertical axis from 0 to 200 in equal steps of 20.
Starting with the first row, the first point to be plotted is (7.5, 5). For this particular graph, find 7.5 on the horizontal axis and then 5 on the vertical axis and plot the point.
Next, move to the second row which is (8, 31). Use the same process, find 8 on the horizontal axis and then 31 on the vertical axis – plot the point. Keep doing this process until the points for all months represented are plotted.

Teaching tips for cumulative frequency
- Incorporate project based learning activities that include frequency graphs and cumulative frequency graphs so students develop an understanding of the differences and similarities between them.
- Instead of worksheets, have students do hands-on learning activities such as collaborative activities where students collect their own data and create their own tables and graphs.
- Demonstrate to students how to collect and analyze data using Google Sheets or Excel.
Easy mistakes to make
- Forgetting to add the frequencies
When completing a cumulative frequency table, you need to add the frequencies from one interval to the next.
- Just plotting the frequencies, rather than working out the running totals
A cumulative frequency graph is usually something like an s-shape, and should always start in the bottom left and finish at the top right of your set of axes. If your graph looks more like a mountain range, you’ve plotted the frequencies rather than the cumulative frequencies.
- Plotting at the midpoint of each class interval
Points on a cumulative frequency graph are always plotted using the upper class boundary of each group – unlike a frequency polygon, which uses the midpoints.
Related frequency graph lessons
Practice cumulative frequency questions
1. Which table represents a correct cumulative frequency table of the number of times cars were sold in a particular month?


To complete a cumulative frequency table take a running total for each category or interval. Start with the first row by rewriting the frequency.
Next, move to the next row and add the frequency to the first one, continue until the table is completed.
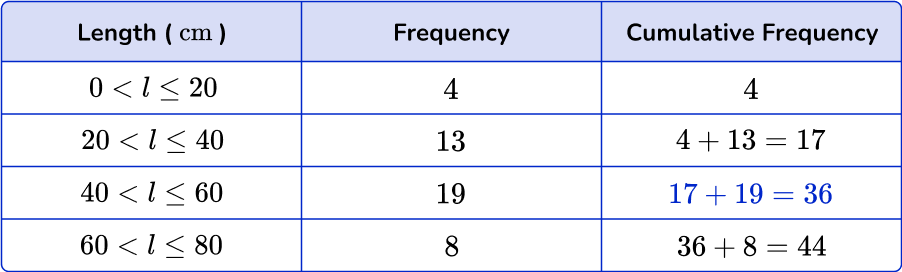
2. Below is a grouped frequency table for the length of 48 pieces of string. Calculate the missing cumulative frequency.
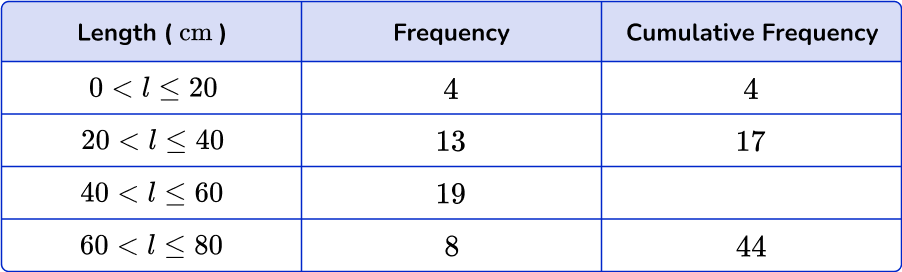
Add 17 in the cumulative frequency column to the next frequency down (19), to get the answer 36.
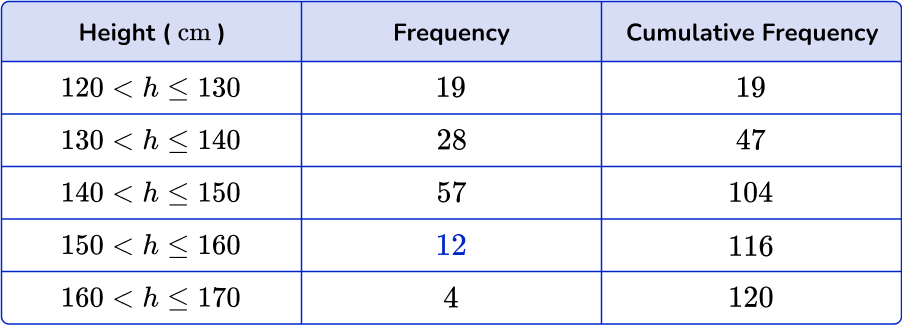
3. Below is a grouped frequency table showing the height (in centimeters) of 120 students in the 8 th grade. Find the missing frequency.
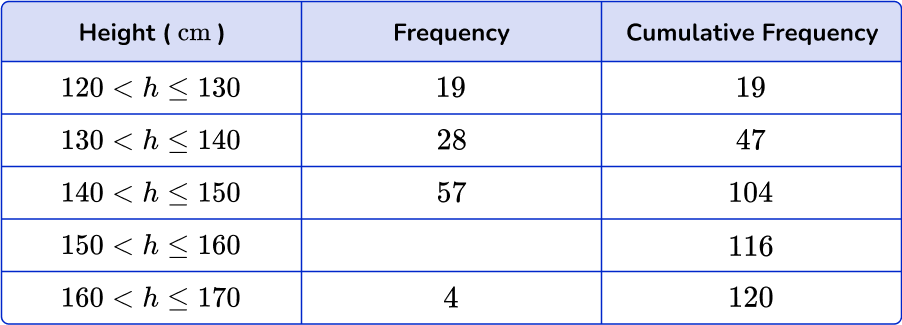
To find the missing frequency, calculate the difference between the cumulative frequency for the row (116) and the cumulative frequency for the previous row (104).
116-104 = 12.
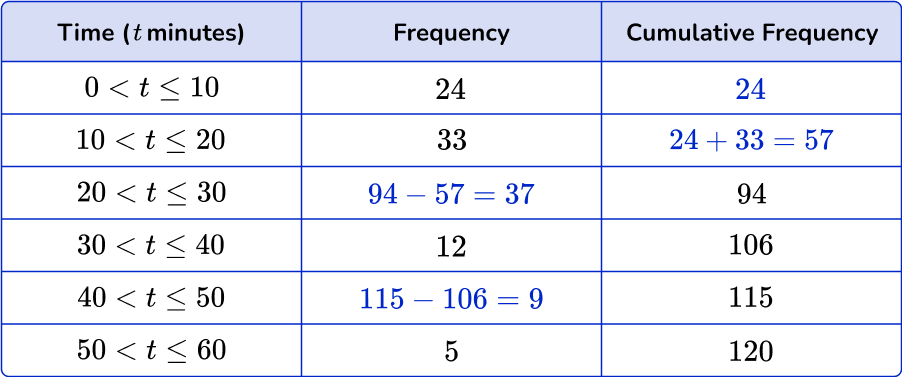
4. The table below shows the amount of time 120 people exercise per day. Find the missing values in the cumulative frequency table.
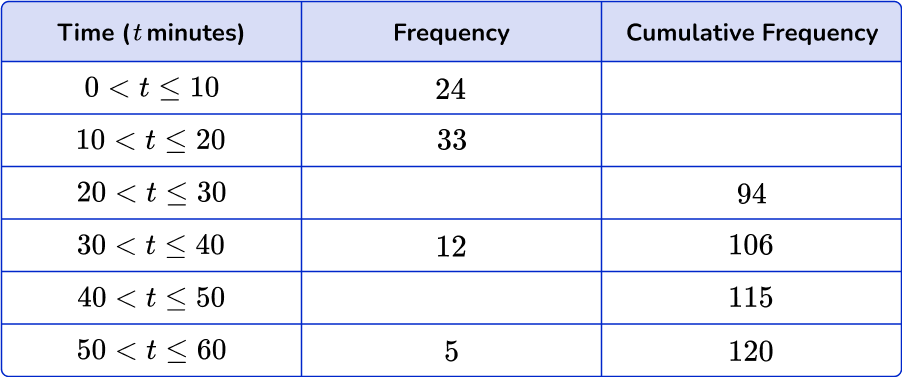
A cumulative frequency table is a running total of all the frequencies.
To find the first missing value, just rewrite the frequency of the first interval. To find the second missing value, add 33 and 24.
To find the third missing value, subtract from 94. To find the fourth missing value, subtract 106 from 115.
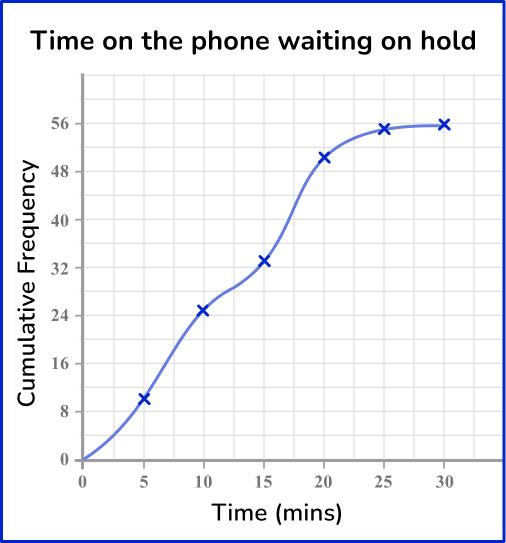
5. The table represents the length of time waiting on hold for customer service. Which cumulative frequency graph represents the data in this grouped frequency table?
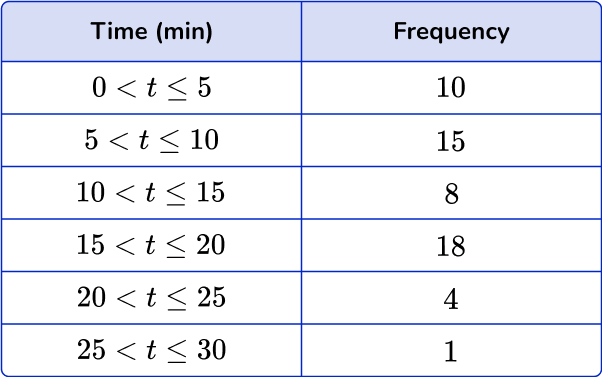

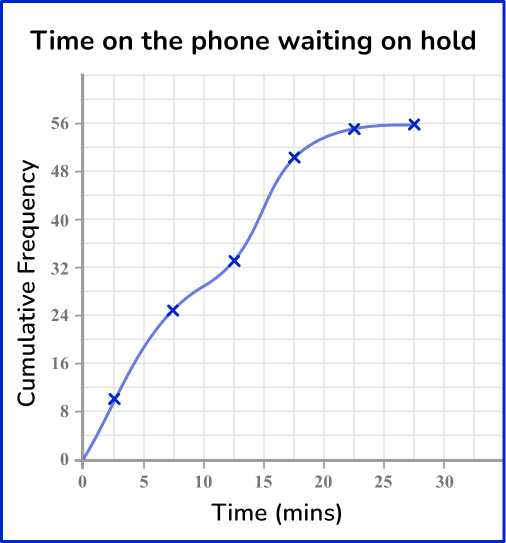
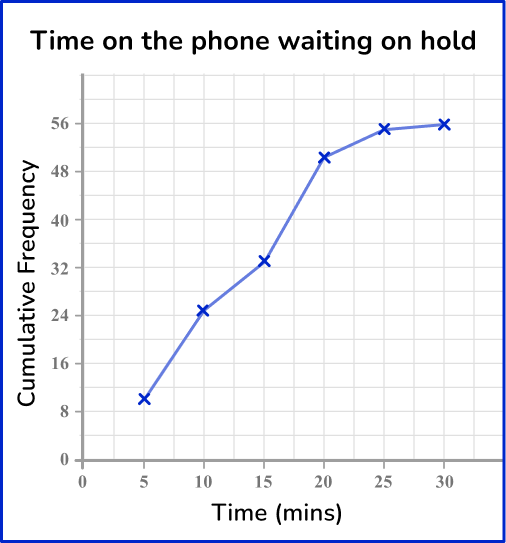
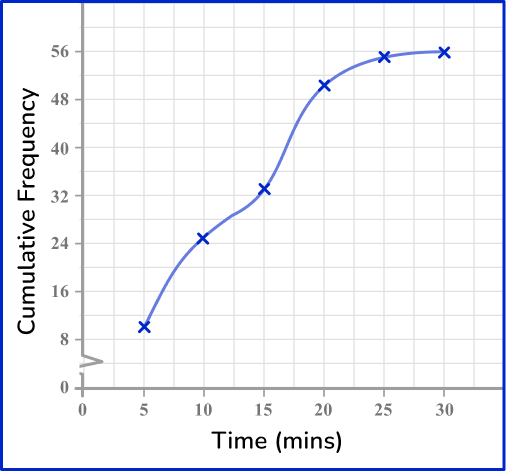
Draw a cumulative frequency column next to the table and use this to calculate the running totals.
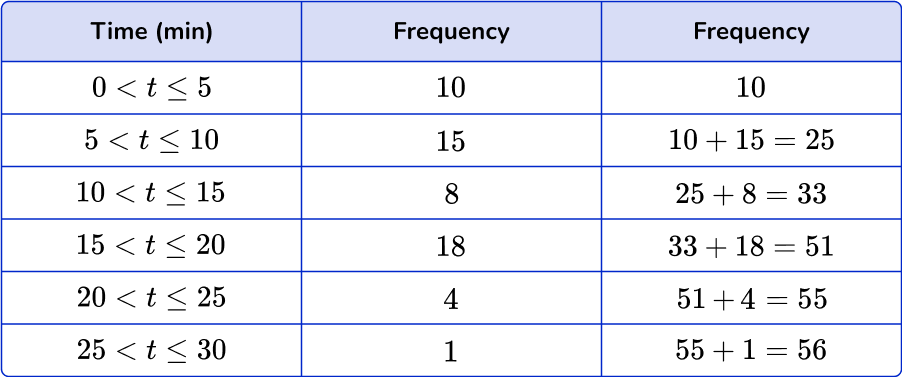
Plotting the cumulative frequency at the upper bound of each class interval, you get the following graph:
6. The graph below represents the weights of boxes of produce from a local market. What are the correct calculated relative cumulative frequencies?
To find the relative cumulative frequency, divide the cumulative frequency by the total amount of observations. Then convert each decimal to a percent by multiplying by 100.
Notice how the percents increase in value until the final row which will always be 100 \%.
Cumulative frequency FAQs
A relative frequency distribution is something you will work with in a high school statistics class. It is when a distribution displays the proportion of the total number of observations that are connected with a particular value or class value.
The standard deviation is a statistical measure that measures the variability of a data set from its mean. For example, a low standard deviation means the data points are close in range to the mean. A high standard deviation means the data points are more dispersed from the mean.
The next lessons are
- Sampling methods
- Probability
- Compound probability
- Units of measurement
- Represent and interpret data
- Percent
Still stuck?
At Third Space Learning, we specialize in helping teachers and school leaders to provide personalized math support for more of their students through high-quality, online one-on-one math tutoring delivered by subject experts.
Each week, our tutors support thousands of students who are at risk of not meeting their grade-level expectations, and help accelerate their progress and boost their confidence.

Find out how we can help your students achieve success with our math tutoring programs.
[FREE] Common Core Practice Tests (3rd to 8th Grade)
Prepare for math tests in your state with these 3rd Grade to 8th Grade practice assessments for Common Core and state equivalents.
Get your 6 multiple choice practice tests with detailed answers to support test prep, created by US math teachers for US math teachers!