What Are Mean, Median And Mode? Explained For Teachers, Parents And Kids
Here you can find out what mean, median, mode and range are, when they are taught in school, and how you can help children to understand them as part of their math learning at home.
What are mean, median, mode and range?
Mean, median and mode are different types of averages from a data set.
The mean is adding up all the data points and dividing the sum by the number of data points (or total number of numbers). It is also known as ‘arithmetic mean’, rather than ‘geometric mean’.
The median is the middle value (or midpoint) after all the data points have been arranged in value order as a list of numbers.
The mode is the value that appears the most number of times in a data set.
The range is the difference between the largest value and the smallest value.

Mean, Median, Mode and Range Worksheet
Check your students' understanding of mean, median, mode and range with this selection of 28 questions - including problem solving questions. Includes a helpful answer key for teachers.
Download Free Now!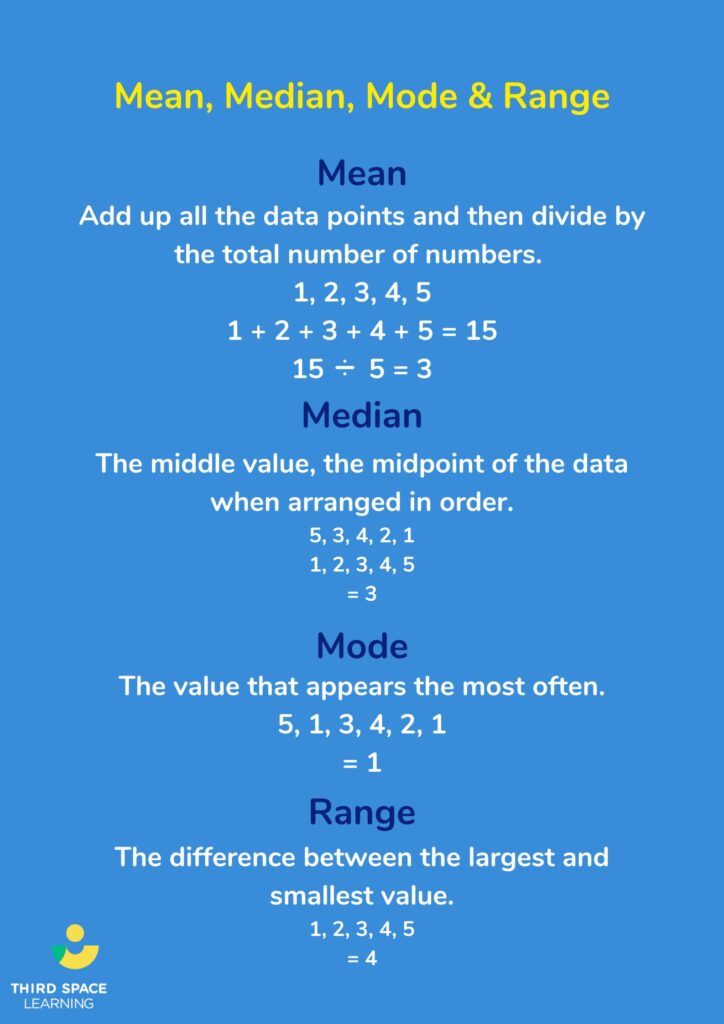
Mean, median, mode and range in math curriculum
It is useful for students to be aware of mean, median, mode and range despite it not being an explicit requirement, as an introduction at this stage proves useful for later years. When dealing with data that contains outliers, finding the mean may not always be the best option.

Meet Skye, the voice-based AI tutor making math success possible for every student.
Built by teachers and math experts, Skye uses the same pedagogy, curriculum and lesson structure as our traditional tutoring.
But, with more flexibility and a low cost, schools can scale online math tutoring to support every student who needs it.
Find out more
Mean median mode examples
To find an average, you must first have a data set. The following data set is from a game that a group of students were playing in the classroom.
| Jason | David | Josh | Olivia | Christine |
|---|---|---|---|---|
| 7 | 12 | 15 | 7 | 4 |
To calculate the mean, median, mode and range, we need to manipulate this data using the information about how to find each particular average above.
Finding the mean
Taking the above data as an example, to find the mean you would need to add 7, 12, 15, 7 and 4 together to get 45 and then divide this by the number of values, in this case, 5. The average value is 9. With bigger numbers, students can use partitioning to help them with the calculations.
Due to the amount of calculating involved in finding the mean, it is referred to as the ‘meanest’ of the averages. This is one way you can remind students how to find the mean of a number of data points!
Finding the mode
With our set of numbers, the mode would be 7 as this appears twice in our data in the table above. Mode shares some similar orthography with the word ‘most’ which can be a useful way to get students to remember how to find the mode.
Finding the median
The median value is found by finding the middle value. Remember that the data needs to be placed into value order. That means we take the data values from the table and write them out in ascending order. Once that is done, our data looks like this:
4, 7, 7, 12, 15
The middle value, or median, is 7 as there are an equal number of other values on either side of the second 7. When your data set contains an even number of values rather than an odd number, take the pair of numbers that would make the median, add them together and then divide them by 2.
Finding the range
The range is the difference between the highest and lowest values. With our data set that would be 11, as the highest number is 15 (Josh) and the lowest number is 4 (Christine). To find the difference, you need to subtract the highest value from the lowest value.
When do children learn about mean, median and mode?
Following the Common Core Math State Standards, students are first introduced formally to mean and median in the 6th grade statistics and probability unit of study. Students are expected to give the median and/or mean of quantitative measures when summarizing numerical data sets.
While it is not formally in the standards again until high school statistics and probability, students may encounter having to calculate mean, median and mode in other grade levels.
In the Texas state standards, students are introduced to mean, median and range in the 6th grade, while summarizing numeric data. Mean is taught according to the standards again in the 8th grade when finding the absolute deviation.
Read more: Teaching Statistics And Data Handling KS2
How does mean median mode relate to other areas of math?
While there is no requirement for it to be linked to other areas of mathematics, some teachers may choose to give tasks that find the averages of particular data sets. This could include, for example, finding the mean of certain measurable characteristics of the class. For example, hand span, height or shoe size. This data could be obtained during a statistics lesson or a lesson on measurement.
How does mean median mode link to real life?
The United States Census Bureau uses the mean to find the mean age of the population. Any role that involves looking at statistical data will likely use all the above measures of central tendency to help draw conclusions from the data.
People may also use the mode or modal value to estimate how long it takes them to do tasks they complete frequently.
For example, if you timed yourself vacuuming where you lived and collected these times in minutes (10, 10, 8, 13, 10), you could say that it takes you around 10 minutes to vacuum where you live, as 10 is the value with the highest frequency in the data set.
Mean, median, mode worked example
Let’s look at a step-by-step mean median mode example question!
| Jason | David | Josh | Olivia | Susan | Christine |
|---|---|---|---|---|---|
| 8 | 12 | 7 | 5 | 15 | 7 |
Use the data above to find the mean, median, mode and range of the data.
To find the mean, first, add all the data sets.
To solve this we need to add 8, 12, 7, 7, 5 and 15. This is 54.
Next, we divide by the number of data sets. As this data is for 6 people, the number of data sets is 6. This means we need to divide 54 by 6 or know that 6 x ? = 54. This is 9. The mean is 9.
To find the median, we need to re-write the data in order from least to greatest.
5, 7, 7, 8, 12, 15
We then need to find the middle value. As the data set has an even number we need to find the two middle numbers, add them and divide by 2.
The middle numbers (or median numbers) are 7 and 8 as there are two numbers on either side of them. Adding them up together gives us 15. 15 divided by 2 = 7.5.
To find the mode, we are looking for the data that appears most often. 7 is the only whole number that appears more than once, so the mode is 7.
To find the range, we subtract the lowest value from the data set from the highest. The lowest value is 5 and the highest is 15. 15 – 5 = 10. The range is 10.
Mean, median, mode practice question
| Jason | David | Josh | Olivia | Susan | Christine | Rita |
|---|---|---|---|---|---|---|
| 5 | 10 | 4 | 8 | 11 | 4 | 7 |
Use the data above, and the examples from further up the page, to find the mean, median, mode and range of the data.
Answers:
- Mean is 43
- Median is 7
- Mode is 4
- Range is 7 (11 – 4 = 7)
Mean, median, mode and range calculate the averages of data sets using different methods. Mean is the average of all of the numbers. Median is the middle number, when in order. Mode is the most common number. Range is the largest number minus the smallest number.
Add all of the numbers together and then divide that by how many numbers there are.
The median is the number in the middle of a data set. For example, in the data set: 7, 6, 9, 2, 1, the median would be 6 as the numbers would be placed in order (1, 2, 6, 7, 9), and 6 is the number in the middle.
Wondering how to explain other key math vocabulary to your children? Check out our Math Dictionary For Kids And Parents, or try these other blogs:
- What Is Mean In Math And How To Work Out An Average?
- What Is A Unit Fraction?
- Concrete Resources Explained For Parents
Do you have students who need extra support in math?
Skye – our AI math tutor built by experienced teachers – provides students with personalized one-on-one, spoken instruction that helps them master concepts, close skill gaps, and gain confidence.
Since 2013, we’ve delivered over 2 million hours of math lessons to more than 170,000 students, guiding them toward higher math achievement.
Discover how our AI math tutoring can boost student success, or see how our math programs can support your school’s goals:
– 3rd grade tutoring
– 4th grade tutoring
– 5th grade tutoring
– 6th grade tutoring
– 7th grade tutoring
– 8th grade tutoring
The content in this article was originally written by primary school lead teacher Neil Almond and has since been revised and adapted for US schools by elementary math teacher Christi Kulesza