

What Is A Strip Diagram? Explained for Kids, Parents & Teachers
A strip diagram is a visual model commonly used in elementary grades to aid in solving a problem with known and unknown quantities. A strip diagram can also be known as a bar model, a tape diagram, a fraction strip, a length model, or a part-part-whole model.
See also: Bar Model Math
These rectangular models can be used with all four operations and may be seen in all elementary grade levels. Strip diagrams are used during the “representational” stage of the CRA model, as students represent the equation or math problem they are solving.


Strip Diagram Questions Worksheet
Download 20 mixed topic word problems, including a strip diagram template for students to use as an aid at home and in school.
Download Free Now!What is a strip diagram?
A strip diagram is a visual model used as support to solve an addition, subtraction, multiplication, or division equation or word problem. Students set up the rectangular model as two “strips,” one representing the total and one representing the parts. One or more quantities are unknown and the model will help provide students with a visual representation of the quantities in relation to the other unknown quantities as well as the known quantities in the problem. This helps students build an understanding of the relationships between the numbers while performing each operation.
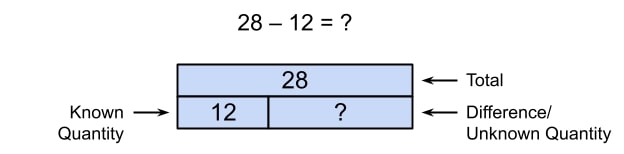
For example, if we are using a strip diagram to represent the subtraction problem 28 – 12 = ?, we would have a “total” strip at the top of the diagram, and then two smaller strips underneath that, together, equal the same length as the total strip.
Why is a strip diagram important?
A strip diagram allows students to visualize the problem or equation they are trying to solve in a simple and efficient way. These visual models are quick and easy to draw and allow students to create a representation of the relationship between the quantities involved in the problem.
They are especially helpful when students are solving word problems, as it can also help them determine which operation they need to use. This is a skill many students struggle with and this is a quick strategy that can be used with all four operations.

Meet Skye, the voice-based AI tutor making math success possible for every student.
Built by teachers and math experts, Skye uses the same pedagogy, curriculum and lesson structure as our traditional tutoring.
But, with more flexibility and a low cost, schools can scale online math tutoring to support every student who needs it.
Find out moreHow to use strip diagrams
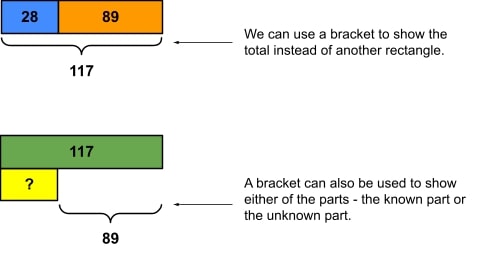
To use a strip diagram, you will start by drawing two rectangles of the same size. Depending on the equation and the operation needed, the bottom rectangle will be split into two or more parts. Either the top rectangle, or one or more parts of the bottom rectangle, will be blank to represent the unknown quantity that needs to be found. No matter the operation, the top rectangle will represent the total of the parts of the bottom rectangle.
Looking at the examples below, you can see that the way we use strip diagrams for addition and subtraction, as well as for multiplication and division, are the same but with different unknown quantities. For addition and subtraction, the strip diagram will be used as a part-part-whole model. The total will be the top rectangle, whether this quantity is known or unknown, and the parts will make up the rectangles at the bottom. With multiplication and division, the total is also represented by the top rectangle, and the bottom rectangle represents the groups.
Strip diagram examples
Strip diagrams can be used to solve a variety of problems involving each of the operations – from basic addition and subtraction to more complex multiplication and division, even including multi-step word problems. Here are some basic examples of how we can use strip diagrams to solve word problems. The word problems here are intentionally similar, so that you can see how each diagram differs depending on which operation is needed to solve the problem.
Addition word problem
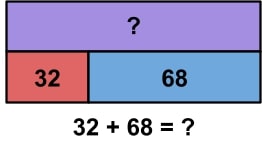
Frank has 32 red marbles and 68 blue marbles. How many marbles does he have altogether?
In our addition word problem, we are given two quantities – the number of red marbles and the number of blue marbles. Students will need to find the total by adding these two quantities together. The red marbles and blue marbles are represented by their respective colors in the bottom part of our strip diagram. The total, or the unknown quantity, is represented by the purple rectangle. As you can see, the red rectangle and blue rectangle together make up the length of the unknown quantity, or the total. This will help students see that those two numbers should be added together to get the total.
Subtraction word problem
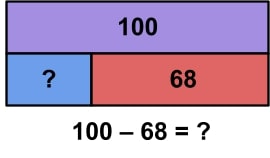
Frank has 100 marbles. 68 of them are red and the rest are blue. How many marbles are blue?
In our subtraction word problem, we still have two known quantities. However, this time, we are given the total number of Frank’s marbles, which is 100. This number will go in the top rectangle of our diagram. We are also given the number of red marbles.
The unknown quantity in this problem is the number of blue marbles. The red marbles and blue marbles together still make up the total number of marbles. So the setup of the rectangles in our strip diagram did not change, but our unknown quantity did. Students should be able to deduce that this word problem will need to be solved using subtraction.
Multiplication word problem
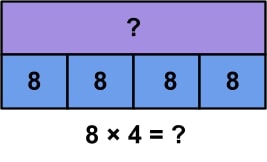
Jenna has 4 jars of marbles. Each jar contains 8 marbles. How many marbles does she have altogether?
The way we set up bar model multiplication and division problems using a strip diagram is a bit different than the way we set up addition and subtraction problems. Instead of three quantities – or part-part-whole – we use the strip diagram to represent equal parts of a whole. In this example, we know that there are 4 jars of marbles, with 8 marbles being in each jar.
Instead of seeing the 4 and 8 represented numerically, the groups, or jars in this example, are represented in the bottom section of our strip diagram. As you can see, the bottom portion consists of 4 equal-sized rectangles. Inside each of these smaller rectangles is the number 8; this represents the 8 marbles inside each of the 4 jars. The top rectangle, again, shows our total. Since this is multiplication, this would be our product.
Division word problem
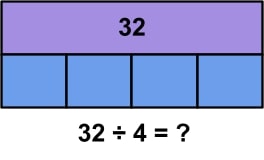
Jenna has 32 marbles. They are split evenly between 4 jars. How many marbles are in each jar?
In the division example, we are given the total number of marbles, which was the product of our multiplication example. We know that this number will be represented by our top rectangle. The bottom portion, again, will represent our equal groups. Since we know the number of groups, or jars, which is 4, the bottom portion is again split into 4 equal-sized groups. The unknown quantity here is the number of marbles that are in each of the jars, or each of the groups. Students should be able to deduce that division will need to be used to solve this problem.
What’s the difference between strip diagrams and bar models?
A strip diagram and a bar model are one and the same! These two terms can be used interchangeably. You may also see a strip diagram referred to as a tape diagram, length model, or fraction strip. They all serve the same purpose – to be used as a visual problem solving strategy to solve equations and/or word problems (including multi-step word problems!) involving any of the four operations.
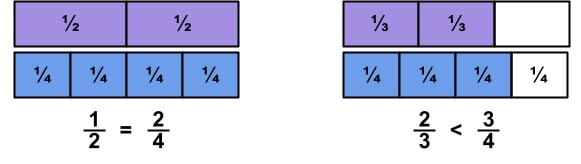
In addition to the four operations, strip diagrams can also be used to represent fractions – in this case, the strip diagram would be referred to as a fraction bar model or fraction strip. The diagram can give students a visual representation of fractions in order to find equivalent fractions or even compare two fractions. In the first example, students will be able to see that ½ is equal 2/4. In the second example, they can see that ⅔ is less than ¾.
When do children learn about strip diagrams in school?
The term “strip diagram,” as well as its synonyms, such as “bar model,” does not explicitly appear in any of the Common Core Math State Standards. However, the use of models, although not specified, is mentioned in numerous standards. Here are the standards where a strip diagram or bar model can and should be used to help students:
1st grade math
- 1.NBT.4 Add within 100, including adding a two-digit number and a one-digit number, and adding a two-digit number and a multiple of 10, using concrete models or drawings and strategies based on place value…
- 1.NBT.6 Add within 100, including adding a two-digit number and a one-digit number, and adding a two-digit number and a multiple of 10, using concrete models or drawings and strategies based on place value…
2nd grade math
- 2.NBT.7 Add and subtract within 1000, using concrete models or drawings and strategies based on place value…
3rd grade math
- 3.NF.3b Recognize and generate simple equivalent fractions, e.g., 1/2 = 2/4, 4/6 = 2/3. Explain why the fractions are equivalent, e.g., by using a visual fraction model.
- 3.NF.3d Compare two fractions with the same numerator or the same denominator by reasoning about their size. Recognize that comparisons are valid only when the two fractions refer to the same whole. Record the results of comparisons with the symbols >, =, or <, and justify the conclusions, e.g., by using a visual fraction model.
4th grade math
- 4.NF.1 Explain why a fraction a/b is equivalent to a fraction (n × a)/(n × b) by using visual fraction models, with attention to how the number and size of the parts differ even though the two fractions themselves are the same size. Use this principle to recognize and generate equivalent fractions.
- 4.NF.2 Compare two fractions with different numerators and different denominators, e.g., by creating common denominators or numerators, or by comparing to a benchmark fraction such as 1/2. Recognize that comparisons are valid only when the two fractions refer to the same whole. Record the results of comparisons with symbols >, =, or <, and justify the conclusions, e.g., by using a visual fraction model.
- 4.NF.3b Decompose a fraction into a sum of fractions with the same denominator in more than one way, recording each decomposition by an equation. Justify decompositions, e.g., by using a visual fraction model.
- 4.NF.3d Solve word problems involving addition and subtraction of fractions referring to the same whole and having like denominators, e.g., by using visual fraction models and equations to represent the problem.
- 4.NF.4a Understand a fraction a/b as a multiple of 1/b. For example, use a visual fraction model to represent 5/4 as the product 5 × (1/4), recording the conclusion by the equation 5/4 = 5 × (1/4).
- 4.NF.4b Understand a multiple of a/b as a multiple of 1/b, and use this understanding to multiply a fraction by a whole number. For example, use a visual fraction model to express 3 × (2/5) as 6 × (1/5), recognizing this product as 6/5. (In general, n × (a/b) = (n × a)/b.)
- 4.NF.4c Solve word problems involving multiplication of a fraction by a whole number, e.g., by using visual fraction models and equations to represent the problem.
- 4.NF.7 Compare two decimals to hundredths by reasoning about their size. Recognize that comparisons are valid only when the two decimals refer to the same whole. Record the results of comparisons with the symbols >, =, or <, and justify the conclusions, e.g., by using a visual model.
5th grade math
- 5.NBT.7 Add, subtract, multiply, and divide decimals to hundredths, using concrete models or drawings and strategies based on place value, properties of operations, and/or the relationship between addition and subtraction; relate the strategy to a written method and explain the reasoning used.
- 5.NF.2 Solve word problems involving addition and subtraction of fractions referring to the same whole, including cases of unlike denominators, e.g., by using visual fraction models or equations to represent the problem.
- 5.NF.3 Interpret a fraction as division of the numerator by the denominator (a/b = a ÷ b). Solve word problems involving division of whole numbers leading to answers in the form of fractions or mixed numbers, e.g., by using visual fraction models or equations to represent the problem.
- 5.NF.4a Interpret the product (a/b) × q as a parts of a partition of q into b equal parts; equivalently, as the result of a sequence of operations a × q ÷ b. For example, use a visual fraction model to show (2/3) × 4 = 8/3, and create a story context for this equation.
- 5.NF.6 Solve real world problems involving multiplication of fractions and mixed numbers, e.g., by using visual fraction models or equations to represent the problem.
- 5.NF.7a Interpret division of a unit fraction by a non-zero whole number and compute such quotients. For example, create a story context for (1/3) ÷ 4, and use a visual fraction model to show the quotient.
- 5.NF.7b Interpret division of a whole number by a unit fraction, and compute such quotients. For example, create a story context for 4 ÷ (1/5), and use a visual fraction model to show the quotient.
- 5.NF.7c Solve real world problems involving division of unit fractions by non-zero whole numbers and division of whole numbers by unit fractions, e.g., by using visual fraction models and equations to represent the problem.
Non Common Core standards
Other states that do not follow the Common Core State Standards may specifically mention “strip diagram” or “bar model” within their standards, or they may just make mention of “visual models” as in the CCSS. Here are a few examples of standards from the Texas Essential Knowledge and Skills for Mathematics (TEKS) standards that explicitly mention the term “strip diagram”:
3rd grade math
- 3(A) represent fractions greater than zero and less than or equal to one with denominators of 2, 3, 4, 6, and 8 using concrete objects and pictorial models, including strip diagrams and number lines
- 5(B) represent and solve one- and two-step multiplication and division problems within 100 using arrays, strip diagrams, and equations
4th grade math
- 5(A) represent multi-step problems involving the four operations with whole numbers using strip diagrams and equations with a letter standing for the unknown quantity
There are also many TEKS standards that mention “models” or “pictorial models” where a strip diagram can be used, such as this 1st grade TEKS standard:
- 3(A) use concrete and pictorial models to determine the sum of a multiple of 10 and a one-digit number in problems up to 99
As a teacher, it is important to know and be able to interpret your specific state standards and to know which concepts a strip diagram would be appropriate to use for teaching.
Other ways to draw a strip diagram
Although your typical strip diagram or bar model will be drawn with two rectangles on top of each other, as the examples above show, there are other ways to draw strip diagrams. Be aware that you may see many other interpretations of this model, but they are all used the same way. Here are a few examples:
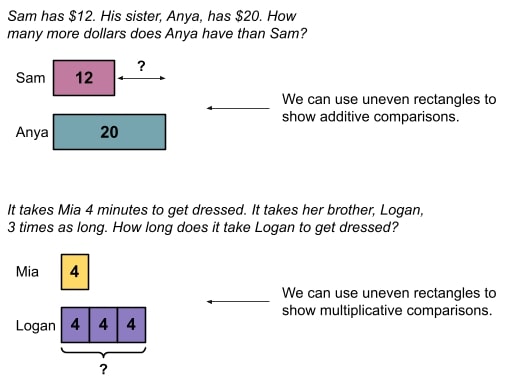
Using uneven “strips” or “bars”:
How to incorporate strip diagrams into your classroom
Strip diagrams can easily be incorporated into any lesson where students can use visual models to represent their work. Strip diagrams can be very quickly drawn into a math notebook while students are working on solving problems. If teachers are looking for a way to use these every day, for a “problem of the day,” for example, a template can be printed and laminated for each student to use.
Then, instead of using their notebook pages or worksheets each day, they can pull out their template and a dry erase marker and fill in the template according to the problem they are presented that day. The templates for all grade levels, as well as all four operations, can simply be two blank rectangles stacked on top of one another.
As students are given the problem and the known quantities, they can partition the bottom rectangle accordingly and determine their unknown quantity.
Strip diagram worked examples
Note: These examples are appropriate for intermediate grade levels (grades 3-5).
1. Complete the diagram
Anna has 168 beads. She is using the beads to make 6 necklaces for her friends. Each necklace will have the same amount of beads. Complete the diagram to show how many beads will go on each necklace.
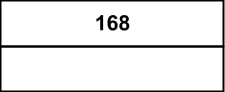
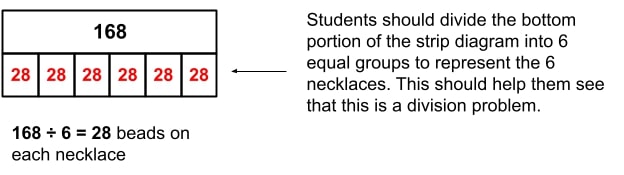
In this problem, students are asked to complete the diagram in order to help them solve it. As you can see, students are given the number in the top rectangle, which is the total number of beads Anna has. The other known quantity in this word problem is 6, which is the number of necklaces the beads will be divided by. Based on this information, students should determine that the bottom rectangle needs to be split into 6 equal groups. Then, they can solve for the unknown quantity, which is the number in each of those 6 groups (which they will write in each of the 6 sections they create in the bottom rectangle.)
Their completed strip diagram will look like this:
2. Multiple choice – choose the diagram
Mason has a membership at the local gym. His membership costs $34 every two months. How much does his membership cost in one year? Choose the diagram that correctly represents this problem. Note that t represents the total cost of the membership.
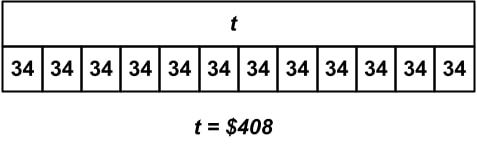
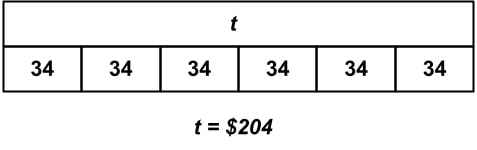
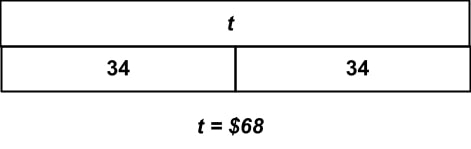
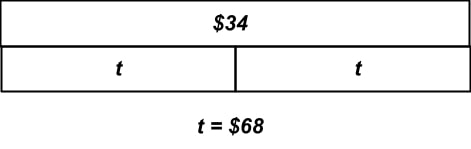
In this problem, students need to be able to read and interpret a strip diagram correctly in order to answer the question. The question gives students a known quantity of $34, but requires them to infer the second known quantity, which is 6. Since Mason pays $34 every 2 months, he pays the fee 6 times during the year, since there are 12 months in a year. Students may misinterpret this known quantity as 2, since 2 is the other number mentioned in the word problem. Once students understand that he pays $34 6 times, they should look for a diagram which shows 6 groups of $34 that equal the total. The only answer that fits this description is answer choice b.
3. Multi-step word problem
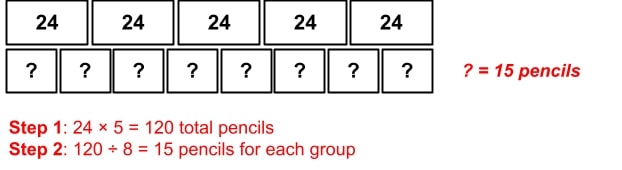
A teacher bought 5 boxes of pencils for her classroom. Each box contained 24 pencils. Then, she divided them evenly among 8 groups of students. Use the diagram to find how many pencils were given to each group of students.
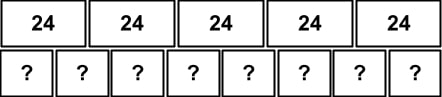
This is a multi-step problem, which often proves to be challenging for many students. First, students need to find out the total number of pencils. Here, the “total” box is shown as 5 groups of 24. The strip diagram should help students determine that for the first step of this problem, they will need to multiply 24 by 5 to find the total number of pencils.
Then, once they have the total, they can divide that number by the total number of groups, which is 8. The diagram will help them visualize this, as well, since the bottom portion of the strip diagram is partitioned into 8 groups. Then, students can see that the unknown quantity is the number in each group. Students should divide the total number by 8 to get the answer, represented by the question mark in the diagram.
It is important to note that students do not need to complete the diagram for this question, but they will use the diagram to help them solve the problem.
Strip diagram practice questions
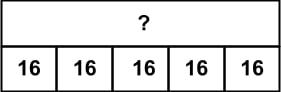
1. Reggie drank 5 bottles of water today. Each bottle contained 16 ounces of water. Use the diagram to determine how many ounces of water Reggie drank today.
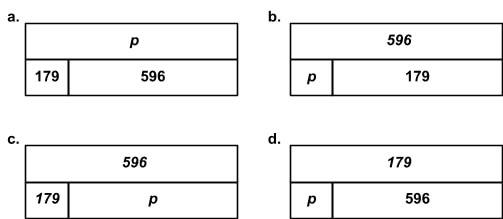
2. Fiona’s book has 598 pages. So far, she has read 179 pages. Which diagram shows how to find the number of pages, p, she has left to read?
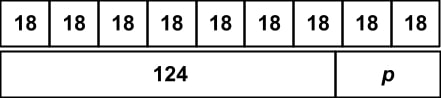
3. Millie has a photo album with 18 pages. Each page can hold 9 pictures. So far she has 126 photos in her photo album. Use the diagram to find the number of photos, p, she can still put into her album.
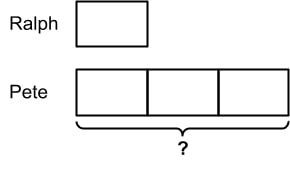
4. Ralph made $105 mowing lawns this month. His brother, Pete, made 3 times as much. Use the diagram to determine how much money Pete made.
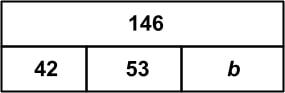
5. Amir, Jonah, and Bridget went trick-or-treating together. At the end of the night, Amir had 42 pieces of candy and Jonah had 53 pieces of candy. The three friends decided to combine their candy. Altogether, they had 146 pieces of candy. Use the diagram to determine, b, how much candy Bridget had before the friends combined their candy.
Strip diagram FAQs
What is a strip diagram?
A strip diagram is a visual model commonly used in elementary grades to aid in solving a problem with known and unknown quantities.
What are other names for a strip diagram?
A strip diagram can also be known as a bar model, a tape diagram, a fraction strip, a length model, or a part-part-whole model.
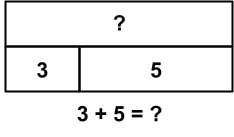
What is an example of a strip diagram?
Matty has 3 erasers. Hunter has 5 erasers. How many erasers do they have altogether?
What is a strip diagram in 5th grade math?
5th grade strip diagrams may be used for higher level concepts, such as adding, subtracting, multiplying, and dividing decimals, and/or fractions.
Do you have students who need extra support in math?
Skye – our AI math tutor built by experienced teachers – provides students with personalized one-on-one, spoken instruction that helps them master concepts, close skill gaps, and gain confidence.
Since 2013, we’ve delivered over 2 million hours of math lessons to more than 170,000 students, guiding them toward higher math achievement.
Discover how our AI math tutoring can boost student success, or see how our math programs can support your school’s goals:
– 3rd grade tutoring
– 4th grade tutoring
– 5th grade tutoring
– 6th grade tutoring
– 7th grade tutoring
– 8th grade tutoring