What Is Mean In Math And How Can You Calculate An Average? Explained For Teachers, Parents and Kids
Here you can find out what mean and average are, when mean and average are taught in elementary and middle school, and how you can help children to understand mean and average.
What is mean?
Mean in math refers to a type of average. To find the mean average value or ‘arithmetic mean’, you must first add up all the given data points and divide the sum by the number of data points (or number of numbers) in total.
There are different types of average or measures of central tendency. These include:
- Median, also known as the middle number or middle value
- Mode or modal number, the most frequently occurring data value
- Range, the difference between the smallest value and highest value
There are also other types of mean such as:
- Harmonic mean
- Sample mean
- Geometric mean

Mean, Median, Mode and Range Worksheet
Support your students with their understanding of mean, as well as median, mode and range, with this 28 question worksheet. Answer key included.
Download Free Now!Mean math examples
Visualizing mean
Mean in math is often taught and explained through abstract methods as soon as students in 6th grade are capable of manipulating the numbers needed to find the mean or average amount.
However, students must understand what is happening when they find the mean of a data set.
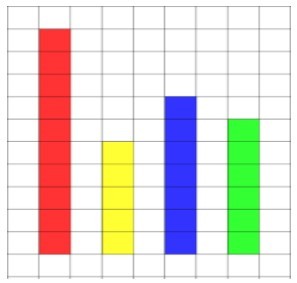
The pictures below show just that.
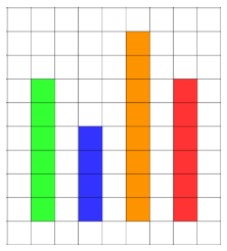
If this represented a data set of points four teams scored in a game, we could find the mean by:
- Adding up all the data points to find the sum of the values
- Dividing the sum by the number of data points in total
While this reaches the answer of a single number, it does not provide a conceptual understanding of what is happening to that data.
Before students carry out an algorithm, it would be better to demonstrate what is happening when carrying out this process.
In finding the mean, we want to find the average points scored in a game across all teams. The way to do this would be to see if we can manipulate the data to get all data points to the same height.
When doing this with a class, I would get them to make these representations physically with cubes or counters.
Read more: Concrete Representational Abstract
We can see that by removing two orange cubes and placing them on top of the blue cubes, all data points have the same value.
This is demonstrated in the next picture.
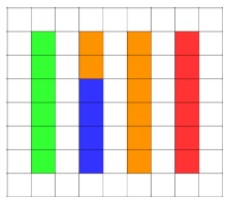
With all data at the same height, we can see that the mean average is the size of each part when a quantity is shared equally.

Meet Skye, the voice-based AI tutor making math success possible for every student.
Built by teachers and math experts, Skye uses the same pedagogy, curriculum and lesson structure as our traditional tutoring.
But, with more flexibility and a low cost, schools can scale online math tutoring to support every student who needs it.
Find out moreHow do you calculate mean?
To find the mean of a set, you first need a given set of values. This data set can be obtained from various data but it is more meaningful when relatable to your class.
Here’s a frequency table containing discrete data (rather than grouped data) with no outliers.
| Name | Number of books read |
| Fred | 5 |
| Harry | 4 |
| George | 1 |
| Dudley | 2 |
| Ron | 5 |
| Arthur | 3 |
| Ginny | 8 |
| Albus | 4 |
To find the mean average value, you must first add all the data points and divide the sum by the total number of values. Students first need to find the total number of books the class read.
As they are in 6th grade, I would encourage them to use their mental arithmetic skills to find the total. They may make number bonds that they are comfortable with.
In ascending order:
- 5, 4 and 1 make a number bond to 10
- 2, 5 and 3 make a number bond to 10
- 8 and 4 make 12, so this gives a total of 32
The next step is to divide 32 by the number of values in the (bimodal) data set. As there are 8 students, divide 32 by 8.
Students should be able to use their multiplication facts (8 × 4 = 32) to know that 32 divided by 8 is 4. This makes 4 the mean value of the set of numbers above.
When do children learn about mean and average in school?
While studying statistics and probability, students in 6th grade are expected to learn how to give quantitative measures of center (median and/or mean) and describe any overall pattern with reference to the context in which the data was gathered.
According to the Texas Essential Knowledge and Skills, students are introduced to summarizing numeric data with numerical summaries, including the mean and median, during their 6th grade year while studying data analysis.
Read more: Teaching Statistics And Data Handling
How do mean and average relate to other areas of math?
Finding the mean can improve fluency skills of addition when adding several data sets and can encourage students to use mental math methods for these additions.
Students can also find more complex averages from decimals. Likewise, it can help students practice seeing division as the inverse of multiplication.
Read more: What Is Fluency In Math & How Do Schools Develop It?
How do mean and average link to real life?
Finding the mean is just one of the ways that people find averages from a set of data. The United States Census Bureau uses the mean to find the average age of the population and the population mean. Any role that involves looking at data will likely use the mean to help draw conclusions from the data.
Mean math worked examples
Here are some step-by-step worked examples for calculating the mean in math.
1. Find the mean.
| Name | Number of detentions in a year |
| Fred | 18 |
| Harry | 35 |
| George | 21 |
| Ron | 26 |
To find the mean, first, add all the data sets.
To solve this, we need to add the list of numbers, 18, 35, 21 and 26. This is 100.
Next, we divide by the number of data sets. As this data is for 4 people, the number of data sets is 4. This means we need to divide 100 by 4. This is 25.
2. Find the mean.
| Name | Number of merits |
| Fred | 45 |
| Harry | 37 |
| George | 43 |
| Ron | 46 |
| Ginny | 54 |
To find the mean, first, add all the data sets.
To solve this, we need to add 45, 37, 43, 46 and 54. This is 225.
Next, we divide by the number of data sets. As this data is for 5 people, the number of data sets is 5. This means we need to divide 225 by 5. We can do this by partitioning 225 into 200 and 25. 25 divided by 5 is 5 and 200 divided by 5 is 40. When these are added together, you get 45.
The mean number of merits is 45.
Mean math practice questions
1. Use a concrete manipulative to share these quantities out equally.
Answer: Each row should have 7 blocks.
2. Complete this sentence stem:
To find the mean, first ______ all the data sets and then ______ by the ______ of data sets.
Answer: To find the mean, first add all the data sets and then divide by the number of data sets.
3. Find the mean.
| Name | Number of books read |
| Fred | 7 |
| Harry | 4 |
| George | 2 |
| Dudley | 4 |
| Ron | 3 |
Answer: The mean is 4.
4. Joshua has tried to find the mean. Can you spot his mistake?
| Pig 1 | Pig 2 | Pig 3 |
| 54kg | 55kg | 59kg |
54 + 55 + 59 = 168kg
168 ÷ 6 = 28
The mean weight is 28kg.
Answer: Joshua’s mistake is that he divided by 6 and not 3.
5. Find the mean.
| Name | Number of cookies eaten |
| Trevor | 25 |
| Pritesh | 32 |
| Janice | 28 |
| Moe | 35 |
| Sue | 30 |
Answer: 126
A mean in math is the average of a data set, found by adding all numbers together and then dividing the sum of the numbers by the number of numbers. For example, with the data set: 8, 9, 5, 6, 7, the mean is 7, as 8 + 9 + 5 + 6 + 7 = 35, 35/5 = 7.
The mean is the average of two or more numbers.
The mean is 3.
Wondering how to explain other key math vocabulary to your children? Check out our Math Dictionary for Kids And Parents and take a look at What Are Mean Median Mode Range?
Do you have students who need extra support in math?
Skye – our AI math tutor built by experienced teachers – provides students with personalized one-on-one, spoken instruction that helps them master concepts, close skill gaps, and gain confidence.
Since 2013, we’ve delivered over 2 million hours of math lessons to more than 170,000 students, guiding them toward higher math achievement.
Discover how our AI math tutoring can boost student success, or see how our math programs can support your school’s goals:
– 3rd grade tutoring
– 4th grade tutoring
– 5th grade tutoring
– 6th grade tutoring
– 7th grade tutoring
– 8th grade tutoring
The content in this article was originally written by primary school lead teacher Neil Almond and has since been revised and adapted for US schools by elementary math teacher Christi Kulesza