A Guide To Teaching Statistics And Data Handling In Elementary School
Representing and Interpreting Data, while an important area of elementary math, makes up a small percentage of the overall objectives in elementary curriculum.
That said, it is still important to give it our full and undivided attention. Done well, the area of representing and interpreting data allows teachers to embed other mathematical ideas such as addition and subtraction, begin to develop other areas of mathematical thinking, and help students see the clear links to science, particularly the ‘working scientifically’ objectives.
Looking for lesson ideas for a specific grade? Find it in the contents list below!

Types of Data Check for Understanding
Use this quiz to check your grade 6 to grade 7 students’ understanding of types of data.
Download Free Now!Teaching representing and interpreting data – Before you begin…
It is worth noting that according to the Common Core state standards, representing and interpreting data begins in 1st grade. Each grade level following will require the understanding of the standards before, so it’s important that each grade level teacher, following 1st grade, should check for mastery of the previous grade level standards before moving forward.
Finally, in terms of time management, it is worth bearing in mind that many objectives specify the interpretation and presentation of data, and not the collection of data.
Teachers should think carefully if using a whole math lesson to collect data is the best use of time or if links can be made to other areas of the curriculum where data has already been collected or given – for example, place value and decimals are both topics that offer data collection opportunities.
Looking for some ideas of how to do this? Check out Neil’s blog on teaching place value.
Representing and Interpreting Data 1st Grade
In the Common Core state standards, for each area of math outlined, there are standards outlined that should be mastered by the end of grade level. The learning standards required by the end of 1st grade are as follows:
- Organize, represent, and interpret data with up to three categories; ask and answer questions about the total number of data points, how many in each category, and how many more or less are in one category than in another.
Representing and Interpreting Data 1st Grade –
Students will engage in collecting and using data to answer questions that are relevant to their lives, like what pet they have at home or their favorite school subject.
At this grade level, students will need to limit the number of categories to three, so it’s important that when modeling posing questions for students, you model this. Questions like “what is your favorite color?” or “what month were you born in?” will result in more than 3 categories for students to answer in.
After posing the questions, students will collect data for their question and represent this data on a simple chart or table. This can be done by writing the three categories for anticipated response on a chart, and having students write their names by their selection.
| What Is Your Favorite Recess Game? | |
| Freeze Tag | Andrew Carla Carlos Lacey Jacob Terrell Teresa |
| Jump Rope | Veronica Teddy Aria LaDarius |
| Basketball | Jada Brett Kendall |
Students are then able to interpret the results of the question by counting each name from the chart. This leads to the perfect opportunity to discuss questions such as “which was the favorite recess game?” or “which was the least favorite recess game?”.
After the discussion, students can then write simple sentences explaining their results such as “The least favorite recess game is Basketball.” You may need to provide sentence stems for some students, but with practice, they should be able to do this without your help.
Meet Skye, the voice-based AI tutor making math success possible for every student.
Built by teachers and math experts, Skye uses the same pedagogy, curriculum and lesson structure as our traditional tutoring.
But, with more flexibility and a low cost, schools can scale online math tutoring to support every student who needs it.
Find out more
Representing and Interpreting Data 2nd Grade
In the Common Core state standards, for each area of math outlined, there are standards outlined that should be mastered by the end of grade level. The learning standards required by the end of 2nd grade are as follows:
- Generate measurement data by measuring lengths of several objects to the nearest whole unit, or by making repeated measurements of the same object. Show the measurements by making a line plot, where the horizontal scale is marked off in whole-number units.
- Draw a picture graph and a bar graph (with single-unit scale) to represent a data set with up to four categories. Solve simple put together, take-apart, and compare problems using information presented in a bar graph.
Representing and Interpreting Data 2nd Grade – picture graphs and bar graphs
Students in 2nd grade will study simple picture graphs and bar graphs, and learn how to pose questions, collect data and analyze and interpret the results. Students were expected to represent up to three categories in 1st grade, and now will represent up to 4 categories of data.
This will be the first exposure students have to bar graphs, and so it will be important to model and explain new vocabulary words, like key, x-axis and y-axis (for bar graphs), and any other parts.
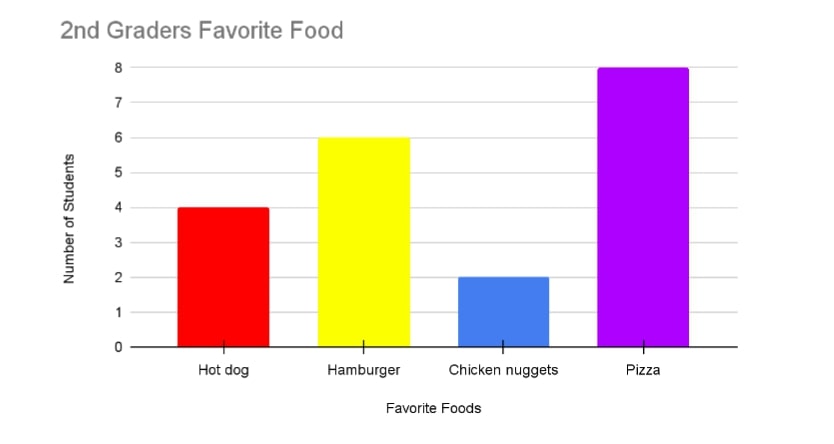
After collecting and graphing the data, students can be asked questions such as, how many students chose each category or which category had the most or the least. You want to make sure that students have the chance to discuss and share their data with other students.
Representing and interpreting word problems 2nd Grade
Students in 2nd grade are expected to solve simple word problems about the data presented in graphs. In terms of word problems, students will interpret and solve compare, put together and take apart problems. An appropriate problem would be:
How many more students liked pizza than hamburgers?
With the problem set up like this, students can see that when a question asks, ‘how many more’, we are looking at the difference between the two groups.
Students can then use their knowledge of number bonds to 20 or their knowledge of subtraction to reach the answer – 2.
Representing and Interpreting Data 3rd Grade
- Draw a scaled picture graph and a scaled bar graph to represent a data set with several categories. Solve one- and two-step “how many more” and “how many less” problems using information presented in scaled bar graphs.
- Generate measurement data by measuring lengths using rulers marked with halves and fourths of an inch. Show the data by making a line plot, where the horizontal scale is marked off in appropriate units— whole numbers, halves, or quarters.
Representing and Interpreting Data 3rd Grade lesson ideas
In 3rd grade, students will learn to make, read and interpret bar and picture graphs, as well as, solve one- and two-step word problems using the information from the graphs.
Spending some time to ensure that students are familiar with the difference between continuous and discrete data will pay dividends when students will be expected to write their own graphs based on data that they have collected.
Representing and Interpreting Data 3rd Grade – Scaled picture graphs and bar graphs
Understanding simple scales is such an important skill that ties in well with the application of multiplication and division facts in a real context.
For that reason, focusing on interpreting picture graphs, also known as pictographs or pictograms, is a must for this grade. These present numerical data pictorially.
Picture graphs are one of the simplest forms of data representation and they encourage students to look at the whole table (key and all) to fully understand what is happening to conduct data analysis.
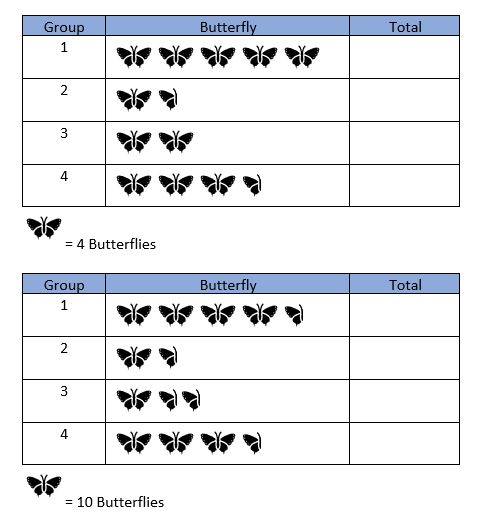
Consider the following picture graph with data about the number of butterflies each group in a class saw.
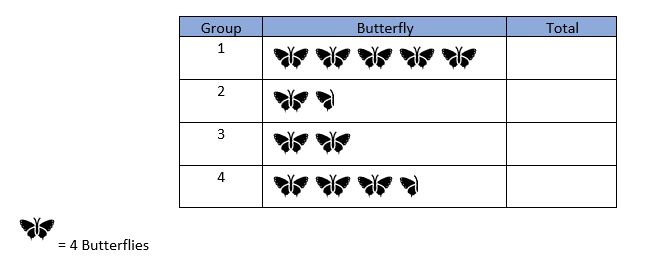
Presenting data like the above is important as it is not immediately clear what number the butterfly represents. Attention needs to be drawn to the key where we can see that the butterfly represents 4.
Representing and interpreting word problems 3rd Grade
In terms of word problems, a common theme is to compare two sets or more of data. An appropriate problem would be:
How many more butterflies did group 1 see than group 4?
Teachers should represent this as a bar model so students can see the underlying relationship.
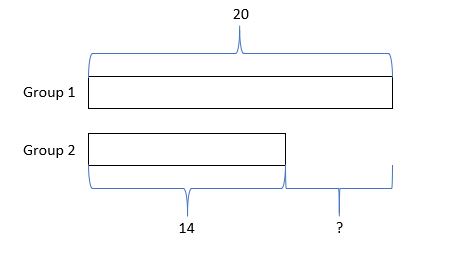
With the problem set up like this, students can see that when a question asks, ‘how many more’, we are looking at the difference between the two groups.
Students can then use their knowledge of number bonds to 20 or their knowledge of subtraction to reach the answer – 6.
For more on using bar modeling to visualize the underlying operations needed for a problem, check out Neil’s blog on teaching addition and subtraction.
Open ended, or goal free problems, allow students to explore a range of mathematical ideas without overwhelming them. Instead of focusing on only one ‘problem’, students are free to solve whatever they like.
For this question, I would only give the students the instruction of ‘what is the same and what is different’ and allow them to explore. Some key things I would like the students to note would be that some groups have a similar number of butterflies and some are different.
Representing and Interpreting Data 4th Grade
- Make a line plot to display a data set of measurements in fractions of a unit (1/2, 1/4, 1/8). Solve problems involving addition and subtraction of fractions by using information presented in line plots. For example, from a line plot find and interpret the difference in length between the longest and shortest specimens in an insect collection.
Representing and interpreting data lessons – 4th Grade
In 4th grade the sophistication of line plots increases – by having the data representing in fractional units of \frac{1}{2}, \ \frac{1}{4}, and \frac{1}{8}. Students will be expected to solve problems involving the measurement data collected, using addition and subtraction. An example of this can be found below.
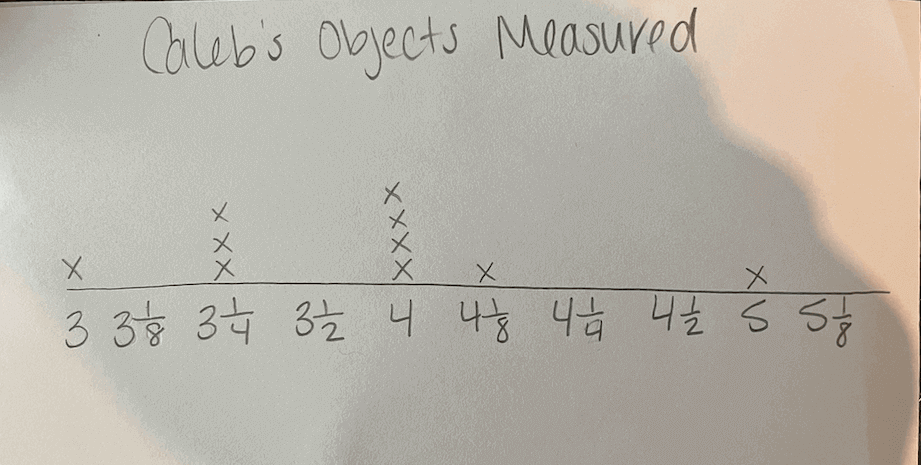
Beginning the lesson with a discussion about how fractions have been represented on a number line is a way to measure how much your students remember from the previous years.
Remind students that they will round the fraction to the nearest \frac{1}{8} of an inch, and that will we been using an approximation, as some items will not measure exactly to the inch, \frac{1}{2}, \ \frac{1}{4}, or \frac{1}{8}.
Representing and interpreting data word problems 4th Grade
Through the nature of the objective, all the question types students are likely to encounter will be word problems.
Represent and Interpret Data – 5th Grade
- Make a line plot to display a data set of measurements in fractions of a unit (1/2, 1/4, 1/8).
- Use operations on fractions for this grade to solve problems involving information presented in line plots. For example, given different measurements of liquid in identical beakers, find the amount of liquid each beaker would contain if the total amount in all the beakers were redistributed equally.
Represent and interpret data activities and lesson ideas 5th grade
Students will continue representing the data in fractional units of \frac{1}{2}, \ \frac{1}{4}, and \frac{1}{8}. Starting in 5th grade, students will be expected to solve problems involving the measurement data collected, using all operations.
Students should be able to collect and plot data by the time they reach 5th grade. However, the sophistication of the tools used to collect the measurement data may be increased. Instead of just measuring used pencils and crayons, students may use beakers with liquid in them as their data set.
Students can be asked questions such as, “if the liquid were redistributed among all the beakers, how much liquid would each beaker have?” It is important that students are using appropriate vocabulary when using fractional measurements and working with line plots.
Statistics and data handling word problems 5th Grade
Through the nature of the objective, all the question types students are likely to encounter will be word problems.
Representing and interpreting data provides an excellent opportunity for students to use the math skills they’ve learned in new contexts. Hopefully this post has given you some great ideas for how to teach and make use of this important topic!
Do you have students who need extra support in math?
Skye – our AI math tutor built by experienced teachers – provides students with personalized one-on-one, spoken instruction that helps them master concepts, close skill gaps, and gain confidence.
Since 2013, we’ve delivered over 2 million hours of math lessons to more than 170,000 students, guiding them toward higher math achievement.
Discover how our AI math tutoring can boost student success, or see how our math programs can support your school’s goals:
– 3rd grade tutoring
– 4th grade tutoring
– 5th grade tutoring
– 6th grade tutoring
– 7th grade tutoring
– 8th grade tutoring
The content in this article was originally written by primary school lead teacher Neil Almond and has since been revised and adapted for US schools by elementary math teacher Christi Kulesza.