High Impact Tutoring Built By Math Experts
Personalized standards-aligned one-on-one math tutoring for schools and districts
In order to access this I need to be confident with:
Mean, median and mode Grouped frequency table Addition and subtraction Multiplication and divisionMean from a frequency table
Here you will learn about the mean from a frequency table, including what it is and how to calculate it. You will also learn how to find an estimate for the mean from a grouped frequency table.
Students will first learn about mean from a frequency table as part of statistics and probability in 6 th grade.
What is mean from a frequency table?
Mean from a frequency table is when you find the mean average from a data set which has been organized into a frequency table. The frequency is the number of times a number or item is recorded in a data set.
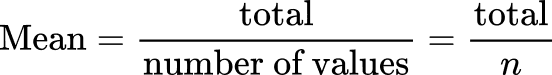
To calculate the mean, find the total of the values and divide the total by the number of values. The number of values is the total frequency. This can be abbreviated to n.
You can use an extra column to help.
Mean is a measure of central tendency. It is a value that can be used to represent a set of data.
For example,
The frequency table shows the number of people living in 16 apartments.
There are 5 apartments with 1 person living there, so calculate 1 \times 5=5
There are 6 apartments with 2 people living there, so calculate 2 \times 6=12
There are 3 apartments with 3 people living there, so calculate 3 \times 3=9
There are 2 apartments with 4 people living there, so calculate 2 \times 4=8
The number of values (n) is the total frequency, here n=16.
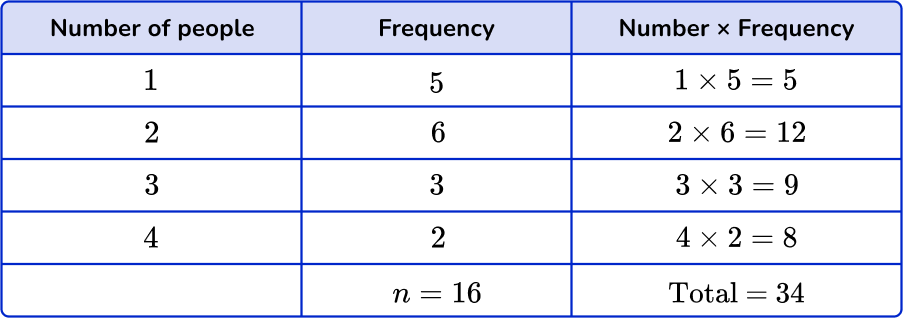
\text{Mean}=\cfrac{\text{total}}{n}=\cfrac{(1\times 5)+(2\times 6)+(3\times 3)+(4\times 2)}{16}=\cfrac{34}{16}=2.125
The mean is 2.125 people.
![[FREE] Mean from a Frequency Table Worksheet (Grade 6 to 8)](https://thirdspacelearning.com/wp-content/uploads/2024/04/Mean-from-a-Frequency-Table-Worksheet-listing-image.png)
[FREE] Mean from a Frequency Table Worksheet (Grade 6 to 8)
Test your grades 6 to 8 students’ skills on how to find the mean from a frequency table with this 15-question worksheet complete with answers. Save time and quickly identify learning gaps!
DOWNLOAD FREE NOW [FREE] Mean from a Frequency Table Worksheet (Grade 6 to 8)
Test your grades 6 to 8 students’ skills on how to find the mean from a frequency table with this 15-question worksheet complete with answers. Save time and quickly identify learning gaps!
DOWNLOAD FREE NOWEstimated mean from a grouped frequency table
When the data has been grouped together and put into a grouped frequency table, you cannot find the actual mean because you only have a range of possible values.
Instead you can find an estimate for the mean using the midpoints of each group. You can add more columns to the grouped frequency table to help.
For example,
The frequency table shows the number of correct answers earned on a test by 20 students.
There were 3 people who answered between 0 \text{-}9 questions correctly. As you don’t know the exact number of questions that each of these people got correct, you will use the midpoint of 4.5 questions correct.
You can find the midpoint by adding the smallest value and the largest value together and dividing by 2.
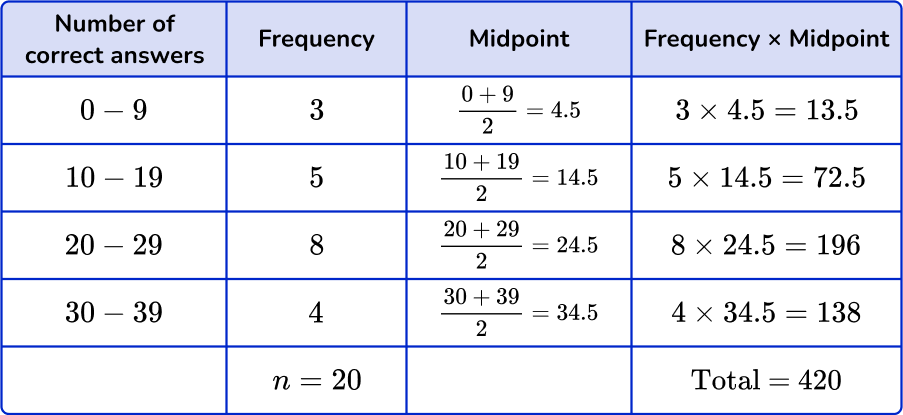
\text{Estimated Mean}=\cfrac{\text{total}}{n}=\cfrac{420}{20}=21
The estimated mean is 21 questions correct.
What is mean from a frequency table?
Common Core State Standards
How does this relate to 6 th grade math?
- Grade 6: Statistics and Probability (6.SP.A.3)
Recognize that a measure of center for a numerical data set summarizes all of its values with a single number, while a measure of variation describes how its values vary with a single number.
How to find the mean from a frequency table
In order to calculate the mean from a frequency table, you need to:
- Multiply the number values by the frequencies.
- Find the totals.
- Divide the total by \textbf{n}.
Mean from a frequency table examples
Example 1: frequency table
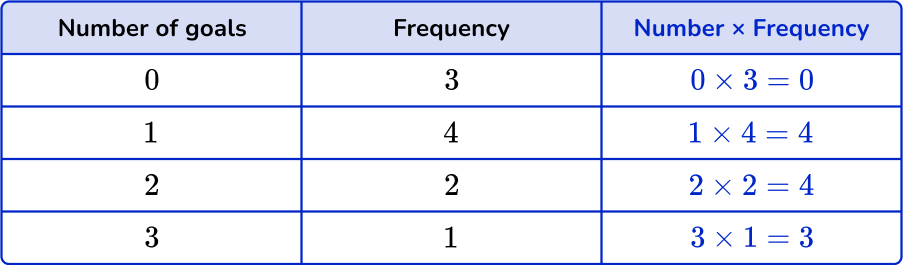
The frequency table shows the number of goals scored in 10 soccer games. Find the mean number of goals.
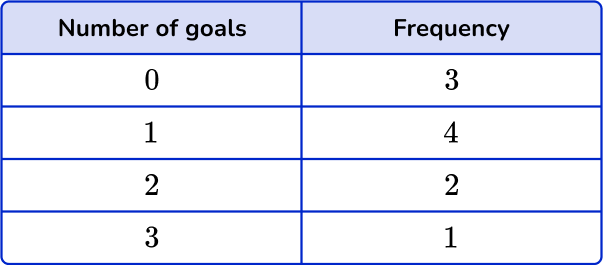
- Multiply the number values by the frequencies.
You can add an extra column next to the frequency column to help find the subtotals.
2Find the totals.
Find the total of the frequency column, n. Add up the subtotals to find the total.
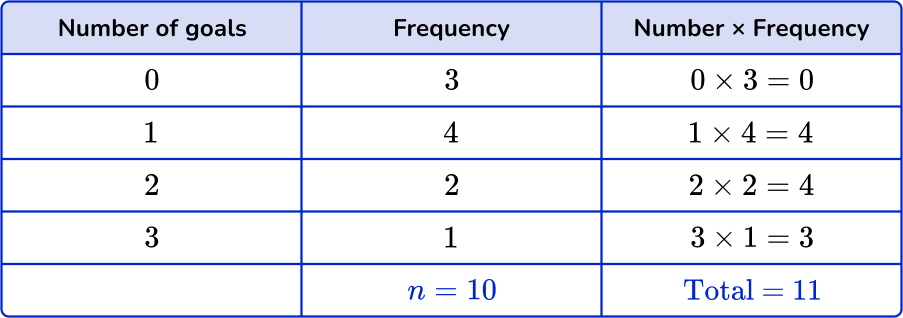
3Divide the total by \textbf{n}.
The last step is to divide the total by n.
\text{Mean}=\cfrac{\text{total}}{n}=\cfrac{11}{10}=1.1
The mean is 1.1 goals.
Example 2: frequency table
The frequency table shows the number of people on 20 buses. Find the mean number of people.
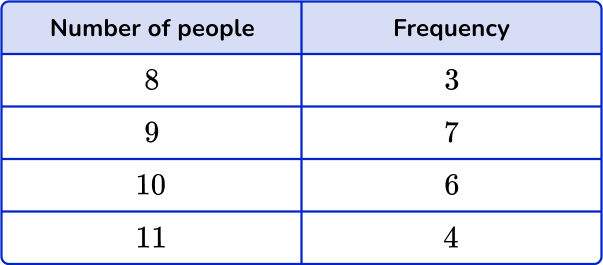
You can add an extra column next to the frequency column to help find the subtotals.
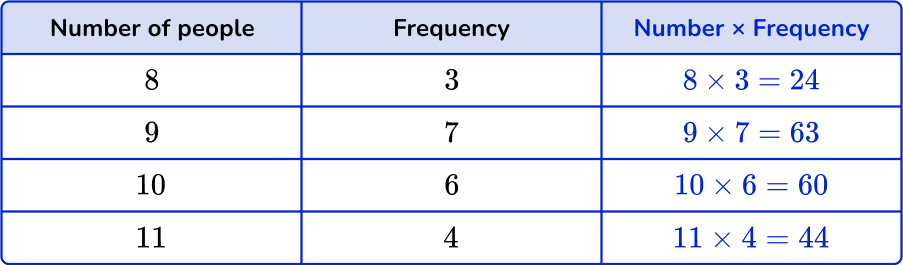
Find the total of the frequency column, n. Add up the subtotals to find the total.
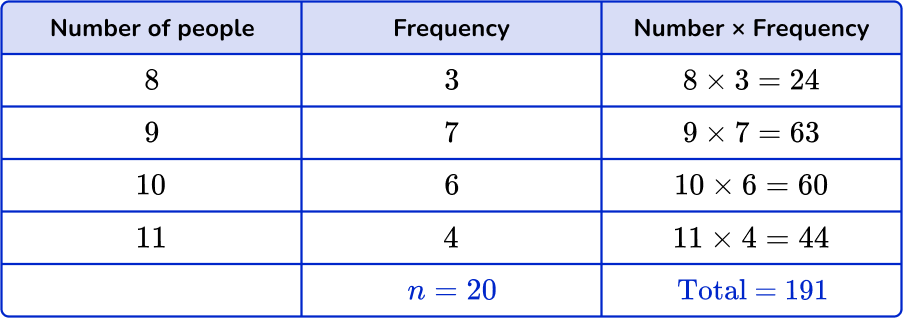
The last step is to divide the total by n.
\text{mean}=\cfrac{\text{total}}{n}=\cfrac{191}{20}=9.55
The mean is 9.55 people.
Example 3: frequency table
The frequency table shows the ages, in years, of 25 children in a math club. Find the mean age.
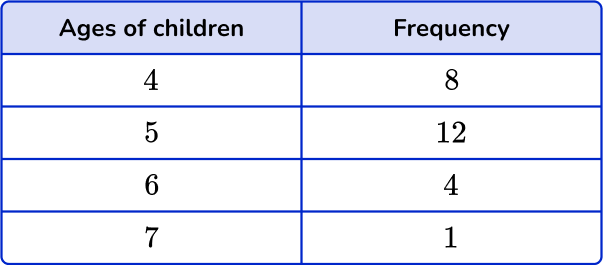
You can add an extra column next to the frequency column to help find the subtotals.
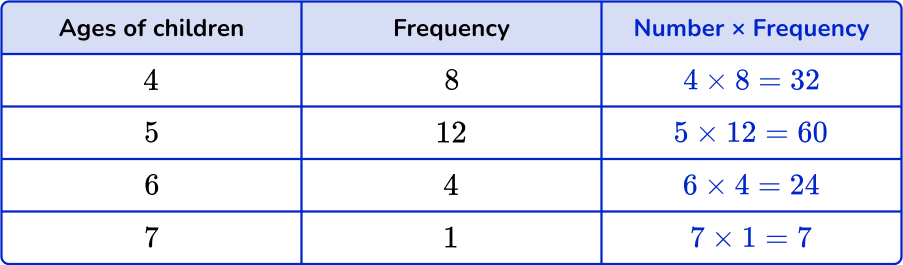
Find the total of the frequency column, n. Add up the subtotals to find the total.
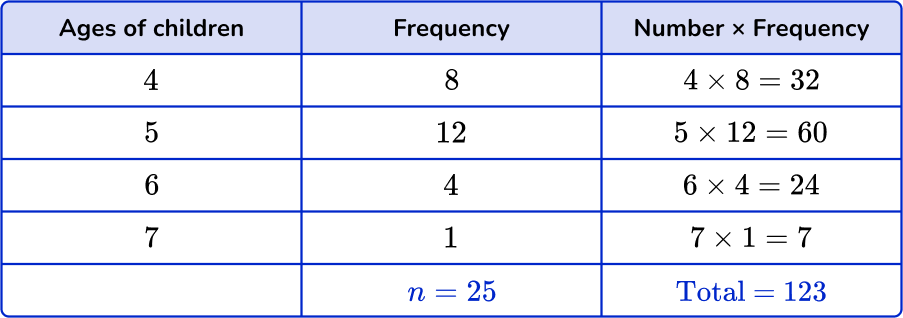
The last step is to divide the total by n.
\text{Mean}=\cfrac{\text{total}}{n}=\cfrac{123}{25}=4.92
The mean is 4.92 years.
How to estimate the mean from a grouped frequency table
In order to estimate the mean from a grouped frequency table, you need to:
- Find the midpoints of the groups.
- Multiply midpoints by the frequencies.
- Find the totals.
- Divide the total by \textbf{n}.
Example 4: grouped frequency tables
The grouped frequency table shows the number of people in 10 train carriages.
Estimate the mean number of people.
You do not know the actual number of people in the groups, so use the midpoint.
Find the midpoint by adding the smallest value and the largest value together and dividing by 2. Add a column for the midpoints.
You can add an extra column next to the frequency column to help find the subtotals.
Find the total of the frequency column, n. Add up the subtotals to find the total.
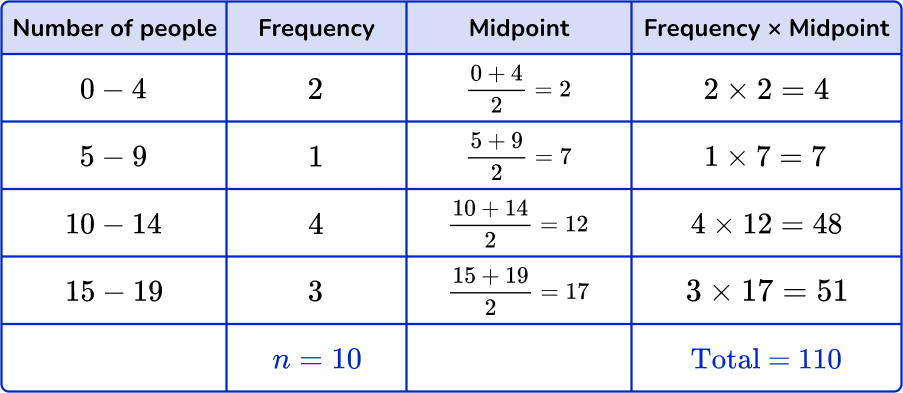
The last step is to divide the total by n.
\text{mean}=\cfrac{\text{total}}{n}=\cfrac{110}{10}=11
But remember that this is an estimate for the mean.
The estimated mean is 11 people.
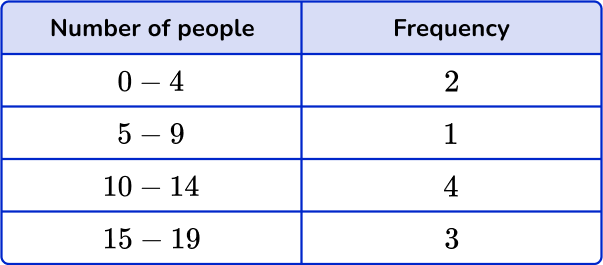
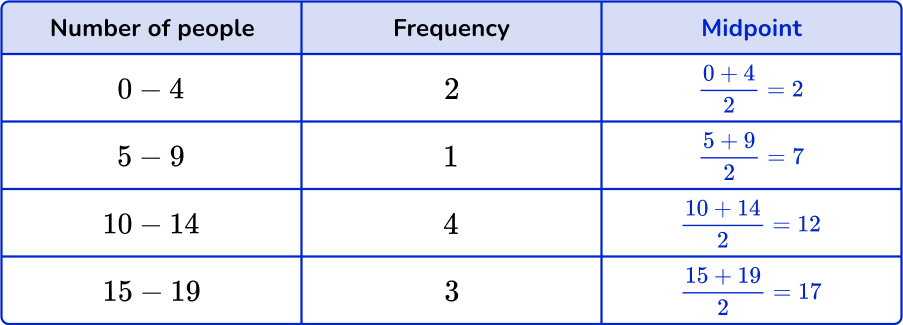
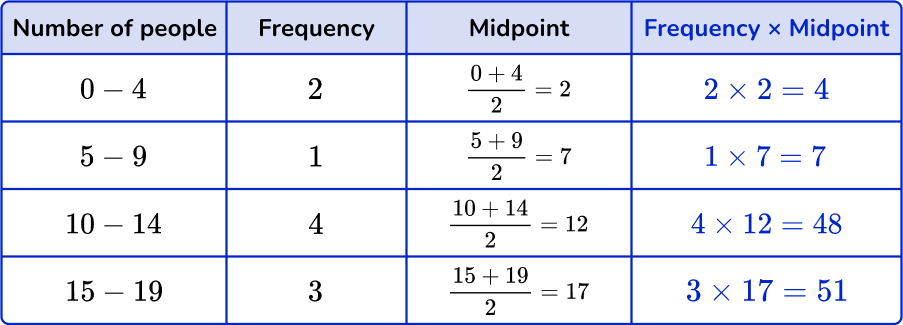
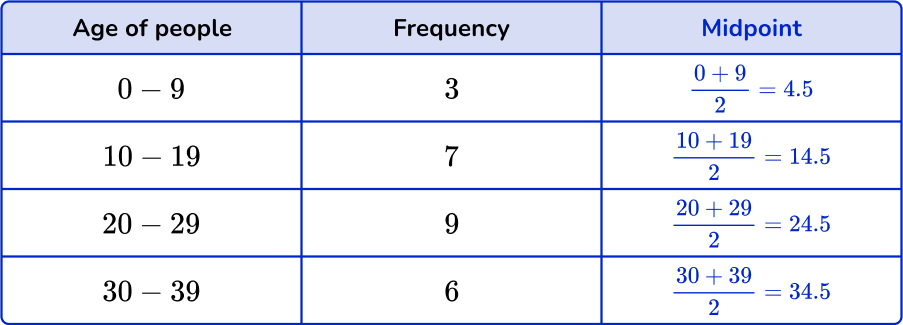
Example 5: grouped frequency tables
The grouped frequency table shows the ages of 25 people in a department store.
Estimate the mean age.
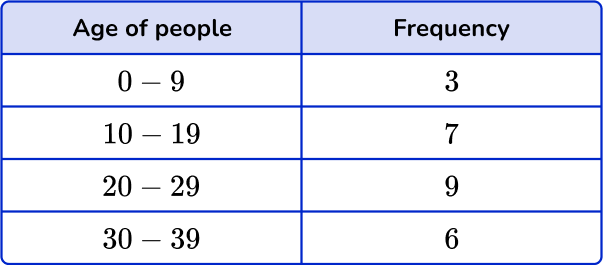
You do not know the actual ages in the groups, so use the midpoint.
Find the midpoint by adding the smallest value and the largest value together and dividing by 2. Add a column for the midpoints.
You can add an extra column next to the frequency column to help find the subtotals.
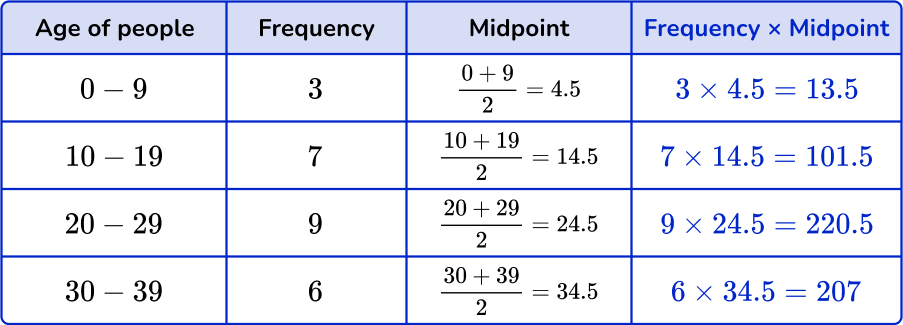
Find the total of the frequency column, n. Add up the subtotals to find the total.
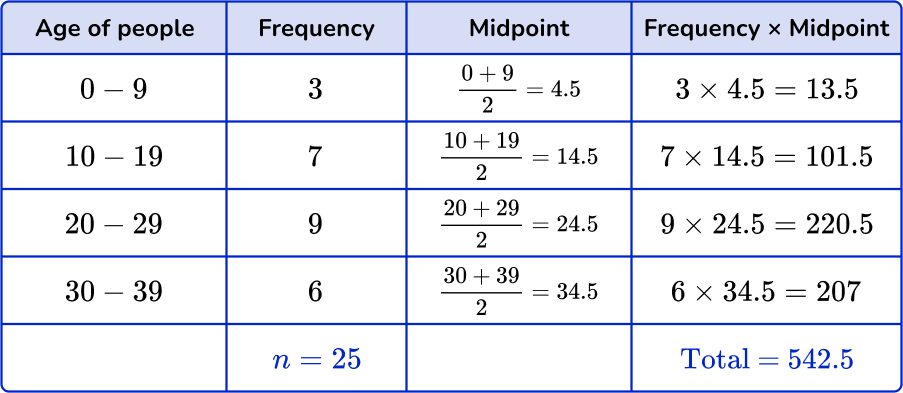
The last step is to divide the total by n.
\text{Mean}=\cfrac{\text{total}}{n}=\cfrac{542.5}{25}=21.7
But remember that this is an estimate for the mean.
The estimated mean is 21.7 marks.
Example 6: grouped frequency tables
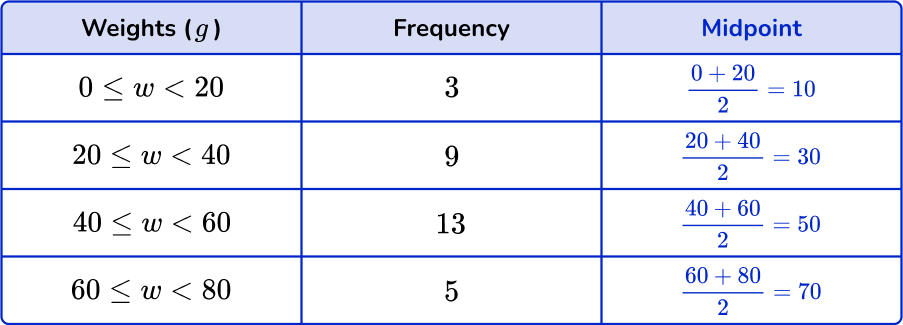
The grouped frequency table shows the weight in grams of 30 potatoes.
Estimate the mean weight. Round your answer to the nearest tenths.
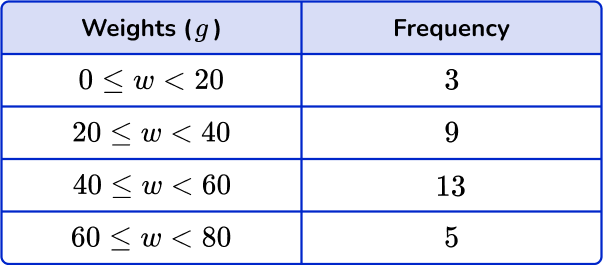
You do not know the actual weights in the groups, so use the midpoint.
Find the midpoint by adding the smallest value and the largest value together and dividing by 2. Add a column for the midpoints.
You can add an extra column next to the frequency column to help find the subtotals.
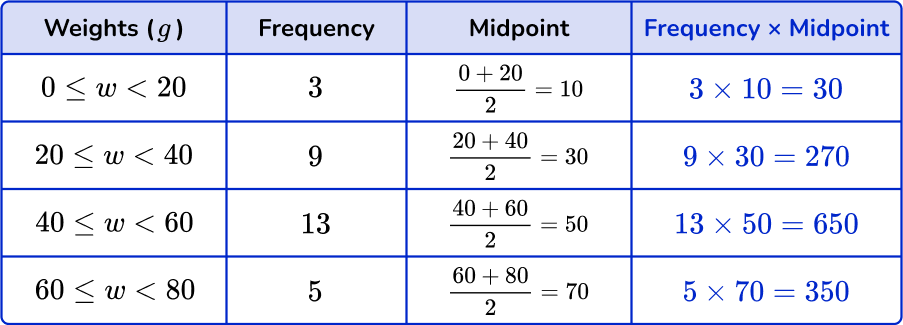
Find the total of the frequency column, n. Add up the subtotals to find the total.
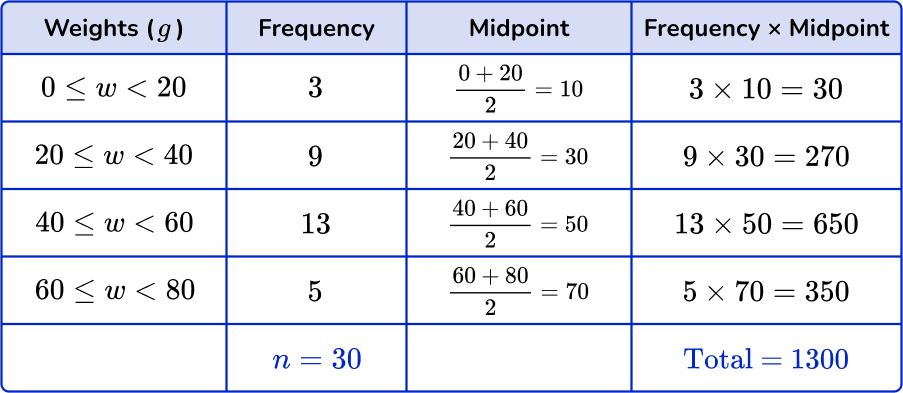
The last step is to divide the total by n.
\text{Mean}=\cfrac{\text{total}}{n}=\cfrac{1300}{30}=43.333… = 43.3 \ \text{(to the nearest tenth)}
But remember that this is an estimate for the mean.
The estimated mean is 43.3 \, g.
Teaching tips for mean from a frequency table
- Providing students with worksheets of practice problems is an easy way for them to practice finding the mean from a frequency table using given data values.
- Have students write step-by-step instructions in their math notebook while following example problems. You can also display the examples and instructions on an anchor chart that is displayed in the classroom for easy reference.
- Incorporate technology into the skill by allowing students to use Microsoft Excel or Google sheets to find formulas to find the mean.
Easy mistakes to make
- Finding median or mode instead of finding mean
Check if you have been asked for the median, mode or mean average.
- Not dividing by the total frequency
Remember to divide by the total frequency, not by the number of rows in the table. Always check to see if your final answer is sensible.
- Thinking the mean must be a whole number
The mean does not have to be a whole number; it can also be a decimal or a fraction.
- Always estimating the mean from all frequency tables
You only use the estimated mean when you have a grouped frequency table because you do not have the actual values for the data.
- Thinking a frequency table is different from a frequency distribution table
A frequency distribution table is the same as a frequency table.
Related frequency table lessons
Practice mean from a frequency table questions
1. The frequency table shows the number of pets of 15 students. Find the mean number of pets. Give your answer to the nearest hundredth.
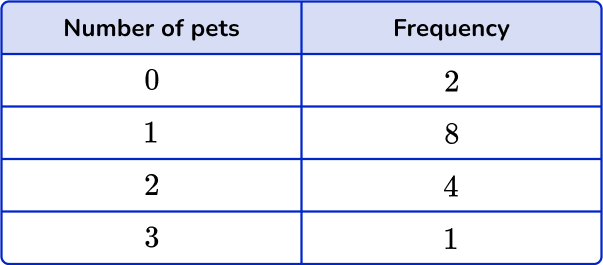


You need to multiply the numbers by the frequencies and find the total. Then divide the total by n, the frequency total,
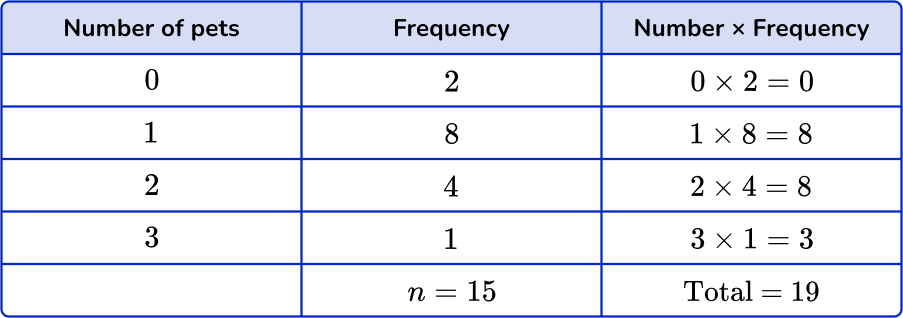
\text{Mean}=\cfrac{\text{total}}{n}=\cfrac{19}{15}=1.2666… = 1.27 \ \text{(to nearest hundredth)}
2. The frequency table shows the number of puppies in 21 litters. Find the mean number of puppies. Give your answer to the nearest hundredth.
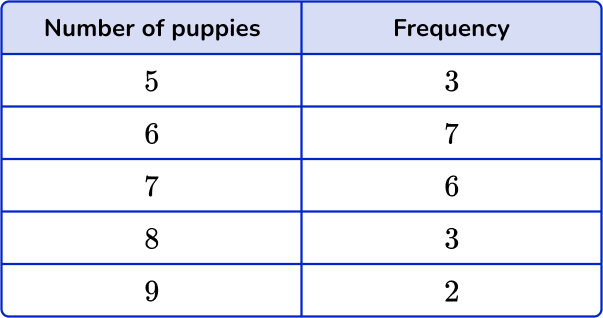
You need to multiply the numbers by the frequencies and find the total. Then divide the total by n, the frequency total.
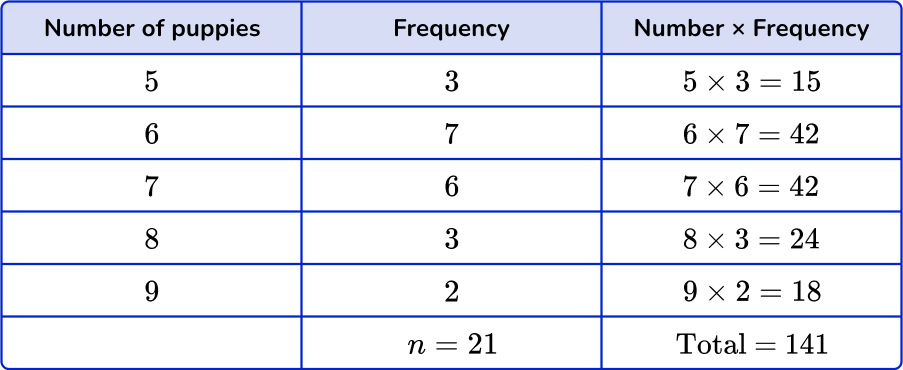
\text{Mean}=\cfrac{\text{total}}{n}=\cfrac{141}{21}=6.714… = 6.71 \ \text{(to nearest hundredth)}
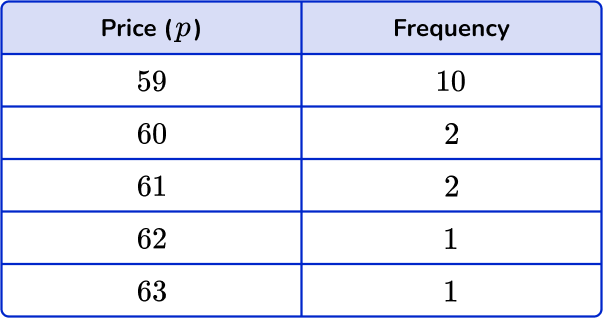
3. The frequency table shows the price of a can of biscuits in 16 different grocery stores. Find the mean price. Give your answer to the nearest tenth.
You need to multiply the numbers by the frequencies and find the total. Then divide the total by n, the frequency total.
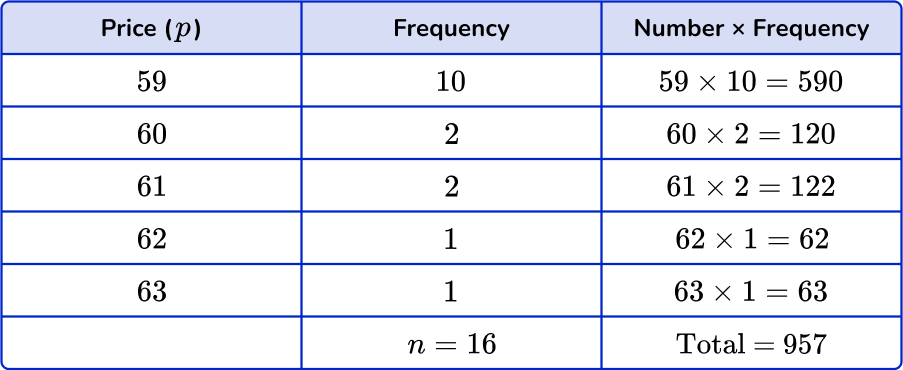
\text{Mean}=\cfrac{\text{total}}{n}=\cfrac{957}{16}=59.81… = 59.8 \ \text{(to nearest tenth)}
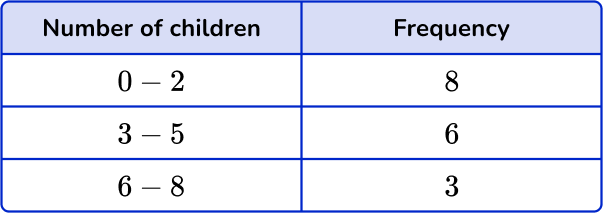
4. The grouped frequency table shows the number of children in 17 families. Estimate the mean number of children. Give your answer to the nearest hundredth.
You need to use midpoints. Multiply the midpoints by the frequencies and find the total. Then divide the total by n, the frequency total.
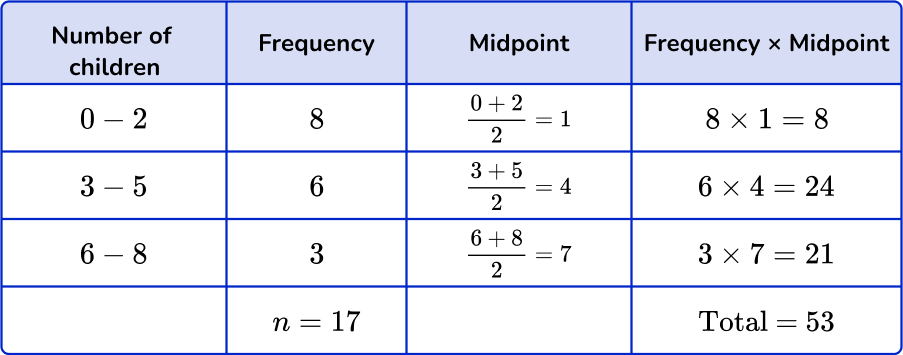
\text{mean}=\cfrac{\text{total}}{n}=\cfrac{53}{17}=3.117… = 3.12 \ \text{(to nearest hundredth)}
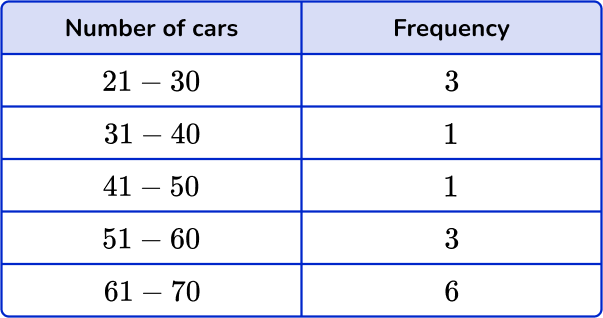
5. The grouped frequency table shows numbers of cars at midday in a parking lot over 14 days. Estimate the mean number of cars. Give your answer to the nearest tenth.
You need to use midpoints. Multiply the midpoints by the frequencies and find the total. Then divide the total by n, the frequency total.
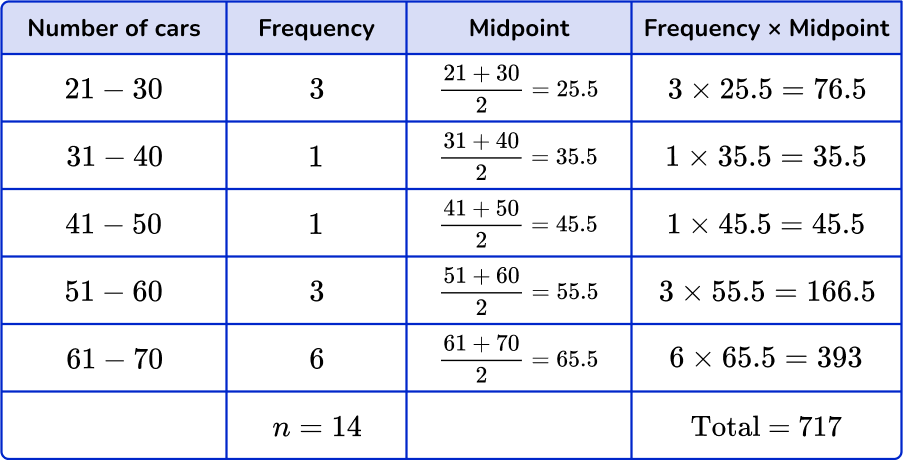
\text{Mean}=\cfrac{\text{total}}{n}=\cfrac{717}{14}=51.214… = 51.2 \ \text{(to nearest tenth)}
6. The grouped frequency table shows weights of 21 newborn babies. Estimate the mean weight of newborn babies. Give your answer to the nearest hundredth.
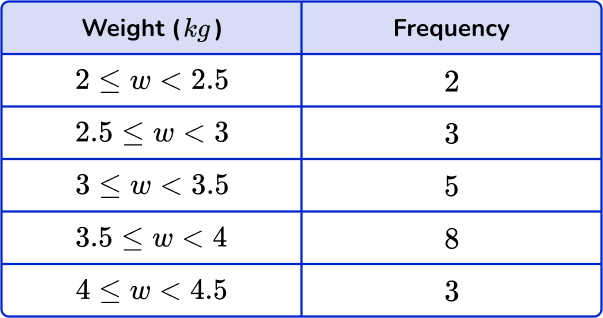
3.5 to 4
You need to use midpoints. Multiply the midpoints by the frequencies and find the total. Then divide the total by n, the frequency total.
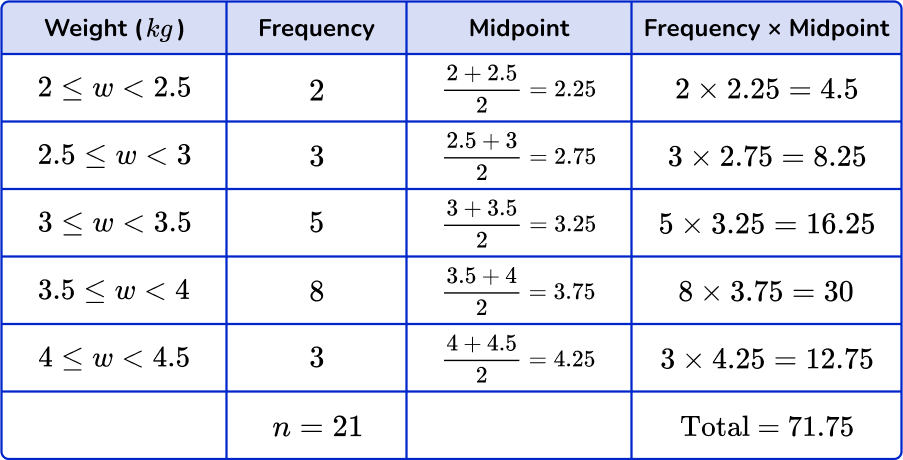
\text{Mean}=\cfrac{\text{total}}{n}=\cfrac{71.75}{21}=3.4166… = 3.42 \ \text{(to nearest hundredth)}
Mean from frequency table FAQs
While a frequency table is not a type of graph, the data that is recorded within a frequency table can be used to create graphs, including box plots, histograms, stem-and-leaf plots, dot plots, and many more.
Grouped data is when the data is given in the form of class intervals, such as 0 \text{-}5, 6 \text{-}10, etc. Ungrouped data refers to when the data is given as individual data points or values.
Class intervals are the organized groups of the numerical data. They can have the same or different class widths, but must not overlap.
The standard deviation is a value that summarizes the variation around the mean. It is another measure that can be calculated from the data in frequency tables.
The next lessons are
- Frequency graph
- Types of sampling
- Probability
- Measurement and data
- Units of measurement
Still stuck?
At Third Space Learning, we specialize in helping teachers and school leaders to provide personalized math support for more of their students through high-quality, online one-on-one math tutoring delivered by subject experts.
Each week, our tutors support thousands of students who are at risk of not meeting their grade-level expectations, and help accelerate their progress and boost their confidence.

Find out how we can help your students achieve success with our math tutoring programs.
[FREE] Common Core Practice Tests (3rd to 8th Grade)
Prepare for math tests in your state with these 3rd Grade to 8th Grade practice assessments for Common Core and state equivalents.
Get your 6 multiple choice practice tests with detailed answers to support test prep, created by US math teachers for US math teachers!