Here you will learn about modal class, including what it is and how to find the modal class from a grouped frequency table.
Students will first learn about modal class as part of statistics and probability in 6 th grade.
What is modal class?
In statistics, the modal class is the class interval within a set of data that has the highest frequency. This means it contains the most number of data points.
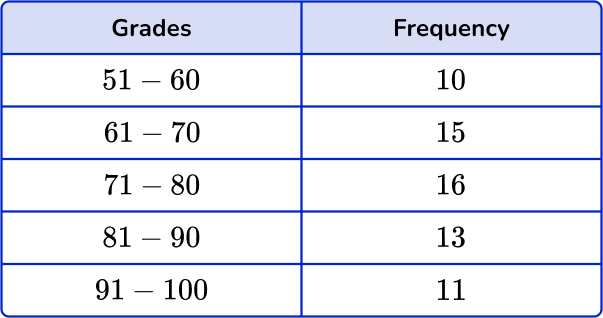
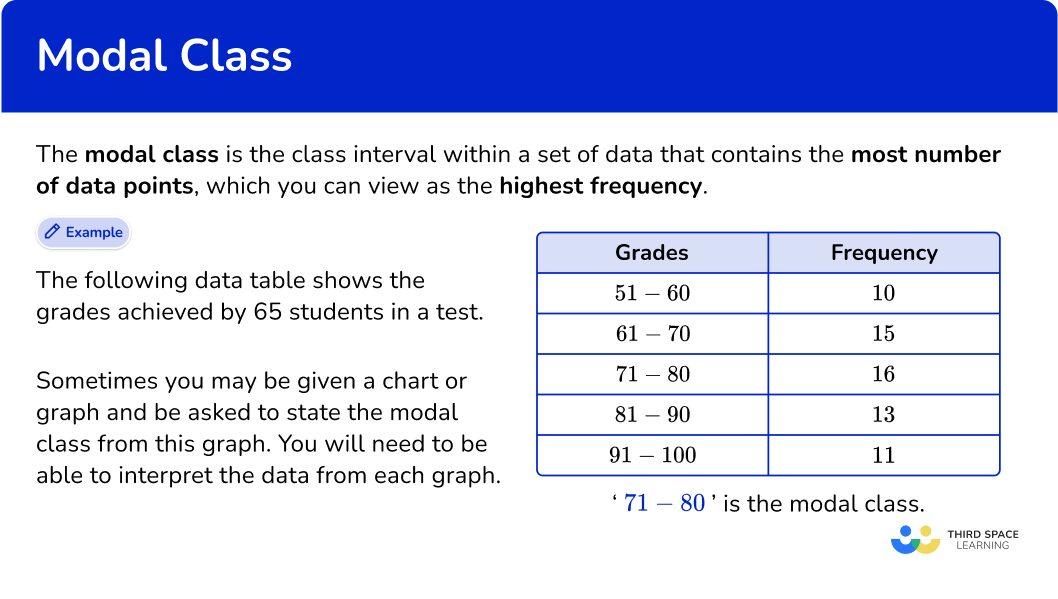
For example, below you have a set of data showing the grades achieved by 65 students in a test.
The class interval with the most number of data points is ‘71 to 80’ as this class interval has the highest frequency of 16 (the class interval contains 16 items of data).
You would therefore state:
The modal class is 71 to 80.
Modal class from a graph / chart
Given a bar chart, a pie chart, a stem-and-leaf plot, a frequency polygon, a cumulative frequency curve, or even a histogram, you can state the modal class. To do this, you will need to interpret the data from each graph.
Below is a table summarizing how to state the modal class from common types of graph / chart.
Type of chart
The modal class is…
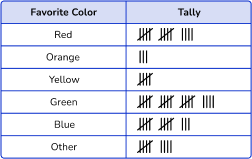
Tally chart
… the class interval with the most tally marks.
(Here, the modal class is ‘Green’).
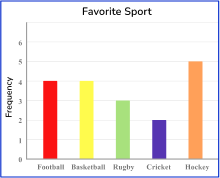
Bar chart
… the class interval with the highest bar.
(Here, the modal class is ‘Hockey’).
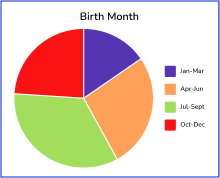
Pie chart
… the class interval with the largest angle / area.
(Here, the modal class is ‘Apr-Jun’).
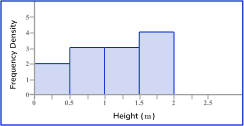
Histogram
… the class interval with the tallest bar.
(Here, the modal class is 1.5 m < x < 2m).
What is modal class?
Common Core State Standards
How does this relate to 6 th grade math?
Grade 6: Statistics and Probability (6.SP.B.5c) Giving quantitative measures of center (median and/or mean) and variability (interquartile range and/or mean absolute deviation), as well as describing any overall pattern and any striking deviations from the overall pattern with reference to the context in which the data were gathered.
How to find the modal class
In order to find the modal class:
Look for the class interval with the highest frequency.
Write down the modal class.
[FREE] Modal Class Worksheet (Grade 6)
Use this worksheet to check your 6th grade students’ understanding of the modal class. 15 questions with answers to identify areas of strength and support!
Use this worksheet to check your 6th grade students’ understanding of the modal class. 15 questions with answers to identify areas of strength and support!
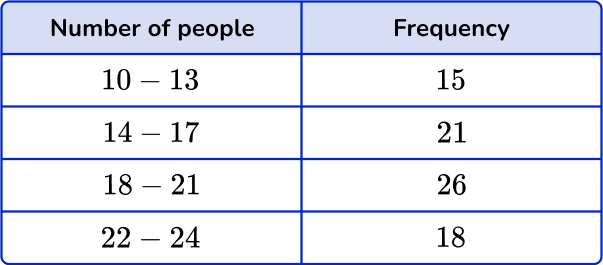
The grouped frequency table shows the number of people in 80 shops in a town.
State the modal class from the following table:
Look for the class interval with the highest frequency.
The highest frequency is 26.
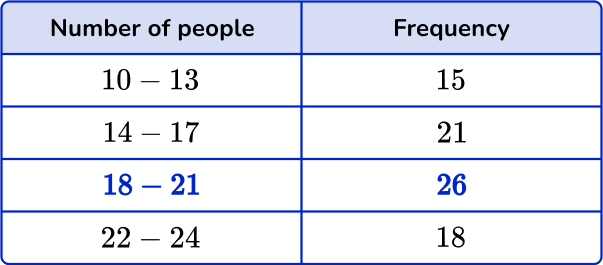
2Write down the modal class.
The class with the highest frequency is ‘18 to 21’.
The modal class is ‘18 to 21’.
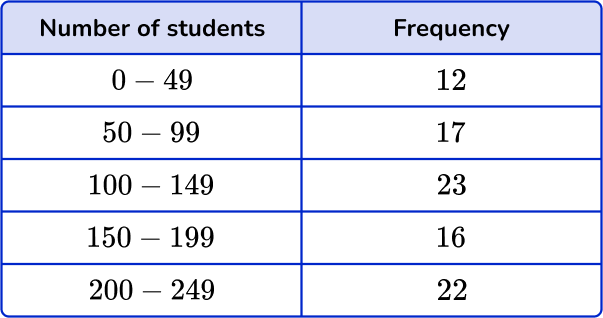
Example 2: modal class from a frequency table
The grouped frequency table shows the number of students in 90 elementary schools in an area.
State the modal class from the following set of data:
The highest frequency is 23.
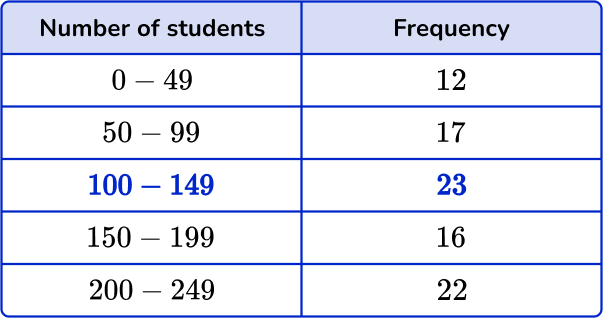
The associated class with the highest frequency is ‘100 - 149’.
The modal class is ‘100 - 149’.
Example 3: modal class from a frequency table
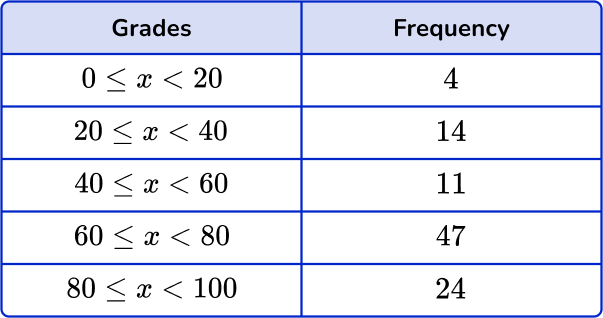
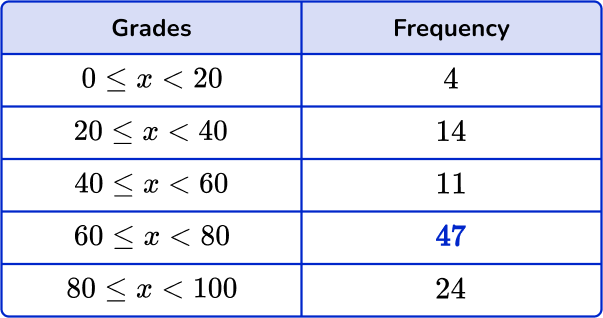
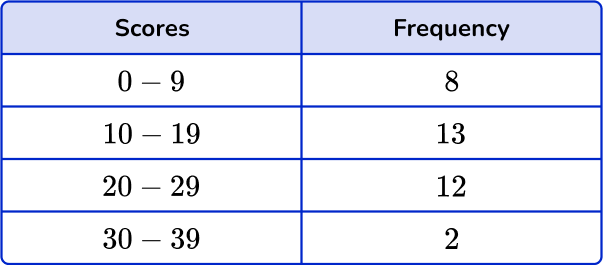
The grouped frequency table shows the grades achieved by 100 students in their science test.
State the modal class from the results table below:
The highest frequency is 47.
The associated class with the highest frequency is ‘60\le x<80’
The modal class is ‘60\le x<80’.
How to find the modal class from a graph / chart
In order to find the modal class from a graph / chart, you need to:
Look for the specific feature for the mode on the graph / chart.
Write down the modal class.
Modal class from a graph or chart examples
Example 4: modal class from a bar chart
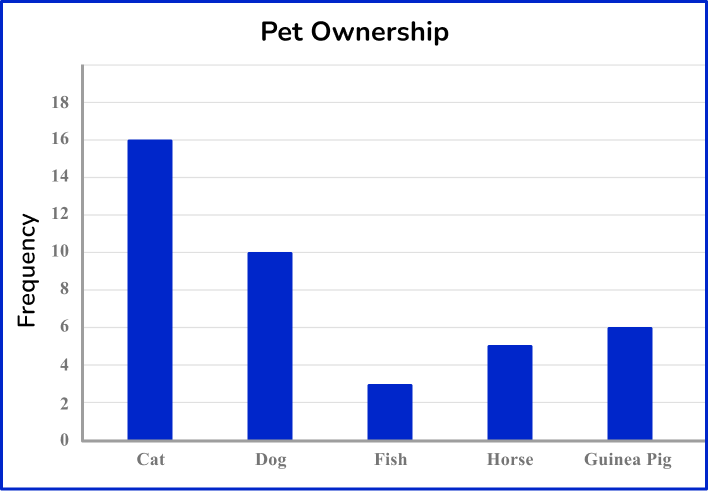
The bar chart below shows the frequencies of pet ownership from a group of people. Each person owns one pet. State the modal class from the given data in the bar chart below.
The category with the highest frequency is ‘Cat’.
The modal class is Cat.
Example 5: modal class from a pie chart
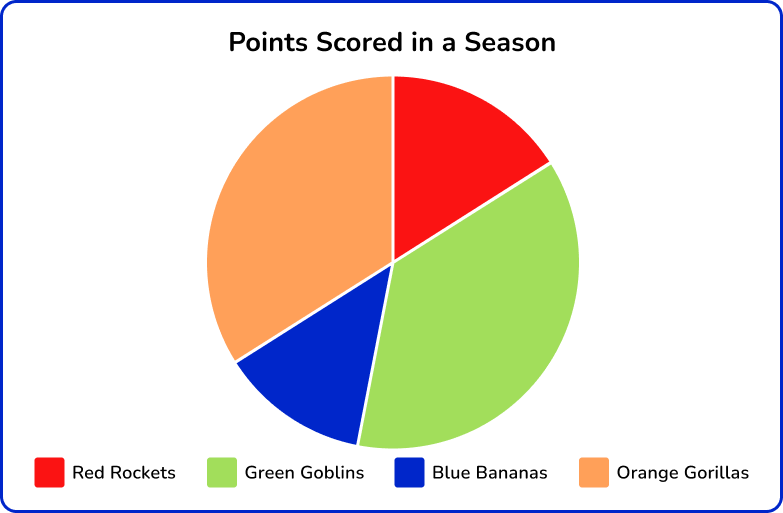
The points a basketball team scored in a season are recorded in a pie chart. Using the information below, determine the modal class for the set of data.
The largest segment of the pie chart is green, which represents the points scored by the Green Goblins.
The modal class is the Green Goblins.
Example 6: modal class from a histogram
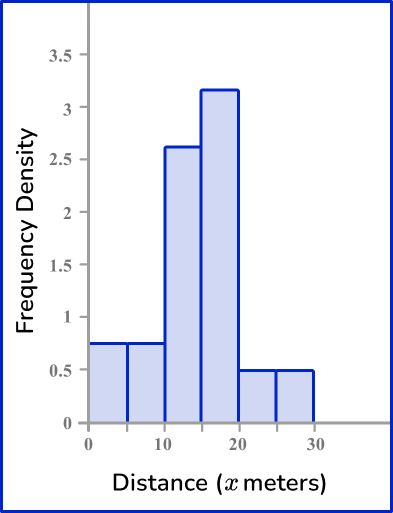
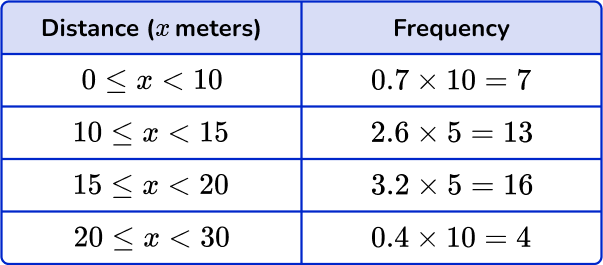
The histogram below represents the distance a ball was thrown by 40 people. State the frequency of the modal class.
The class interval for a histogram with the highest frequency has the largest area (as the area of each bar is the frequency of the class).
The modal class is 15 \leq x<20.
Teaching tips for modal class
Before diving into finding the modal class, make sure students have a firm grasp on the basics of statistics, including what raw data is, how to create and read frequency tables, and what class intervals are.
Provide step-by-step instructions to students on how to find the modal class. This includes displaying the information within the classroom for students to refer back to when needed.
For students who need to hear information more than once, recording a tutorial for them to refer back to when needed, or provide the recording to math tutors who can help reinforce the learning.
Easy mistakes to make
Thinking there can only be one mode of grouped data A data set can have no modes, one mode, or more than one mode. A data set with no modes means you will not use the mode as a measure of central tendency.
Mode is not the same as frequency Students may get confused between mode and frequency. It’s important to reinforce that the mode will be actual data points – NOT the frequency.
Using the wrong class intervals notation The class intervals used in grouped frequency tables can be written in different ways. Take care when writing them. For example, 0 to 5 0 - 5 0\le x <5
Confusing the modal class with finding the frequency that occurs most often A number may appear more than once in a frequency column. This does NOT affect the modal class. The modal class is always indicated by the largest frequency, not the frequency that occurs the most often. For example,
The modal class is ‘20 to 29’ as this interval has the highest frequency. (You do not need to consider the fact that the frequency ‘5’ appears twice in the frequency column.)
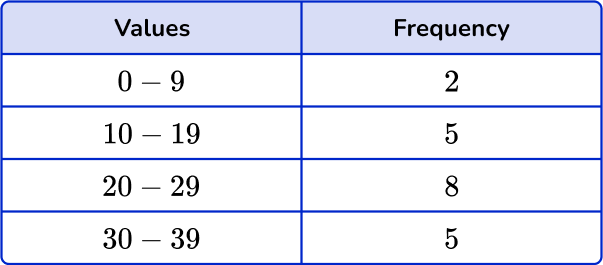
1. The table shows the grouped data about the scores in 35 netball matches. State the modal class interval.
13
12
20 to 29
10 to 19
The highest frequency is 13. The associated class is ‘10 to 19’. So the modal class is ‘10 to 19’.
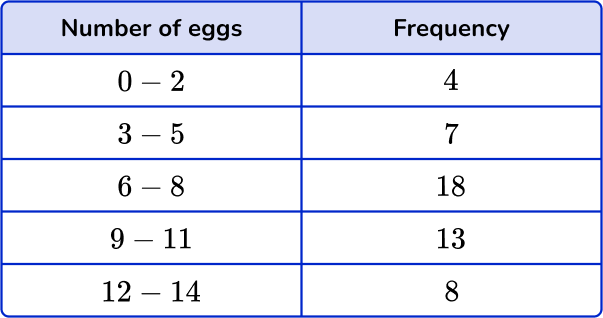
2. The table shows the grouped data about the number of eggs laid by 50 chickens in two weeks. State the modal class interval.
18
12-14
6-8
9-11
The highest frequency is 18. The associated item is ‘6-8’. So the modal class is ‘6-8’.
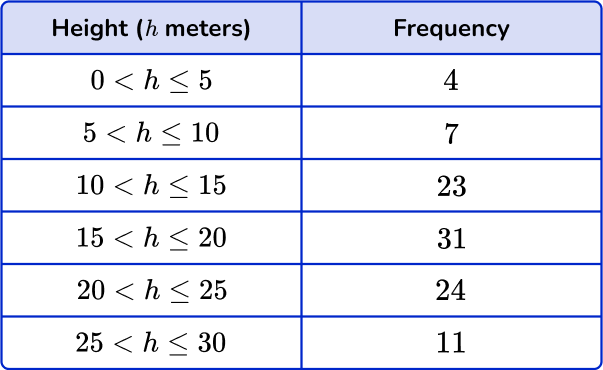
3. The table shows the grouped data about the height of 100 trees in a forest. State the modal class interval.
15<h \leq 20
31
20<h \leq 25
24
The highest frequency is 31. The associated item is ‘15<h \leq 20’. So the modal class is ‘15<h \leq 20’.
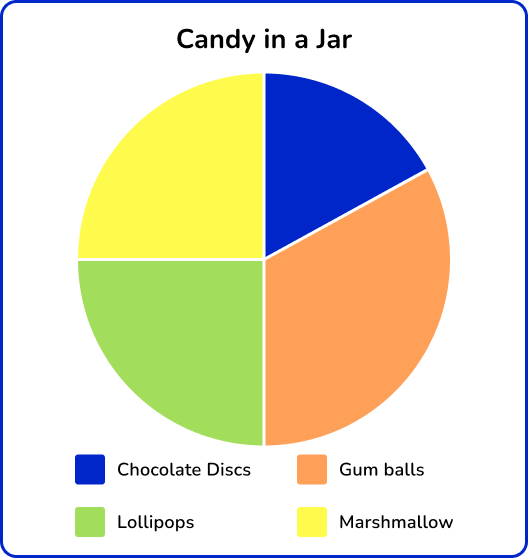
4. The pie chart below shows the number of different types of candy in a jar. State the modal class for the pie chart.
Chocolate Discs
Gum Balls
Lollipops and Marshmallows
Lollipops
The largest segment of the circle is orange, which represents gum balls. (Angle 120^{\circ} ).
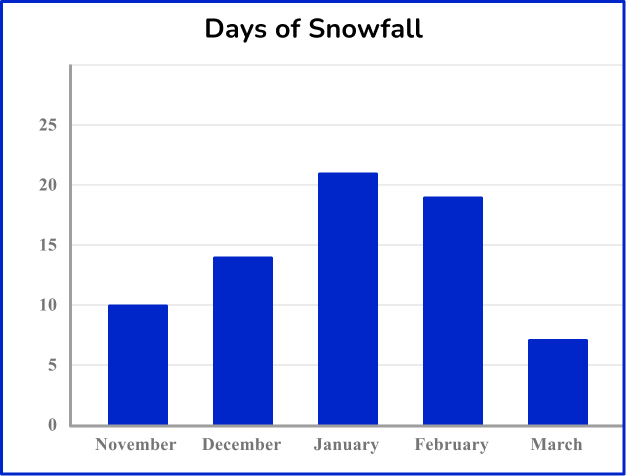
5. Data was recorded for the days of snowfall over winter in the town of Courtship from November to March. State the modal class.
December
February
January
November
The modal class has the highest frequency on the given bar chart.
The modal class is January because it has the highest bar.
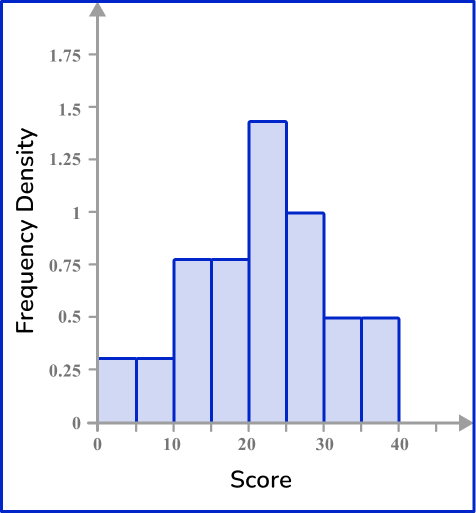
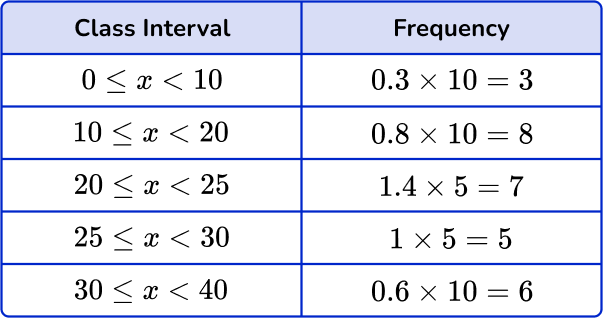
6. The histogram below represents the data collected for a recent score on a road safety test.
Determine the modal class of the data.
10 \leq x<20
25 \leq x<30
30 \leq x<40
20 \leq x<25
The modal class has the largest area. The area of each class is:
The class interval with the largest area / highest frequency is 10 \leq x<20.
Modal class FAQs
What is the standard deviation?
The standard deviation is a value that summarizes the variation around the mean. It is another measure that can be calculated from the data in frequency tables.
What is a frequency distribution table?
A frequency distribution table is a chart that summarizes values and the frequency of each of the values.
What are the measures of central tendency?
The measures of central tendency are often known as the mean, median and mode. These measures will help you find the middle, or average, of a given data set.
What is the class interval?
The class interval refers to the size of each class in which a range of a variable is divided. When finding the modal class, the smallest number in a class interval is known as the lower limit of the modal class, and the largest number is known as the higher limit of the modal class.
At Third Space Learning, we specialize in helping teachers and school leaders to provide personalized math support for more of their students through high-quality, online one-on-one math tutoring delivered by subject experts.
Each week, our tutors support thousands of students who are at risk of not meeting their grade-level expectations, and help accelerate their progress and boost their confidence.
We use essential and non-essential cookies to improve the experience on our website. Please read our Cookies Policy for information on how we use cookies and how to manage or change your cookie settings.Accept
Privacy & Cookies Policy
Privacy Overview
This website uses cookies to improve your experience while you navigate through the website. Out of these, the cookies that are categorized as necessary are stored on your browser as they are essential for the working of basic functionalities of the website. We also use third-party cookies that help us analyze and understand how you use this website. These cookies will be stored in your browser only with your consent. You also have the option to opt-out of these cookies. But opting out of some of these cookies may affect your browsing experience.
Necessary cookies are absolutely essential for the website to function properly. This category only includes cookies that ensures basic functionalities and security features of the website. These cookies do not store any personal information.
Any cookies that may not be particularly necessary for the website to function and is used specifically to collect user personal data via analytics, ads, other embedded contents are termed as non-necessary cookies. It is mandatory to procure user consent prior to running these cookies on your website.
![[FREE] Modal Class Worksheet (Grade 6)](https://thirdspacelearning.com/wp-content/uploads/2024/04/Modal-Class-Worksheet-listing-image.png)