High Impact Tutoring Built By Math Experts
Personalized standards-aligned one-on-one math tutoring for schools and districts
In order to access this I need to be confident with:
Mean, median and mode Addition and subtraction Multiplication and division Grouped frequency tableHow to find the median from a frequency table
Here you will learn about the median from a frequency table, including what the median is and how to find it. You will also look at finding the class which contains the median from grouped frequency tables.
Students will first learn about how to find the median from a frequency table as part of statistics and probability in 6 th grade.
What is median from a frequency table?
How to find the median from a frequency table is when you find the median average from a data set which has been organized into a frequency table.
The median is the middle value and is a measure of central tendency, it is a value that can be used to represent a set of data.
You can calculate the median by:
a) Writing down each of the values in the table and crossing off values to find the middle value.
For example,
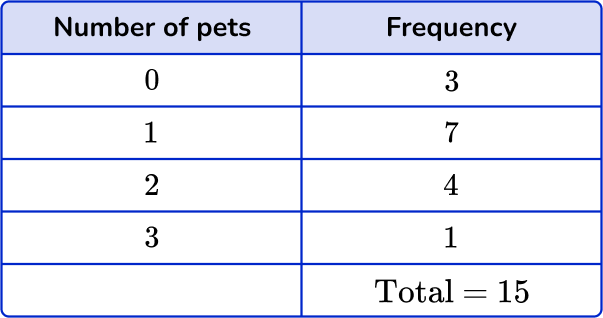
The frequency table shows the number of cars owned by 13 families:
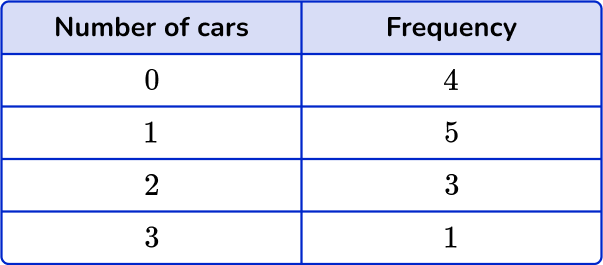
You can use the table to write down each of the values

The middle number is 1, so the median number of cars is 1.
b) Using the median formula and cumulative frequency
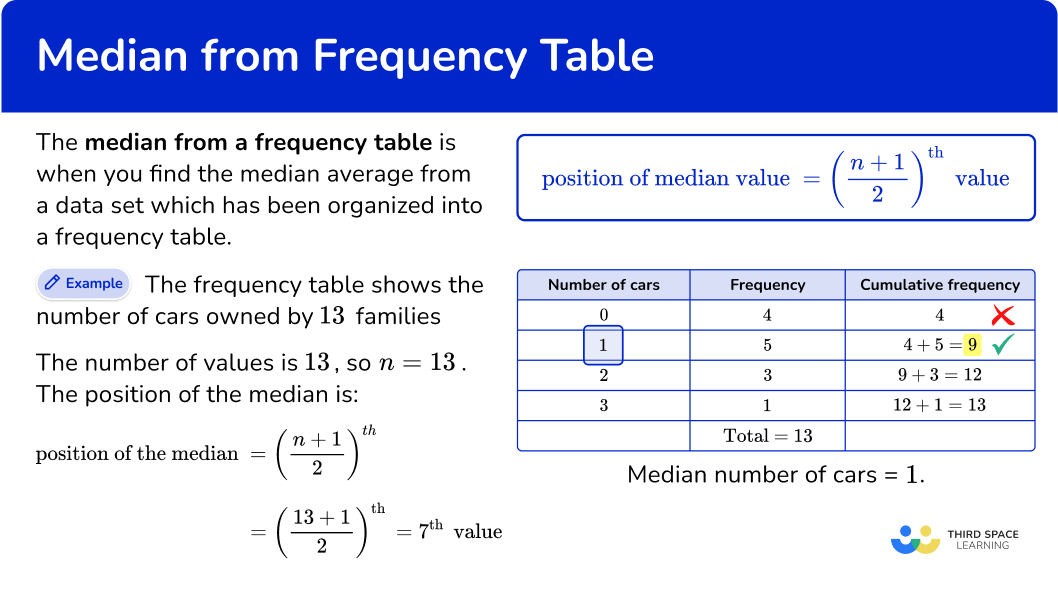
If the data set is large, you can use the formula to work out the position of the median.
\text{Position of the median}=(\cfrac{n+1}{2})^\text{th}, and cumulative frequency to find the actual median value.
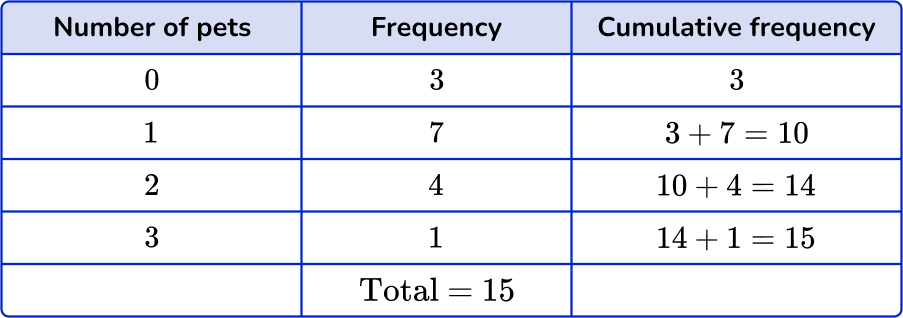
Cumulative frequency is where you add up the numbers in the frequency column as you go down the table.
For example,
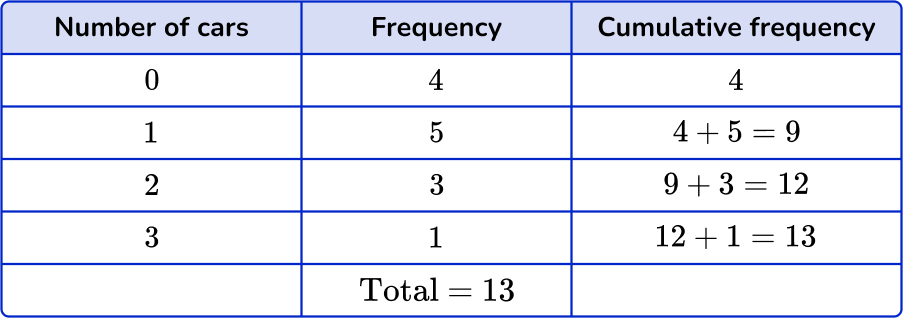
The total number of values is 13, so n=13.
So, the \text{Position of the median}=(\cfrac{n+1}{2})^\text{th}=(\cfrac{13+1}{2})^\text{th}=7^\text{th} \, {value}
The 7^{th} value is in the row of the table that contains the 5^{th}, 6^{th} ,7^{th}, 8^{th}, and 9^{th} values.
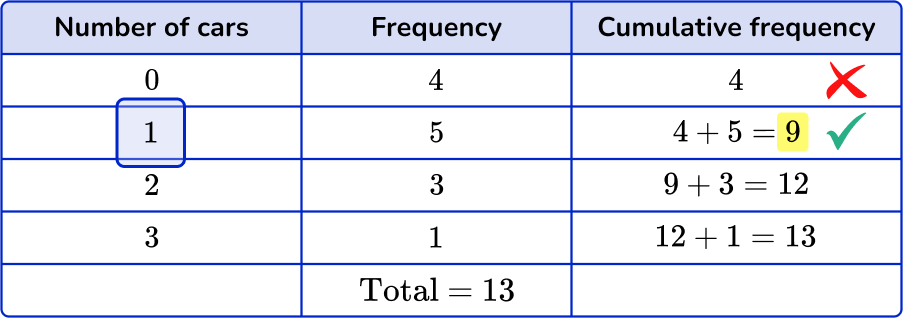
So the median number of cars = 1.
What is median from a frequency table?
Common Core State Standards
How does this relate to 6 th grade math?
- Grade 6: Statistics and Probability (6.SP.A.3)
Recognize that a measure of center for a numerical data set summarizes all of its values with a single number, while a measure of variation describes how its values vary with a single number.
![[FREE] How to Find the Median from a Frequency Table Worksheet (Grade 6 to 8)](https://thirdspacelearning.com/wp-content/uploads/2024/04/How-to-find-the-Median-from-a-Frequency-Table-Worksheet-listing-image.png)
[FREE] How to Find the Median from a Frequency Table Worksheet (Grade 6 to 8)
Use this worksheet to check your grade 6 to 8 students’ understanding of how to find the median from a frequency table. 15 questions with answers to identify areas of strength and support!
DOWNLOAD FREE [FREE] How to Find the Median from a Frequency Table Worksheet (Grade 6 to 8)
Use this worksheet to check your grade 6 to 8 students’ understanding of how to find the median from a frequency table. 15 questions with answers to identify areas of strength and support!
DOWNLOAD FREEHow to find the median from a frequency table
In order to find the median from a frequency table, you need to:
- Find the position of the median: Count the total number of results, add one, and divide this by 2.
- Work out the cumulative frequencies.
- Find the median result.
- Write down the median.
How to find the median from a frequency table examples
Example 1: frequency table – odd number of values
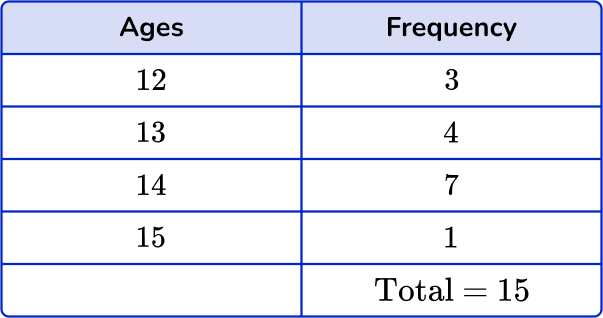
The frequency table shows the ages in years of 15 people in a sports club.
Find the median of age from this set of data.
- Find the position of the median.
There are 15 values, so n=15.
\text{Position of the median}=(\cfrac{n+1}{2})^\text{th}=(\cfrac{15+1}{2})^\text{th}=8^\text{th}
2Work out the cumulative frequencies.
Go down the frequencies, adding them up as you go along.
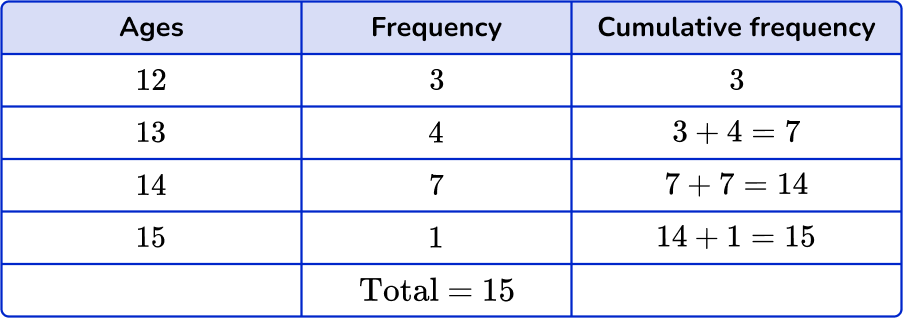
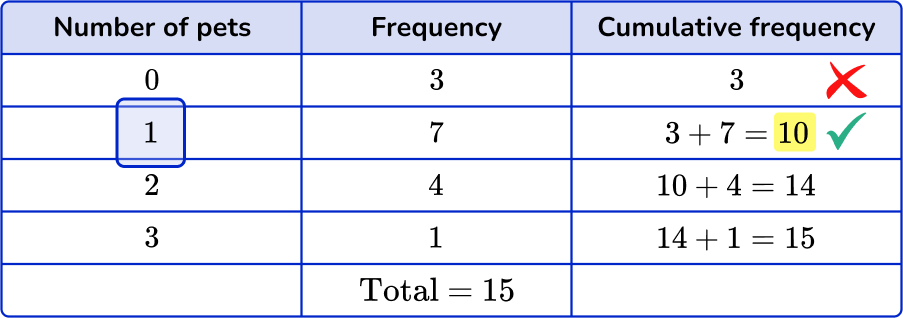
3Find the median result.
Use the cumulative frequencies to find where the 8^{th} value is. This row contains the 8^{th} to 14^{th} values.
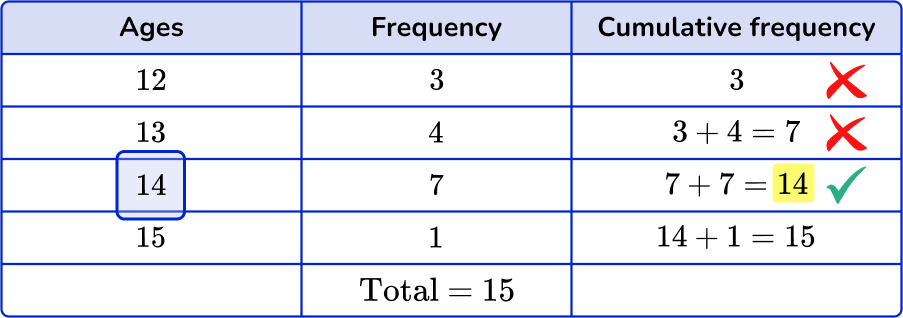
4Write down the median.
The final step is to write down the median value. The median is 14 years.
Example 2: frequency table – odd number of values
The frequency table shows the temperature at midday for 17 days.
Find the median:
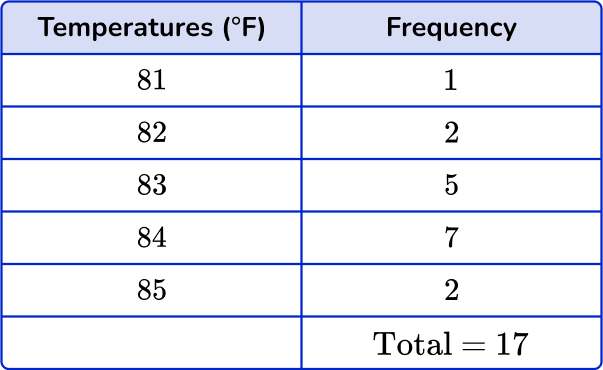
There are 17 values, so n=17.
\text{Position of the median}=(\cfrac{n+1}{2})^\text{th}=(\cfrac{17+1}{2})^\text{th}=9^\text{th}
Go down the frequencies, adding them up as you go along.
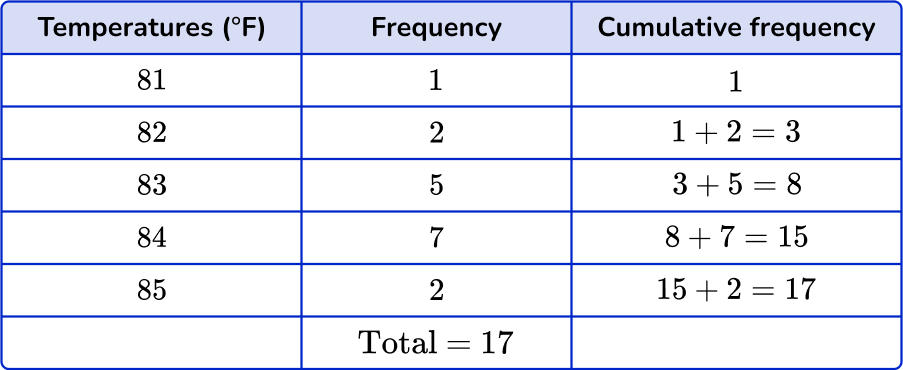
Use the cumulative frequencies to find where the 9^{th} value is. This row contains the 9^{th} to 15^{th} values.
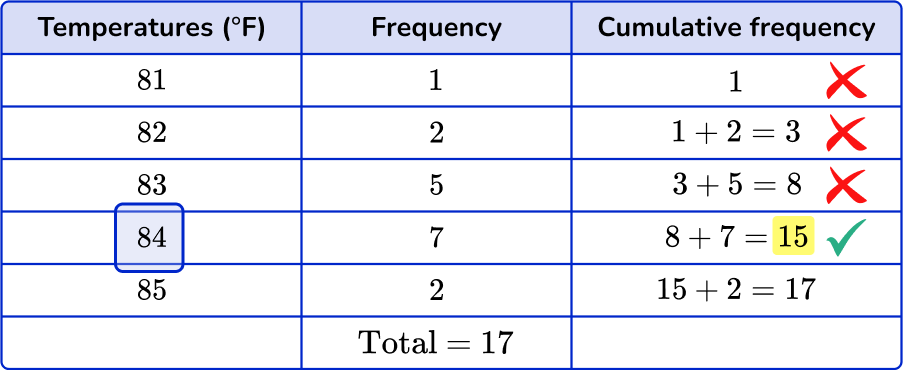
The final step is to write down the median value. The median is 84 degrees F.
Example 3: frequency table – even number of values
The frequency table shows the number of people in 12 train carriages.
Find the median:
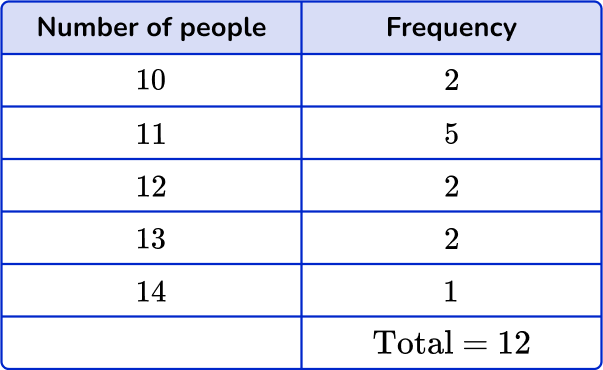
There are 12 values, so n=12.
\text{Position of the median}=(\cfrac{n+1}{2})^\text{th}=(\cfrac{12+1}{2})^\text{th}=6.5^\text{th}
Look for the 6^{th} and 7^{th} values.
Go down the frequencies, adding them up as you go along.
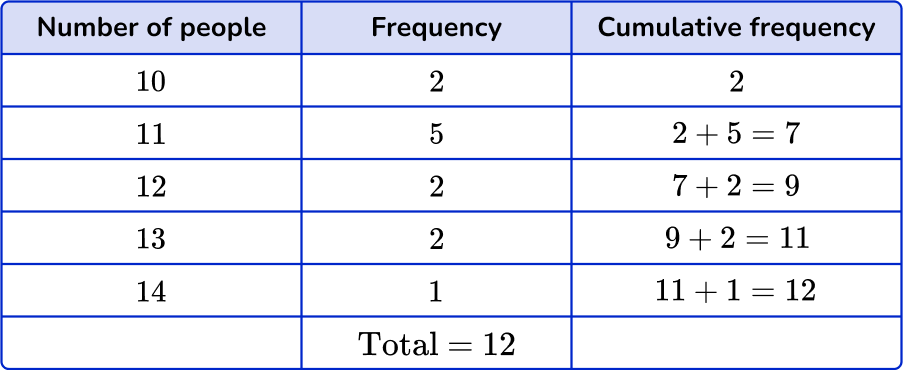
Use the cumulative frequencies to find where the 6^{th} and 7^{th} values are. This row contains the 3^{rd} to 7^{th} values.

The final step is to write down the median value. The median is 11 people.
Example 4: grouped data
The grouped frequency table shows the ages of 23 people at an event.
Find the class interval which contains the median:
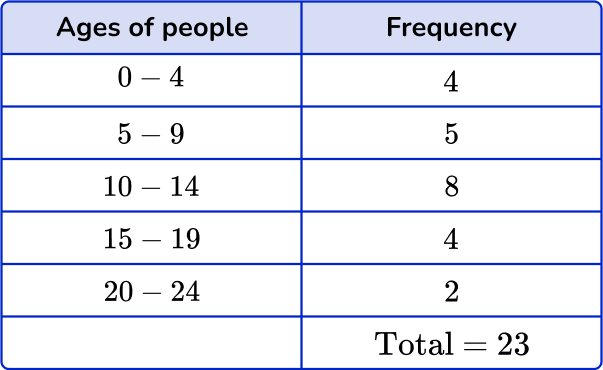
There are 23 values, so n=23.
\text{Position of the median}=(\cfrac{n+1}{2})^\text{th}=(\cfrac{23+1}{2})^\text{th}=12^\text{th}
You need to look for the 12^{th} value.
Go down the frequencies, adding them up as you go along.
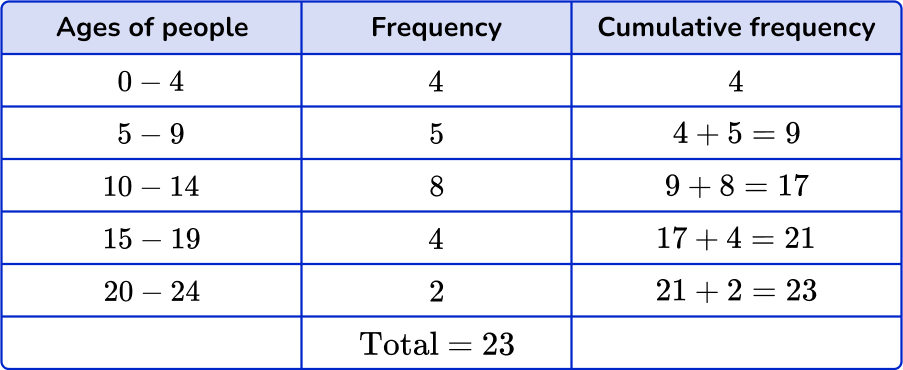
Use the cumulative frequencies to find where the 12^{th} value is. This row contains the 10^{th} to 17^{th} values.
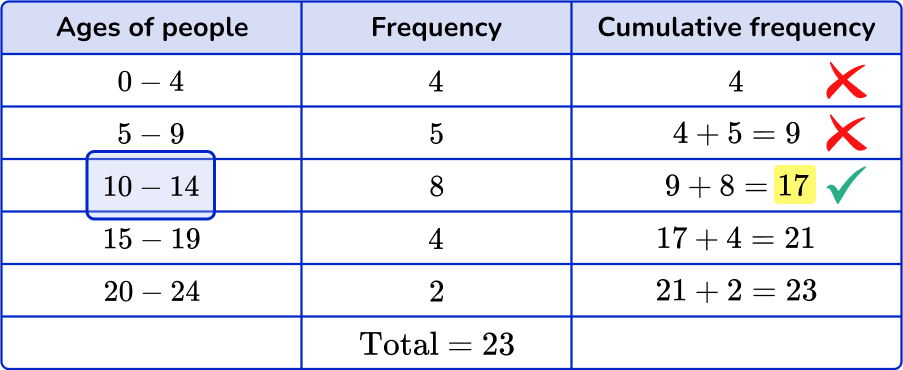
The final step is to write down the class interval which contains the median value.
The median is in the class interval 10-14.
Example 5: grouped frequency table – odd number of values
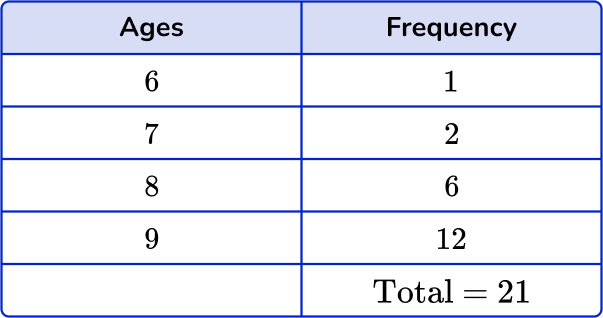
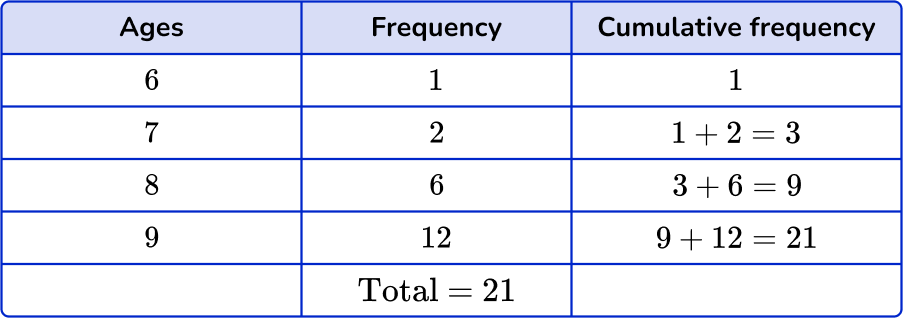
The grouped frequency table shows the time spent by 21 students cleaning their rooms.
Find the class interval which contains the median:
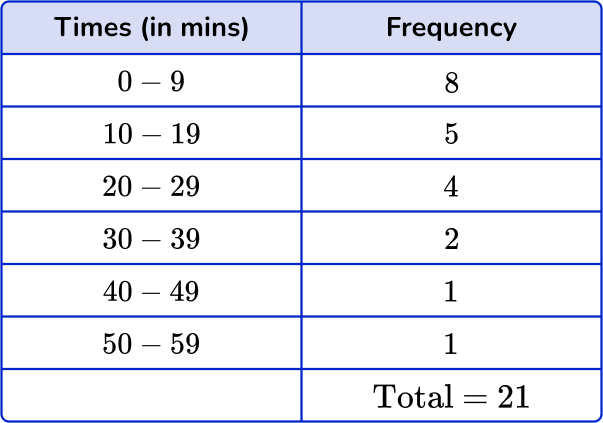
There are 21 values, so n=21.
\text{Position of the median}=(\cfrac{n+1}{2})^\text{th}=(\cfrac{21+1}{2})^\text{th}=11^\text{th}
Look for the 11^{th} value.
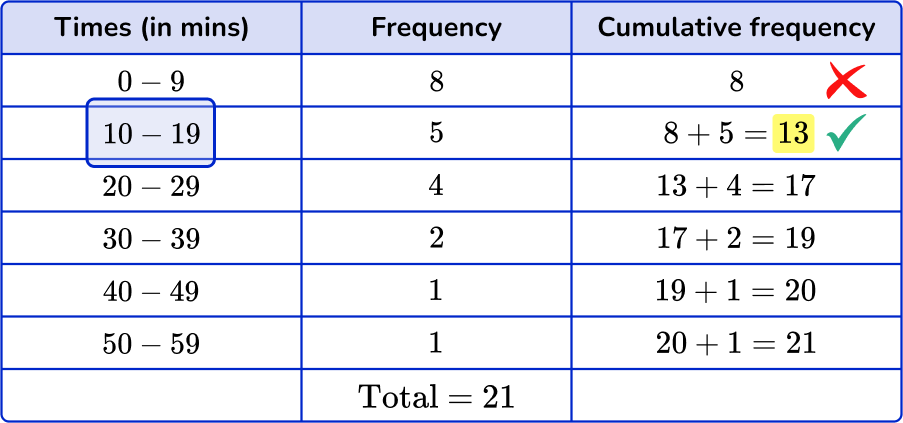
Go down the frequencies, adding them up as you go along.
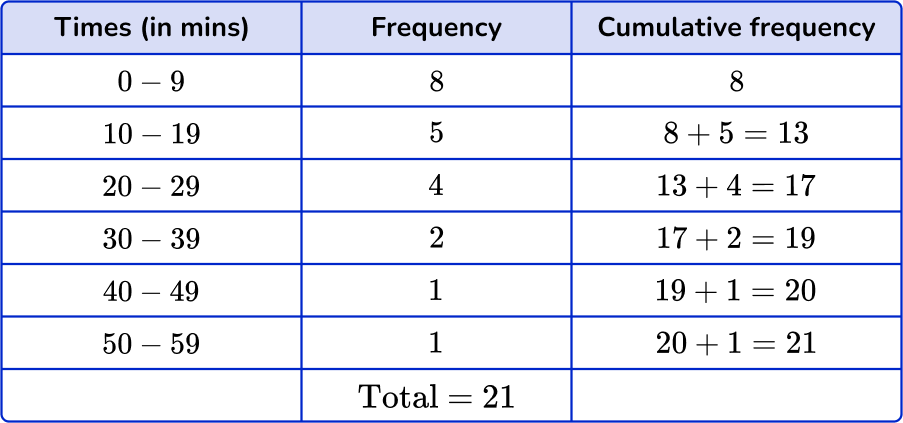
Use the cumulative frequencies to find where the 11^{th} value is. This row contains the 9^{th} to 13^{th} values.
The final step is to write down the class interval which contains the median value.
The median is in the class interval 10 to 19.
Example 6: grouped frequency table – even number of values
The grouped frequency table shows the amount of money 30 people spent in a shop.
Find the class interval which contains the median:
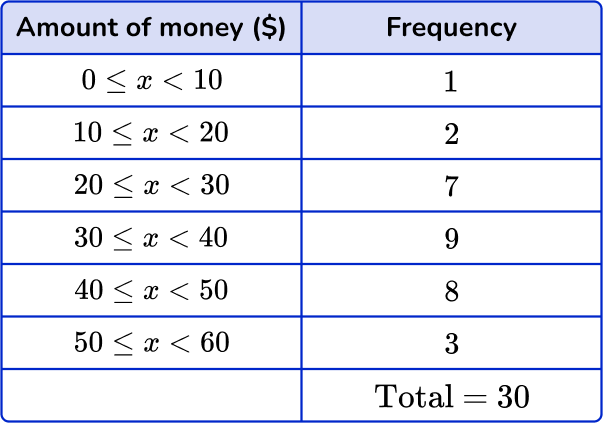
There are 30 values, so n=30.
\text{Position of the median}=(\cfrac{n+1}{2})^\text{th}=(\cfrac{30+1}{2})^\text{th}=15.5^\text{th}
You need to look for the 15^{th} and 16^{th} values.
Go down the frequencies, adding them up as you go along.
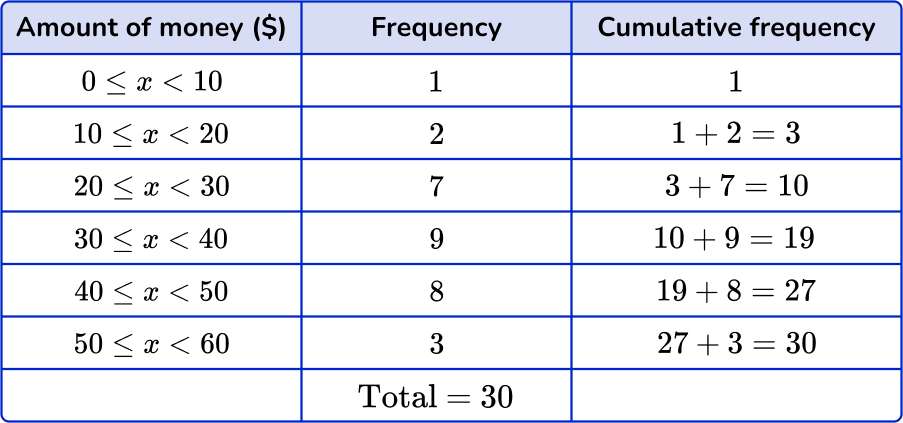
Use the cumulative frequencies to find where the 15^{th} and 16^{th} values are. This row contains the 11^{th} to 19^{th} values.
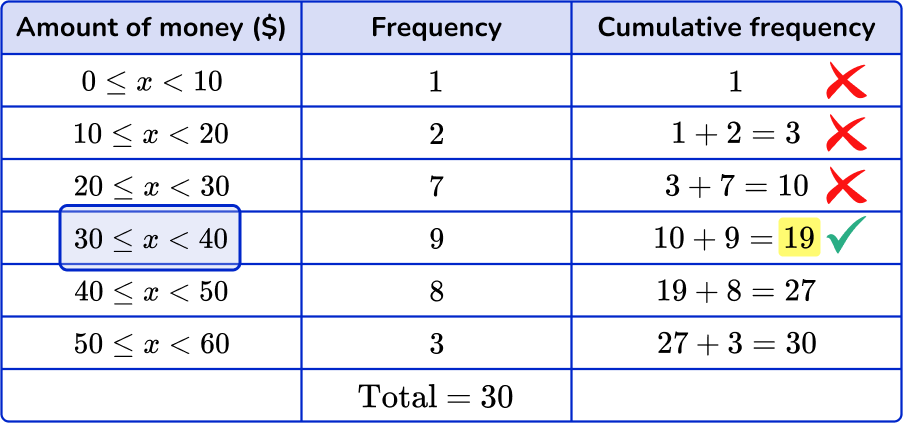
The final step is to write down the class interval which contains the median value.
The median is in the class interval 30 \leq x < 40.
Teaching tips for how to find the median from a frequency table
- Explain the purpose for using frequency tables, including that they are organized in a specific way to show a number of data points or number of observations. Students may be unfamiliar with the cumulative frequency, the total frequency and all frequencies in a frequency distribution.
- When teaching how to find the median from a frequency table, using visualizations, such as histograms, can make it easier for students to see where the middle of the given data set is.
- Providing students with worksheets of different data values or set of numbers to practice finding the median from a frequency table can give students necessary practice.
Easy mistakes to make
- Not putting the data in numerical order when finding the median
When finding the median from a frequency table, if the data is not in an ordered set (often the case with raw data), you will need to put the results in ascending order. This will ensure that you will find the median of the given data set.
- Using mode or mean instead of median
Check if you have been asked for the median, mode or mean average.
- Using the value given by the median formula instead of the position of the median
The value given by the median formula is NOT for the median, but for the position of the median. The formula gives you where the middle value is.
- Not finding the midpoint with an even number of items
When there is an odd number of data there is a single middle value for the median.
When there is an even number of data, there is a middle pair of values and you then need to find the midpoint of these values.
For example,
The middle pair of values is 9 and 13. The mid-point of these is 11. The median is 11.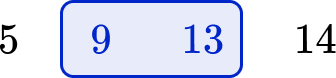
\cfrac{9+13}{2}=\cfrac{22}{2}=11
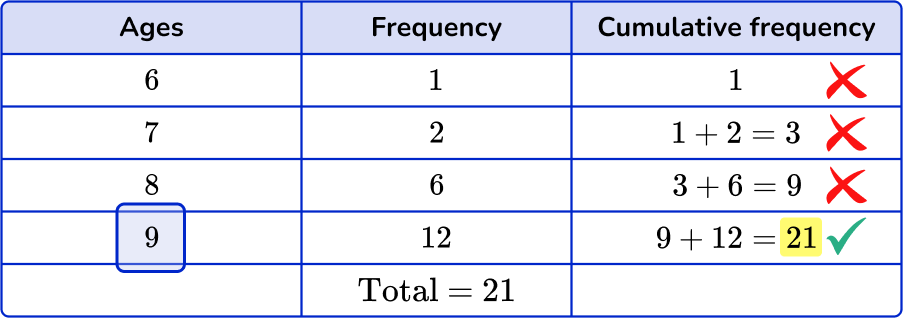
- Ignoring the frequency when finding the median interval
Starting at the lower limit and upper limit on the frequency table and counting inwards to find the middle interval does not account for the frequency of each interval.
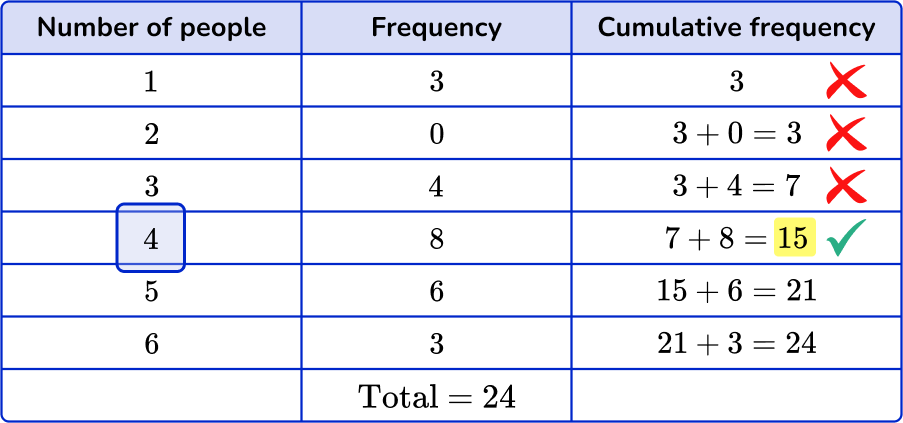
For example,
Looking only at the “Number of people” column to find the median, ignores the frequency of each data point.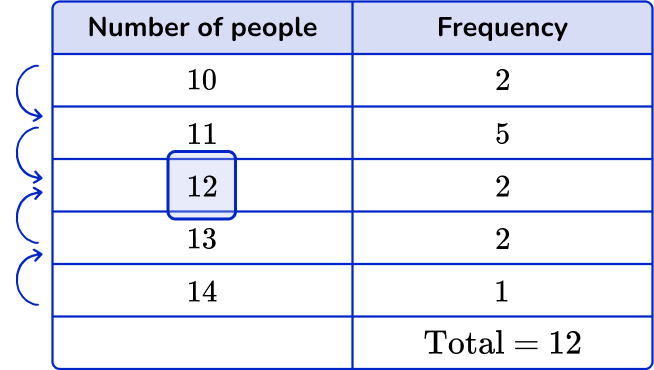
When you consider the frequency, you see that the median is actually another value.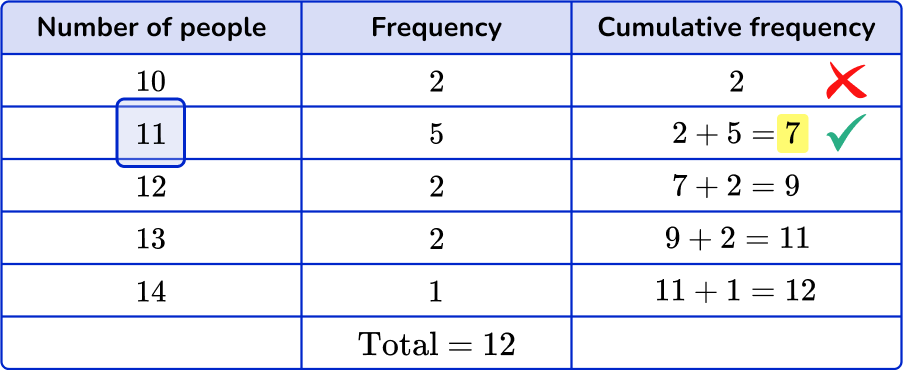
Related frequency table lessons
Practice how to find the median from a frequency table questions
1) The frequency table shows the number of pets of 15 students. Find the median.


You need to find the position of the median. There are 15 values, so n=15.
\text{Median}=(\cfrac{n+1}{2})^\text{th}=(\cfrac{15+1}{2})^\text{th}=8^\text{th}
Find the 8^{th} value.
This row contains the 4^{th} to 10^{th} values.
2) The frequency table shows the ages of children in a drama club. Find the median.
You need to find the position of the median. There are 21 values, so n=21.
\text{Median}=(\cfrac{n+1}{2})^\text{th}=(\cfrac{21+1}{2})^\text{th}=11^\text{th}
Find the 11^{th} value.
3) The frequency table shows the number of people in 24 cars. Find the median.
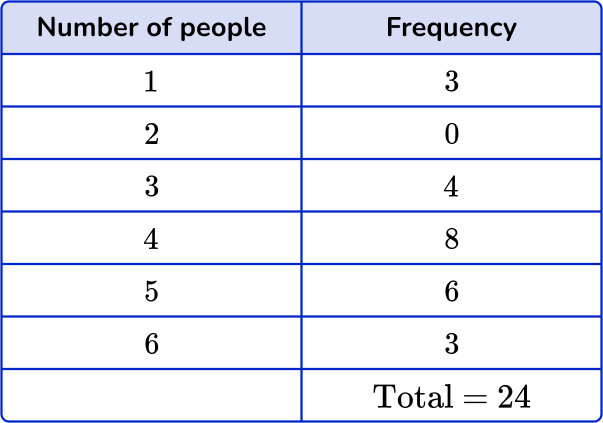
You need to find the position of the median. There are 24 values, so n=24.
\text{Median}=(\cfrac{n+1}{2})^\text{th}=(\cfrac{24+1}{2})^\text{th}=12.5^\text{th}
Find the 12^{th} and 13^{th} values.
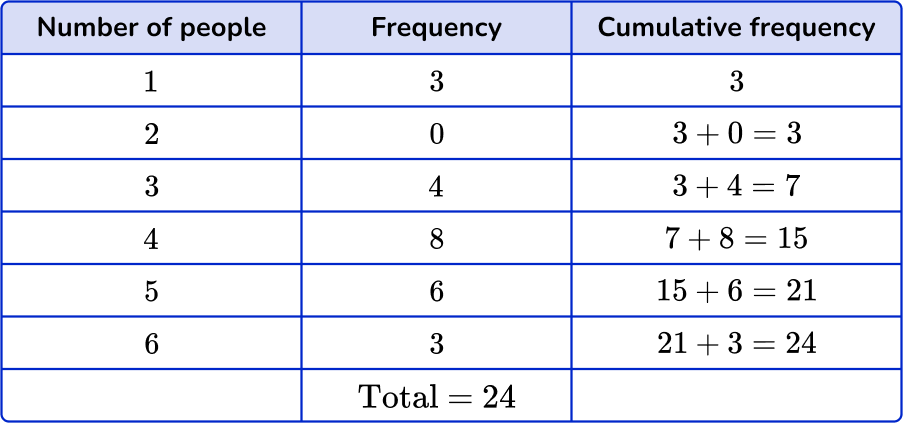
This row contains the 8^{th} to 15^{th} values.
4) The grouped frequency table shows the ages of 11 people at a party. Find the class interval containing the median.
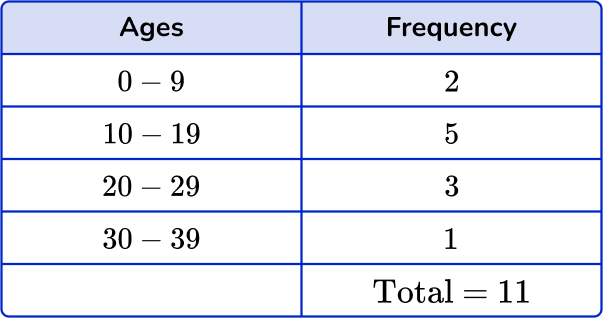
0 to 9
10 to 19
20 to 29
30 to 39
You need to find the position of the median. There are 11 values, so n=11.
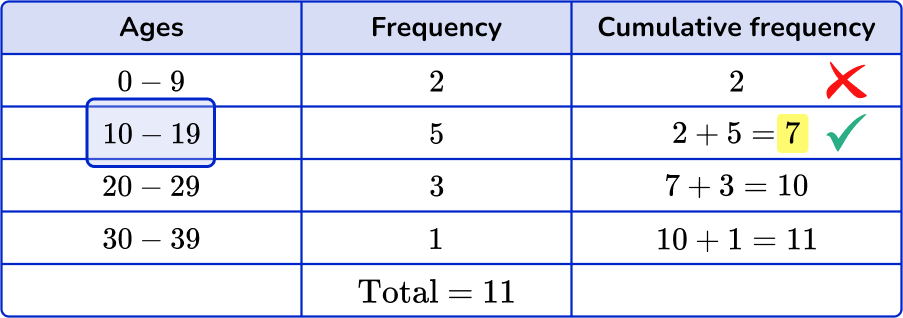
\text{Median}=(\cfrac{n+1}{2})^\text{th}=(\cfrac{11+1}{2})^\text{th}=6^\text{th}
Find the 6^{th} value.
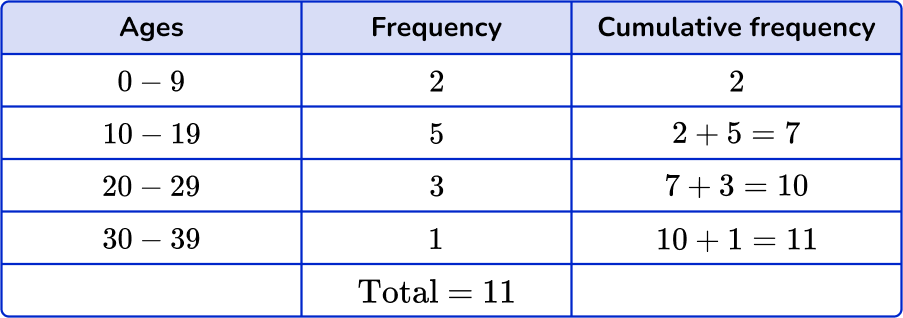
This row contains the 3^{rd} to 7^{th} values.
5) The grouped frequency table shows the scores of 19 rugby games. Find the class interval containing the median.
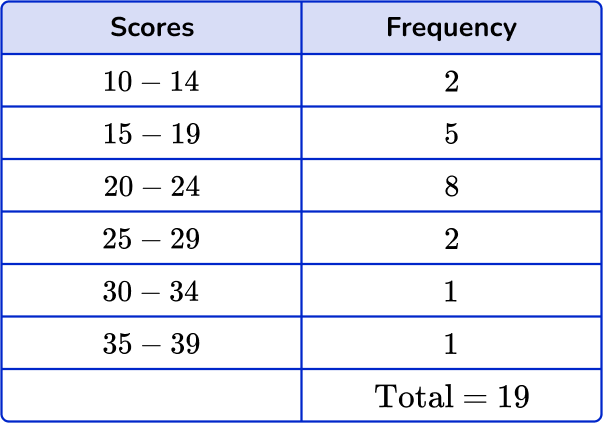
You need to find the position of the median. There are 19 values, so n=19.
\text{Median}=(\cfrac{n+1}{2})^\text{th}=(\cfrac{19+1}{2})^\text{th}=10^\text{th}
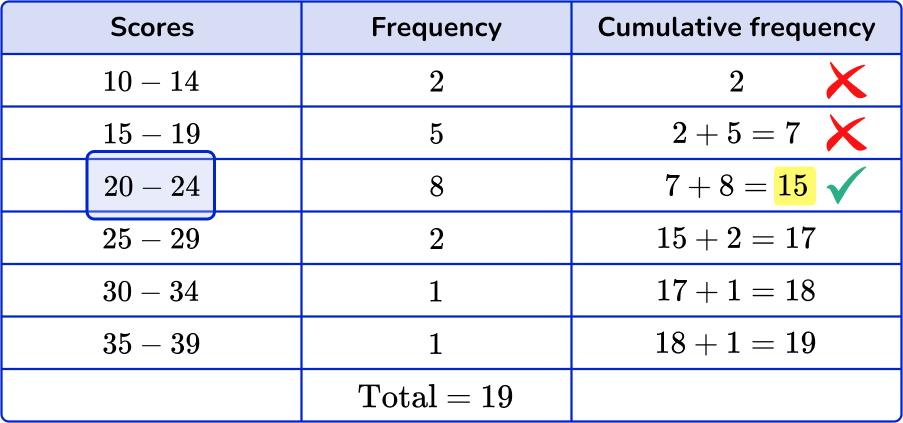
Find the 10^{th} value.
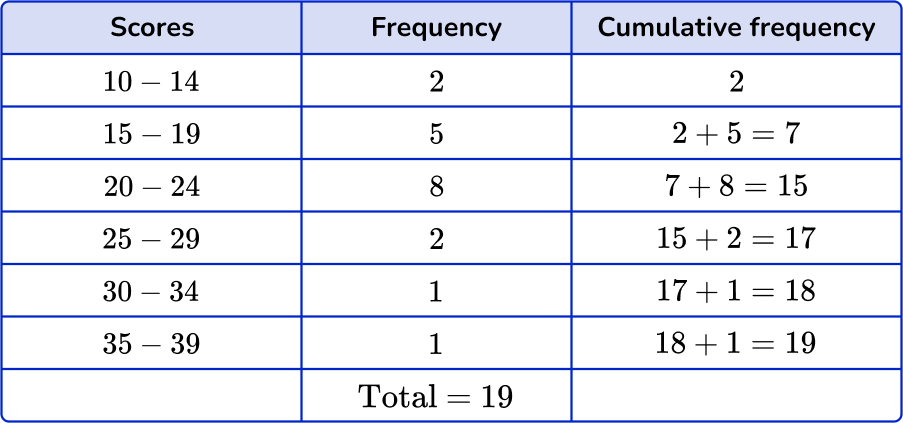
This row contains the 8^{th} to 15^{th} values.
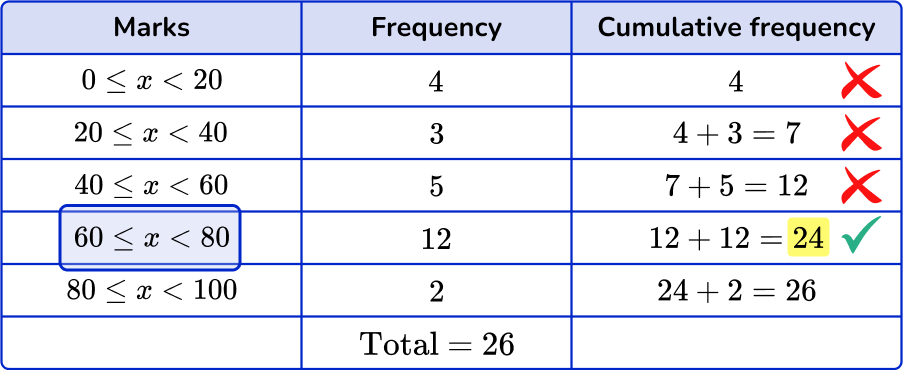
6) The following data shows marks of 26 in a math test. Find the class interval containing the median.
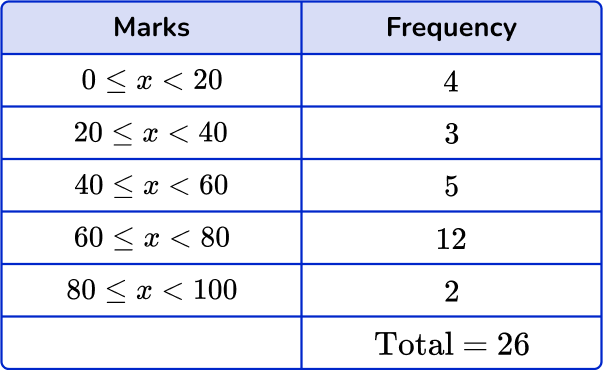
You need to find the position of the median. There are 26 values, so n=26.
\text{Median}=(\cfrac{n+1}{2})^\text{th}=(\cfrac{26+1}{2})^\text{th}=13.5^\text{th}
Find the 13^{th} and 14^{th} values.
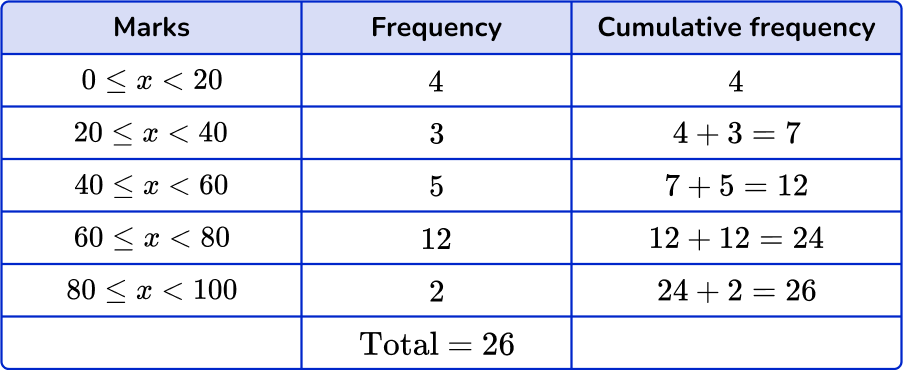
This row contains the 13^{th} to 24^{th} values.
How to find the median from a frequency table FAQs
Frequency tables are not a type of graph, but the data from a frequency table can be used to create graphs.
A frequency distribution table is practically the same thing as a frequency table, except it not only includes the frequencies, but any corresponding values or intervals.
Yes, there are many different real world contexts that would include data with fractions and decimals.
To find the median, add the frequency column to find the total number of results. Add 1. Divide by 2. This will give you the position of the median result. Using the cumulative frequency, you can now find the median result.
The median is the middle result of an ordered list of values. If the total of the number of results in an ordered list is odd, the median value is the middle result with an equal number of results higher and lower. If the total number of results is even, the two middle values must be added together and divided by 2.
The next lessons are
- Frequency graph
- Types of sampling
- Probability
- Measurement and data
- Units of measurement
Still stuck?
At Third Space Learning, we specialize in helping teachers and school leaders to provide personalized math support for more of their students through high-quality, online one-on-one math tutoring delivered by subject experts.
Each week, our tutors support thousands of students who are at risk of not meeting their grade-level expectations, and help accelerate their progress and boost their confidence.

Find out how we can help your students achieve success with our math tutoring programs.
[FREE] Common Core Practice Tests (3rd to 8th Grade)
Prepare for math tests in your state with these 3rd Grade to 8th Grade practice assessments for Common Core and state equivalents.
Get your 6 multiple choice practice tests with detailed answers to support test prep, created by US math teachers for US math teachers!