High Impact Tutoring Built By Math Experts
Personalized standards-aligned one-on-one math tutoring for schools and districts
In order to access this I need to be confident with:
Tally charts DecimalsCollecting data
Inequalities Mean, median and mode RangeGrouped frequency table
Here you will learn about grouped frequency tables, including what grouped frequency tables are and how to make them.
Students will first learn about grouped frequency tables as part of statistics and probability in 6 th grade.
What is a grouped frequency table?
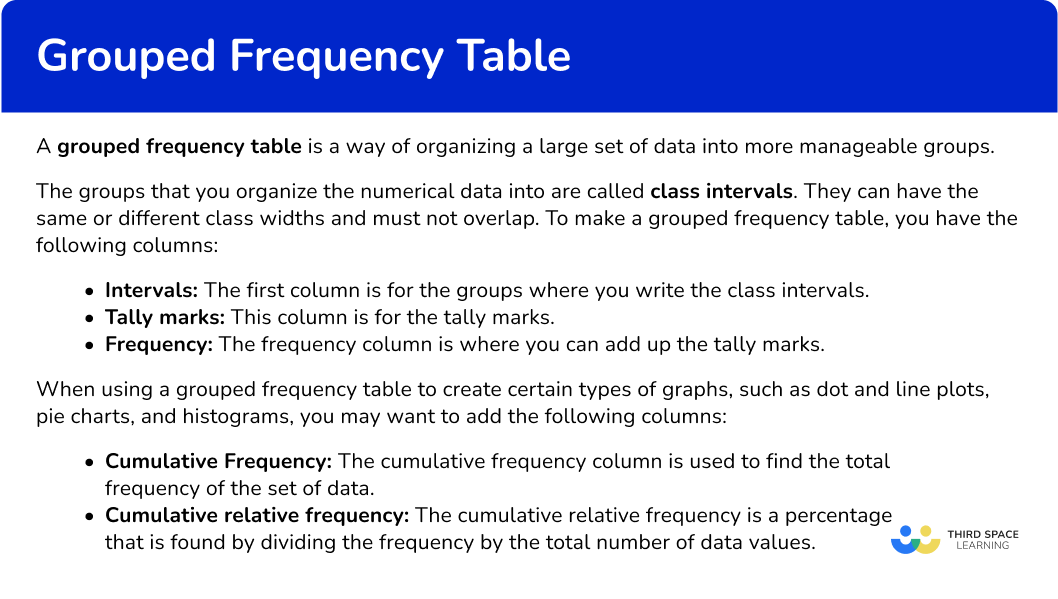
A grouped frequency table (grouped frequency distribution) is a way of organizing a large set of data into more manageable groups.
For example,
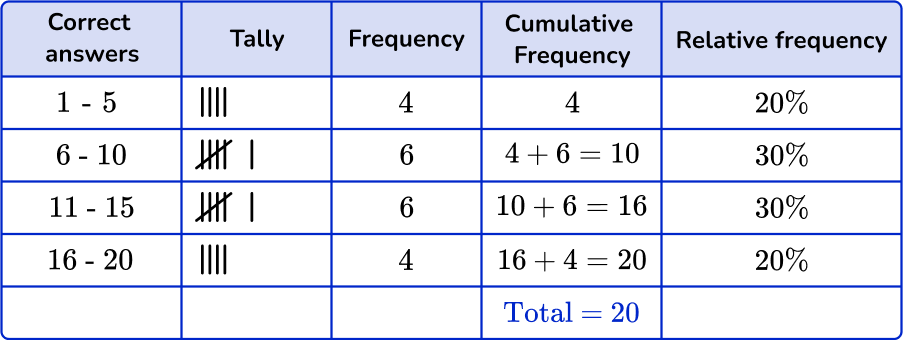
Here are the number of correct answers, out of 20, scored by 20 students on a test.
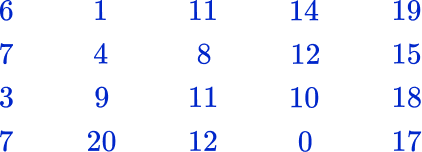
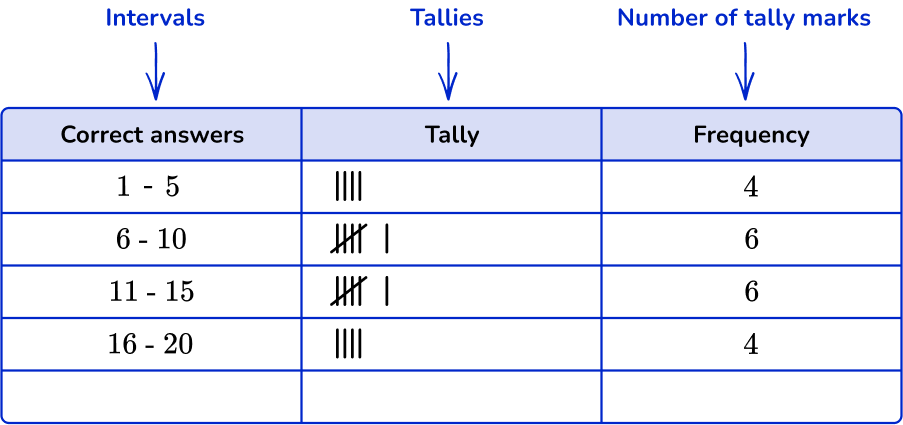
They can be organized into a grouped frequency table like this:
The organized groups of numerical data are called class intervals. They can have the same or different class widths and must not overlap. The lower limit is the smallest value in the data class, and the upper limit is the greatest (highest) data value.
To make a grouped frequency table, you have the following columns:
- Intervals: The first column is for the groups where you write the class intervals.
- Tally marks: This column is for the tally marks.
- Frequency: The frequency column is where you can add up the tally marks.
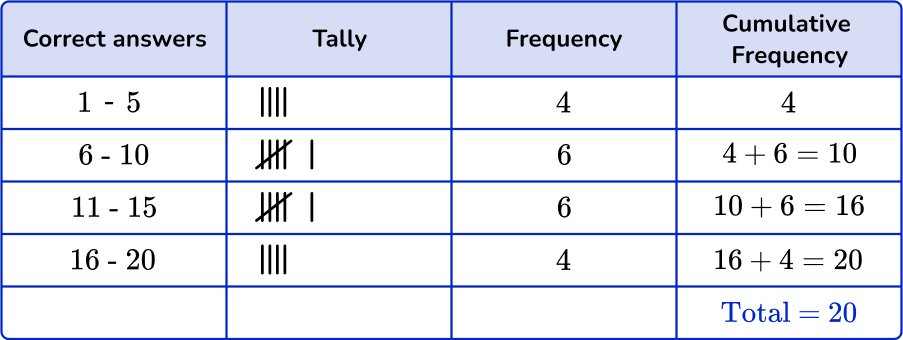
Grouped frequency tables help to organize the data in order to create graphs such as dot plots, pie charts, and histograms. You can add two more columns (cumulative frequency column and relative frequency column) to the grouped frequency table to further organize the data.
- Cumulative Frequency: The cumulative frequency column is used to find the total frequency of the data set.
- Relative frequency: The relative frequency is a percentage that is found by dividing the frequency by the total number of data values.
Organizing the grouped data will help when drawing and analyzing graphs.
Dot plots and histograms
You can use grouped frequency tables to create dot plots and histograms. When creating a dot plot or histogram, adding the cumulative frequency column can help.
For example,
You can use the grouped frequency table here and add the cumulative frequency to the table.
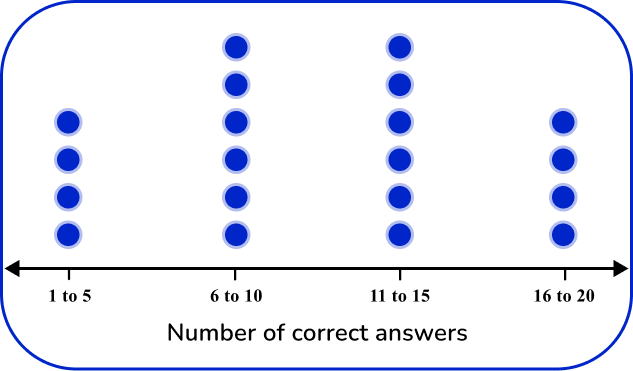
To create the following dot plot,
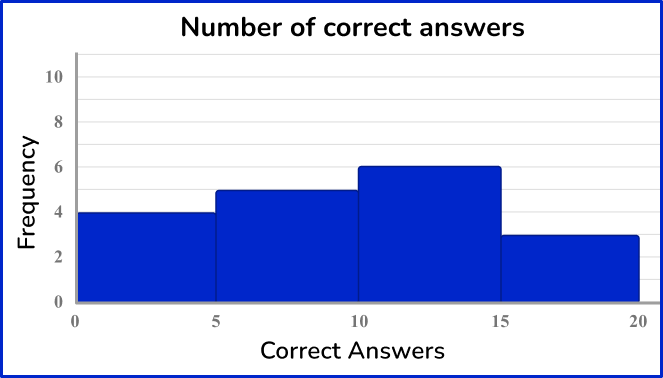
and histogram,
See also: Histogram
Pie charts
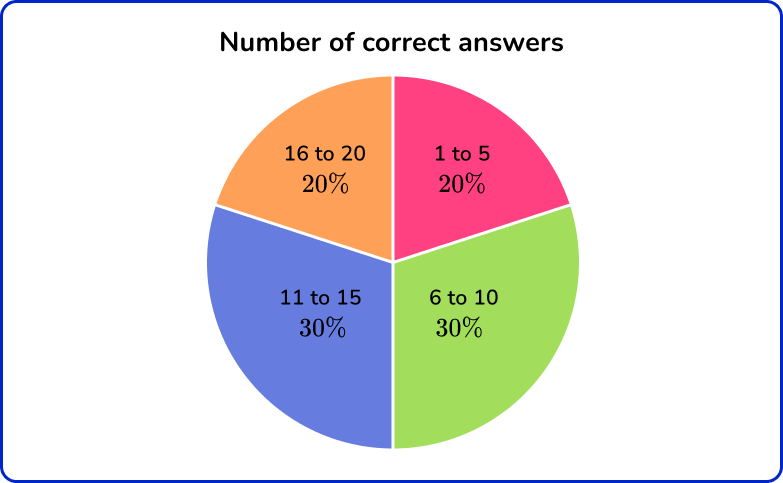
You can use grouped frequency tables to create a pie chart. When creating a pie chart, adding the relative frequency column can help.
You find the relative frequency by dividing the frequency by the total number of data points.
You can use the grouped frequency table here,
To create the following pie chart,
See also: Pie chart
What is a grouped frequency table?
Common Core State Standards
How does this relate to 6 th grade math?
- Grade 6: Statistics and Probability (6.SP.B.4)
Display numerical data in plots on a number line, including dot plots, histograms, and box plots.
![[FREE] Grouped Frequency Table Worksheet (Grade 6)](https://thirdspacelearning.com/wp-content/uploads/2024/04/Grouped-Frequency-Table-Worksheet-listing-image.png)
[FREE] Grouped Frequency Table Worksheet (Grade 6)
Use this worksheet to check your 6th grade students’ understanding of grouped frequency tables. 15 questions with answers to identify areas of strength and support!
DOWNLOAD FREE [FREE] Grouped Frequency Table Worksheet (Grade 6)
Use this worksheet to check your 6th grade students’ understanding of grouped frequency tables. 15 questions with answers to identify areas of strength and support!
DOWNLOAD FREEHow to make a grouped frequency table
In order to make a grouped frequency table, you need to:
- Using the set of data, account for each item with a tally mark in the table.
- Fill in the frequency column.
- Find the cumulative frequency and the relative frequency, if needed.
Grouped frequency table examples
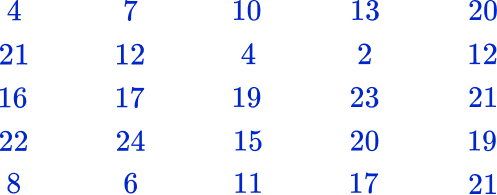
Example 1: whole numbers
Sort these 20 items into the grouped frequency table.
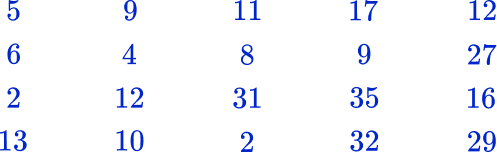
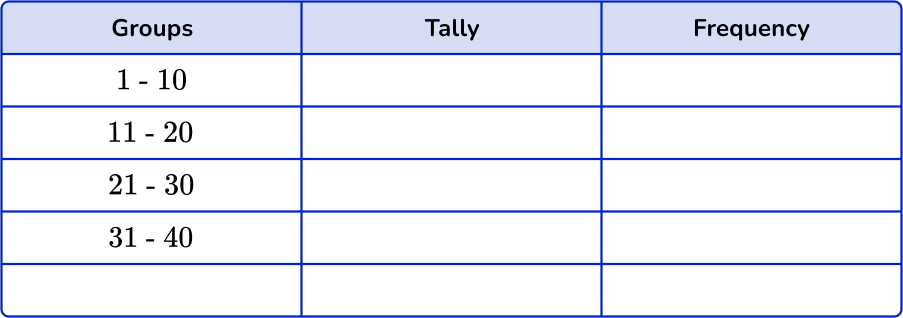
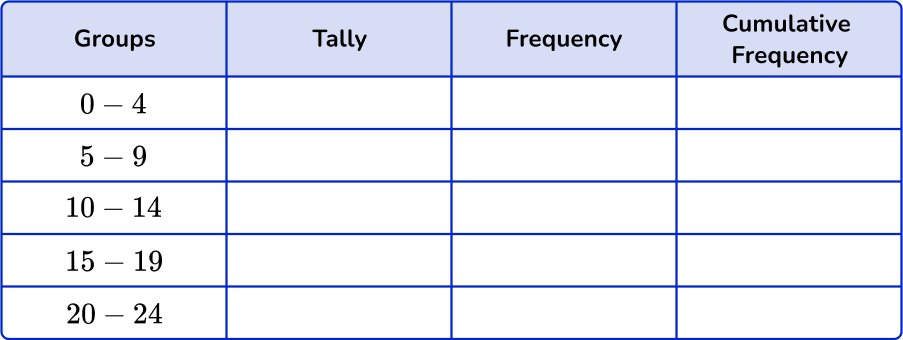
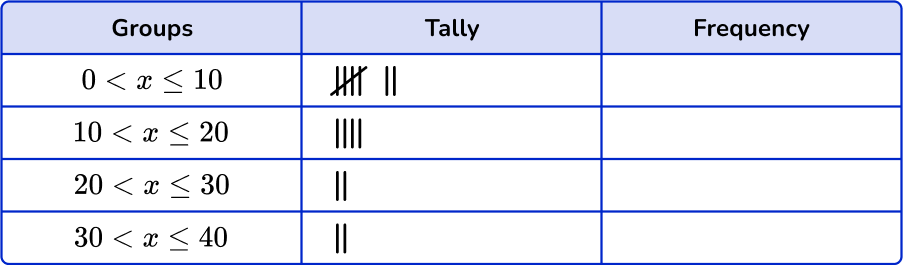
- Using the set of data, account for each item with a tally mark in the table.
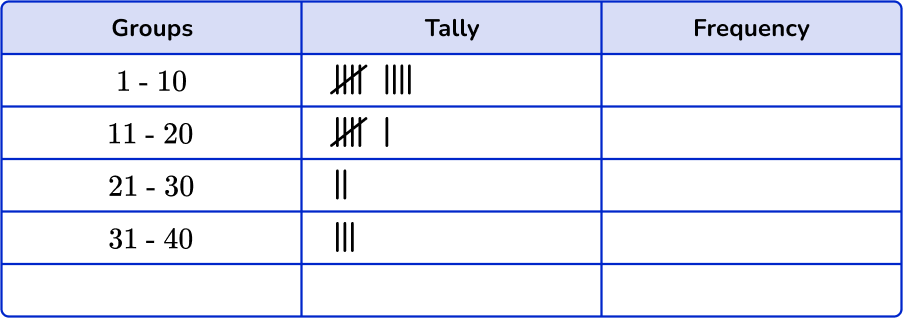
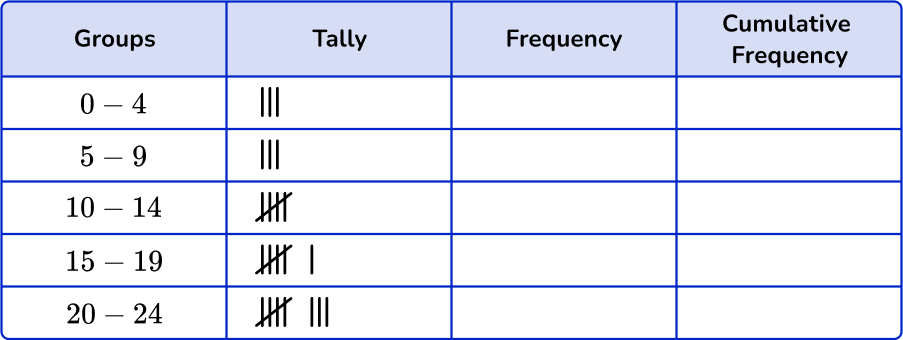
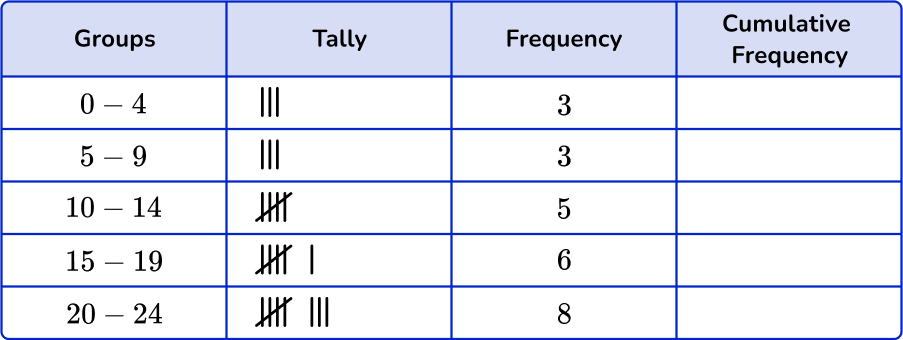
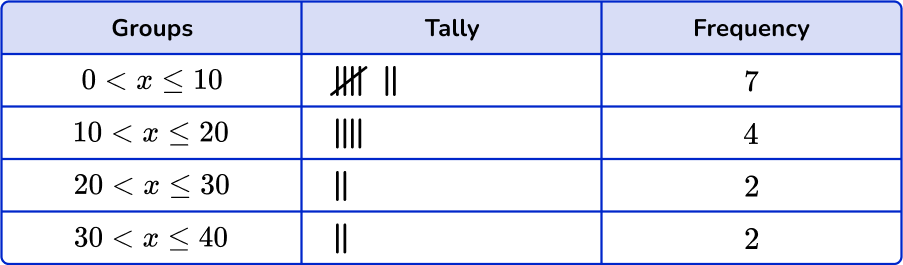
2Fill in the frequency column.
Add up the tally marks and fill in the frequency column.
3Find the cumulative frequency and the relative frequency, if needed.
The question doesn’t ask for the cumulative frequency and you are not using the data to create a graph, so you do not need to add the cumulative frequency or relative frequency column.
Example 2: whole numbers
Sort these 25 items into the grouped frequency table and find the cumulative frequency.
Add up the tally marks and fill in the frequency column.
To find the cumulative frequency table, add the frequency from the previous group to the current group.
For group 0-4, there is no previous group, so the cumulative frequency will be 3.
For the next group, 5 - 9, you will add the previous group frequency, 3, to the current frequency 3.
3+3=6
For group 10 - 14, add the previous group frequency, 6, to the current frequency, 5.
6+5=11
Continue for the remaining groups.
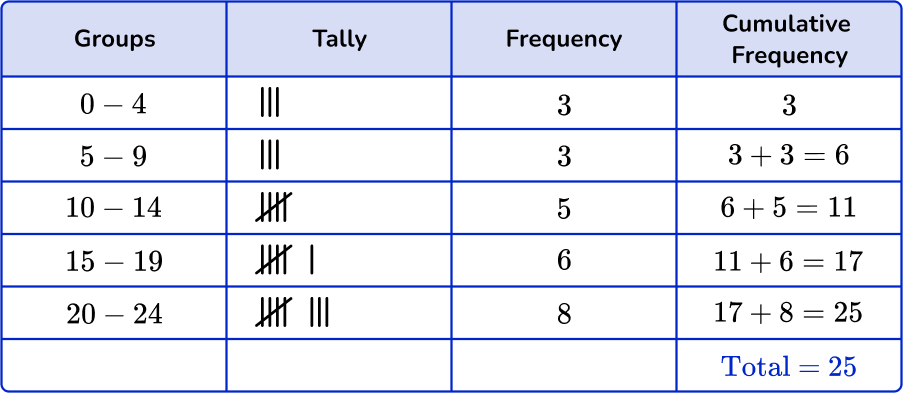
The cumulative frequency is 25.
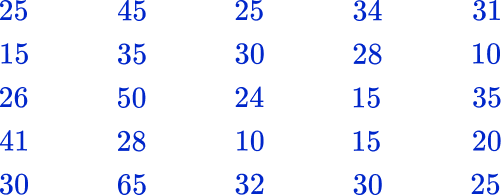
Example 3: whole numbers
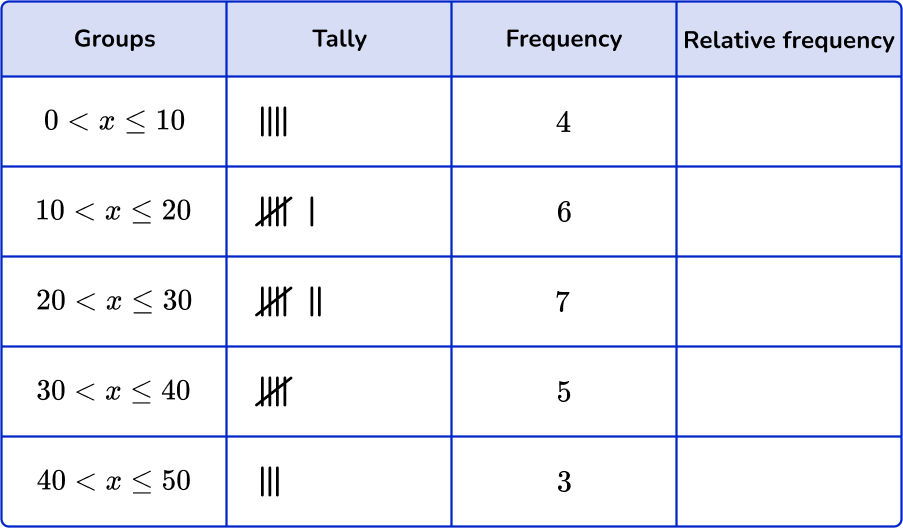
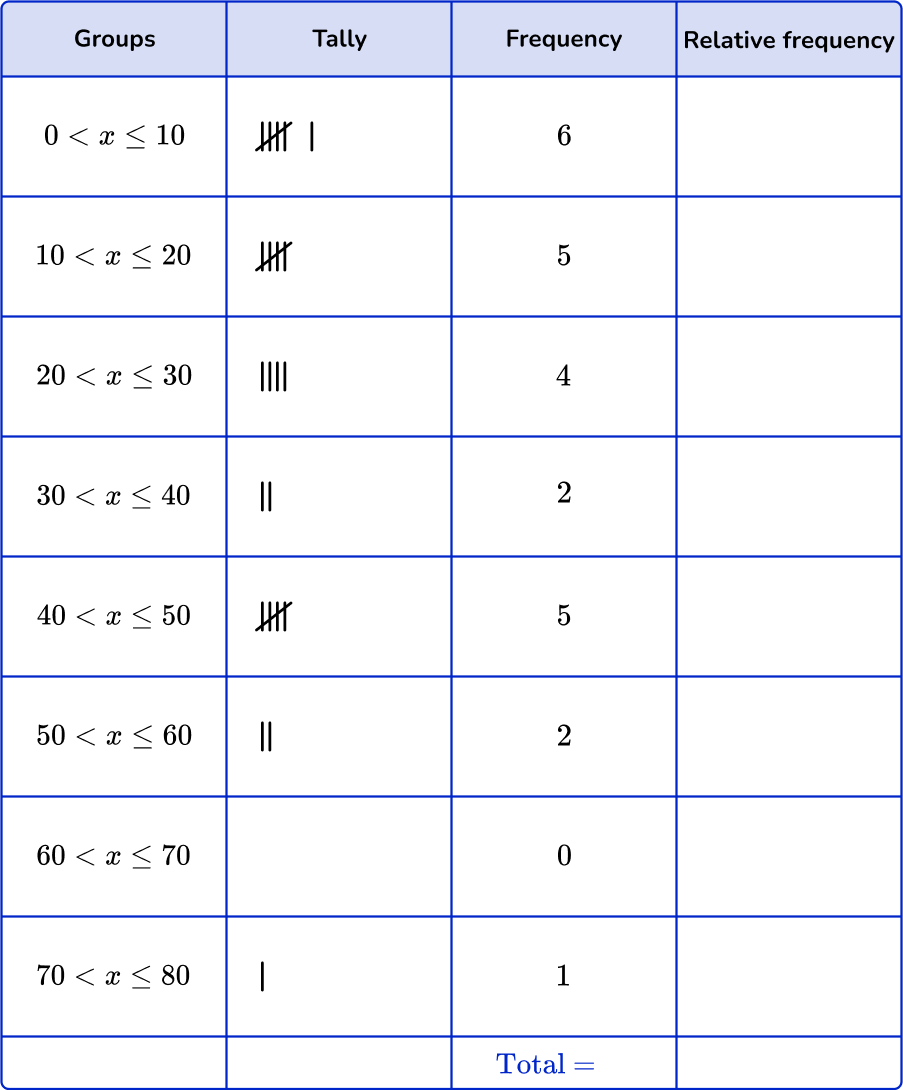
Sort these 25 items into the grouped frequency table and find the relative frequency.
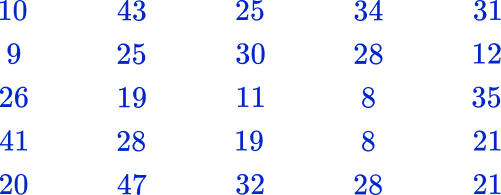
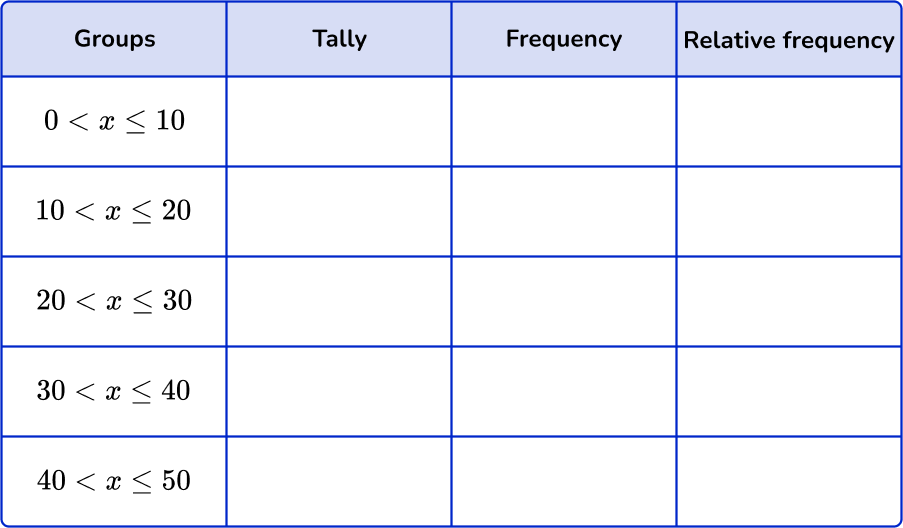
Be careful to check the inequality signs to see which numbers are included in the interval.
For example, the item ‘10’ would be in the first group as the class interval includes 10.
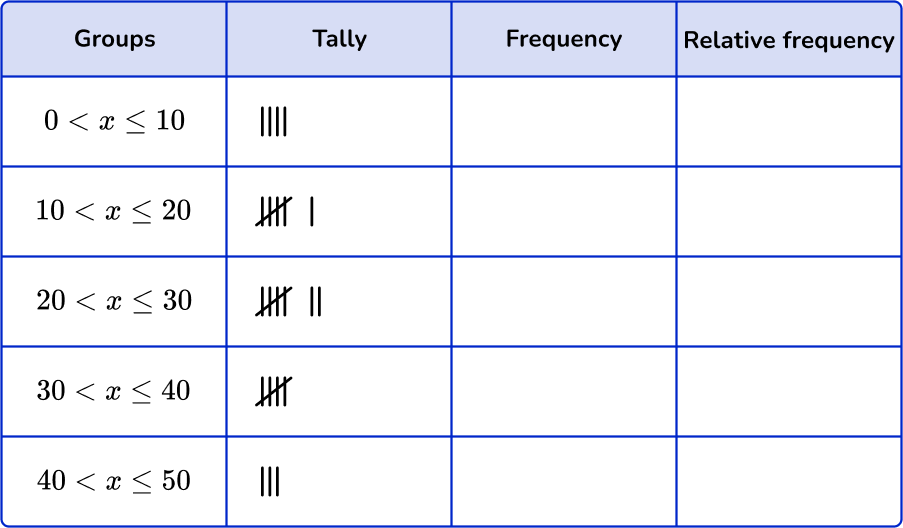
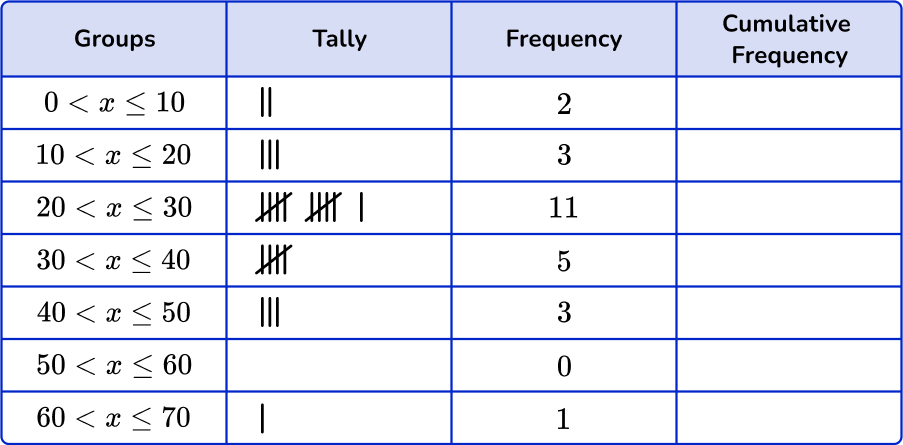
Add up the tally marks and fill in the frequency column.
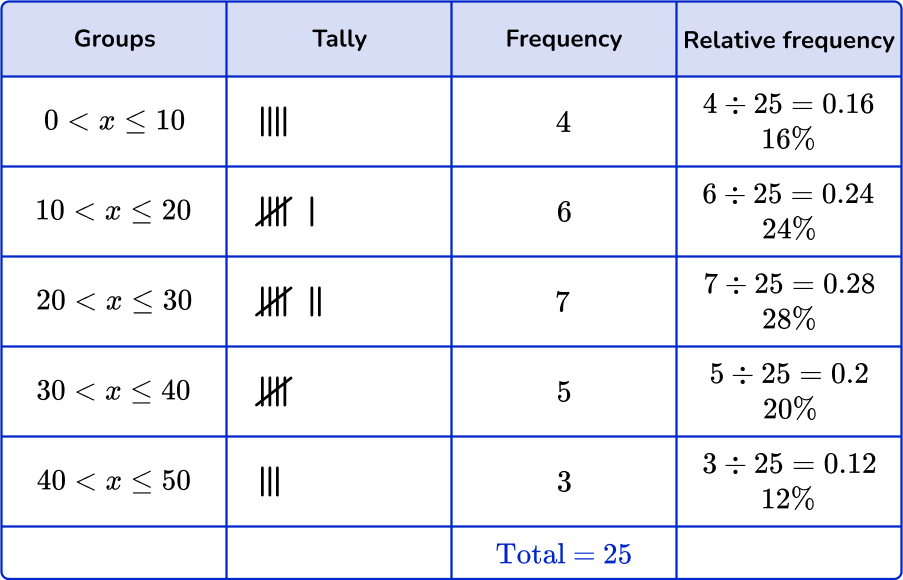
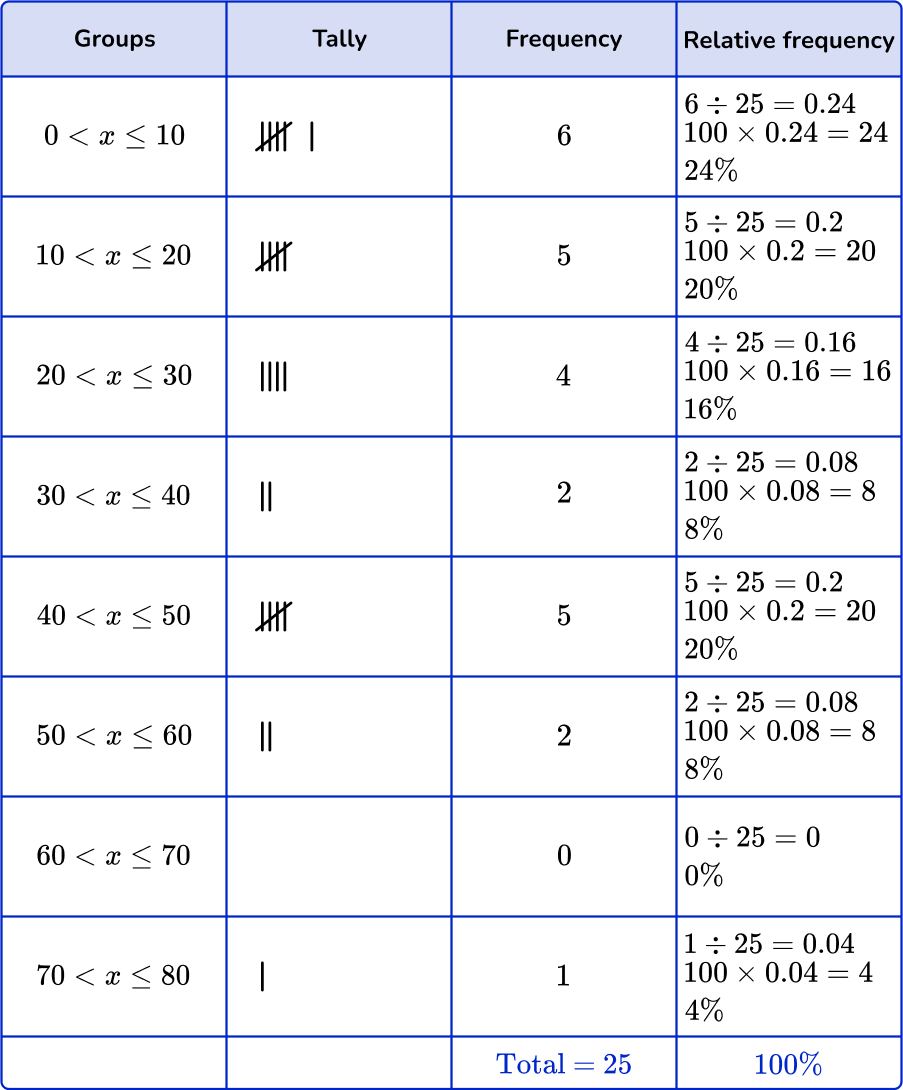
To compute the relative frequency, divide the frequency of each by the total number of data points and multiply by 100 to find the percentage.
For example,
For group 0 < x \leq 10, you will first divide 4 by 25.
4 \div 25=0.16
Then to find the percentage, you will multiply 0.16 by 100.
0.16 \times 100=16
The relative frequency for group 0 < x \leq10 is 16 \%.
Example 4: decimals
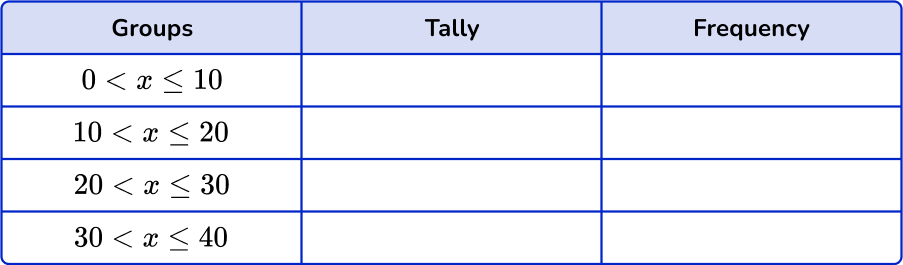
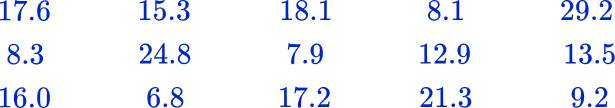
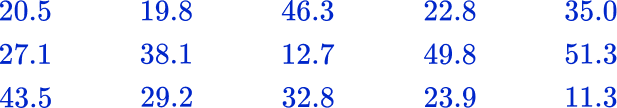
Sort these 15 items into the grouped frequency table.
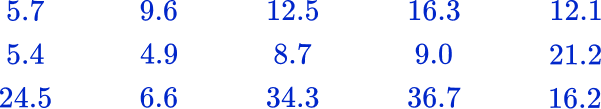
Be careful to check the inequality signs to see which numbers are included in the interval.
Add up the tally marks and fill in the frequency column.
The question doesn’t ask for the cumulative frequency and you are not using the data to create a graph, so you do not need to add the cumulative frequency or relative frequency column.
How to create a histogram from a grouped frequency table
In order to create a histogram from a grouped frequency table, you need to:
- Find the cumulative frequency and the relative frequency on a given grouped frequency table.
- Decide what bin size to use and how many bins are needed.
- Draw and label the \textbf{x} and \textbf{y} axes with units.
- Draw in the bins of the histogram.
Example 5: creating a histogram from a grouped frequency table
25 randomly chosen workers in Illinois were asked how many minutes they traveled to work.
The data below are the responses.
\begin{aligned} &\bf{10, 20, 45, 30, 25, 20, 15, 10, 30, 45, 50, 5, 40,} \\ &\bf{35, 45, 50, 5, 65, 80, 20, 30, 15, 10, 10, 65} \end{aligned}
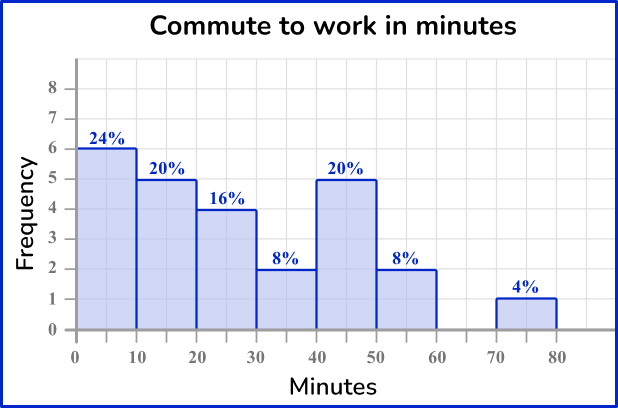
The data has been organized in a grouped frequency table.
Since the groups on the grouped frequency table are in tens, the width of each bin will be 10. The height of each bin will correspond to the frequency.
How to create a dot plot from a grouped frequency table
In order to create a dot plot from a grouped frequency table, you need to:
- Find the cumulative frequency of the given grouped frequency table.
- Decide what bin size to use and how many bins are needed.
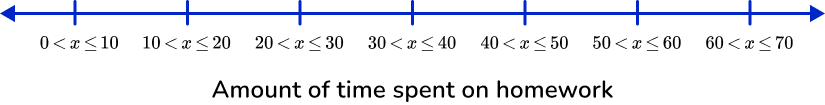
- Draw and label the \textbf{x} axis with units.
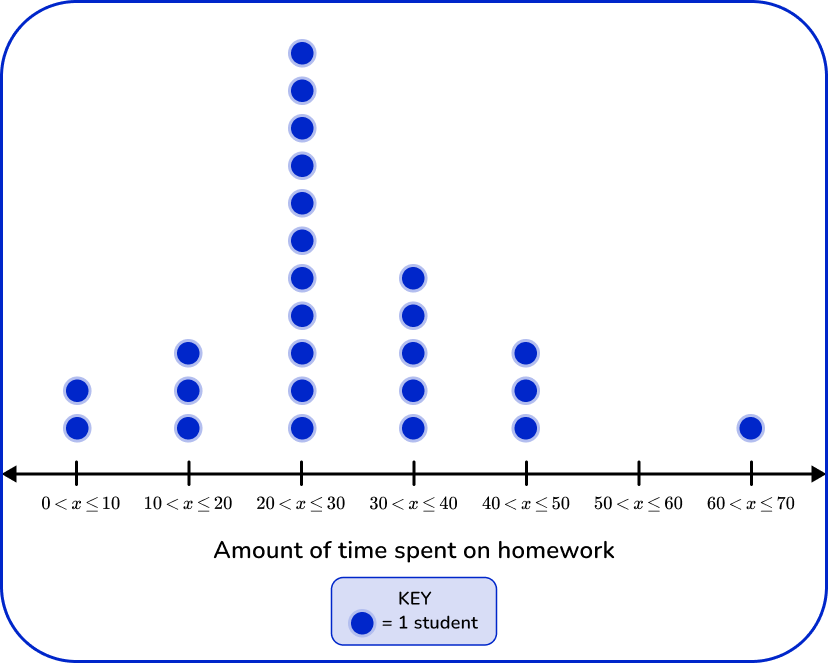
- Plot the data on the dot plot and create a key.
Example 6: creating a dot plot from a grouped frequency table
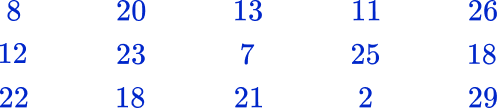
Mr. James asked his 2 nd period class how much time they spent completing homework on an average night. The data below shows the responses.
The data has been organized into a frequency table. Create a dot plot to represent the amount of time students spend on homework on an average night.
To find the cumulative frequency, add the frequency of the current group with the frequency of the group before it.
Because the group 0 < x \leq 10 does not have a group before it, the cumulative frequency will be the same as its frequency.
For all groups following, add the frequency to the frequency of the group before it.
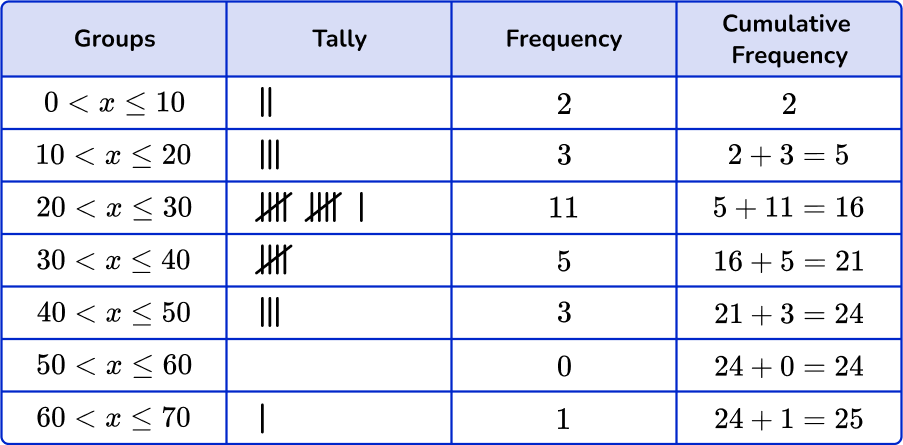
The cumulative frequency is 25, which means that 25 students were asked about the amount of time they spend doing homework each night.
Since the groups on the grouped frequency table are in tens, the width of each bin will be 10. The height of each bin will correspond to the frequency.
Teaching tips for grouped frequency tables
- Provide project based activities for students where they have opportunity to collect and sort their own data based on their own interests.
- Infuse Google sheets or other digital tools where students can create digital graphs and tables instead of doing them by hand.
- For practice focused on creating graphs, providing students with worksheets that include frequency tables can allow students to focus on creating graphs.
- Step-by-step instructions of how to use grouped frequency tables should be displayed in the classroom for students to refer to when needed. This information can also be included in student math journals for personal reference.
Easy mistakes to make
- Not grouping tally marks in the table
Each tally mark represents one item.
You can group the tally marks into 5 s.
- Writing the classes for grouped frequency tables incorrectly
The class intervals used in grouped frequency tables can be written in different ways. Take care with inequalities that the item goes in the correct group.
E.g.
0 to 5
0 - 5
0 \leq x < 5
0<x \leq 5
Related frequency table lessons
Practice grouped frequency table questions
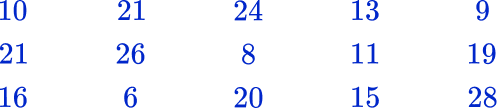
1. Which is the correct grouped frequency table for the following data set?
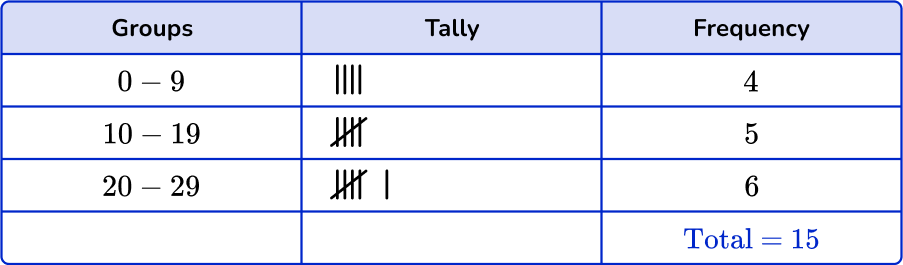

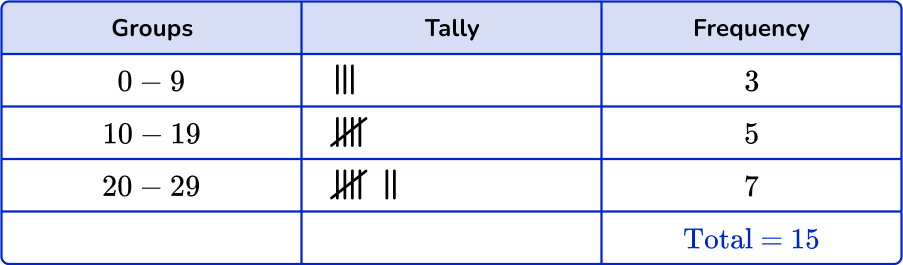

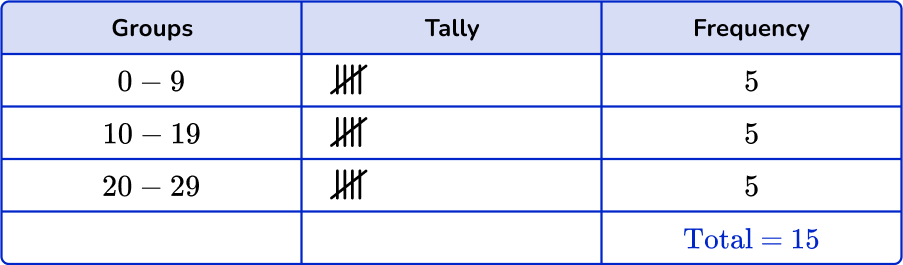

Checking the first group, there are 3 numbers in the 0 to 9 class. Checking the second group, there are 5 numbers in the 10 to 19 class. And finally there are 7 numbers in the 20 to 29 class.
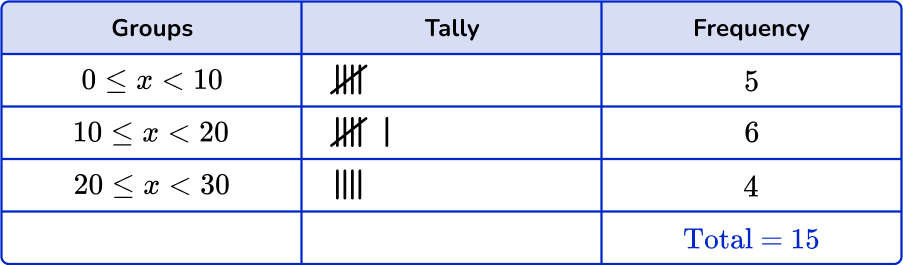
2. Which is the correct grouped frequency table for the following data set?
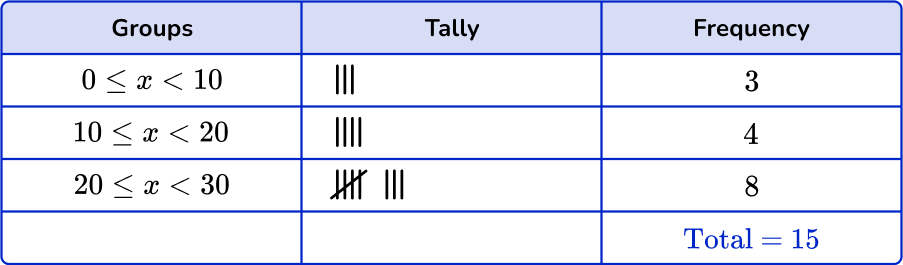
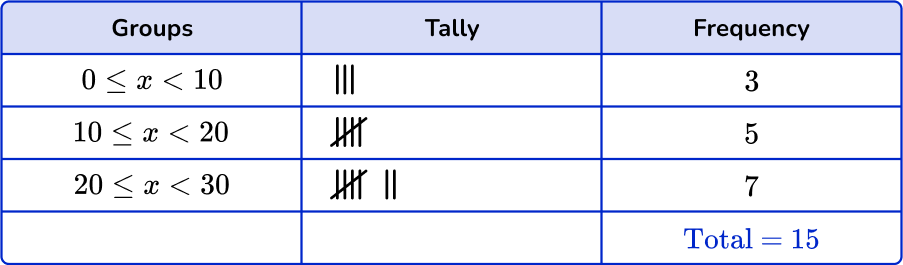
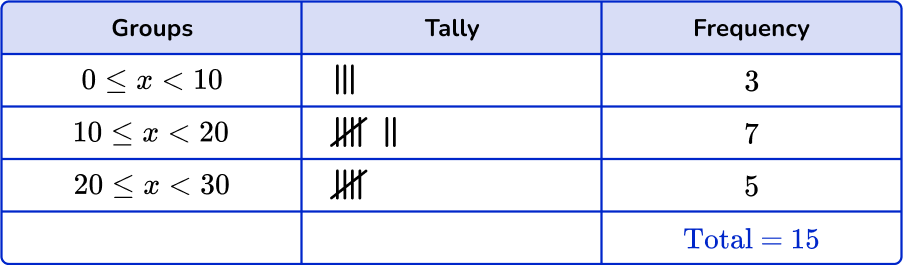
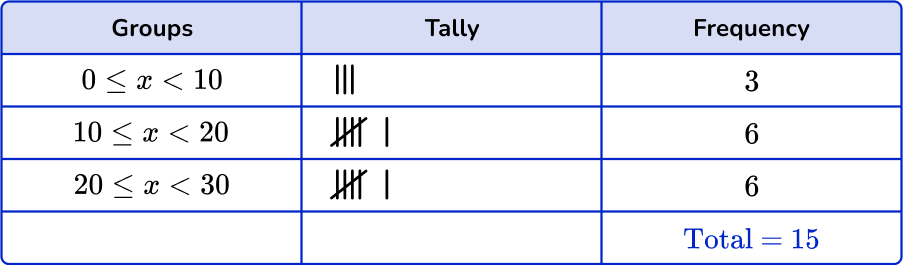
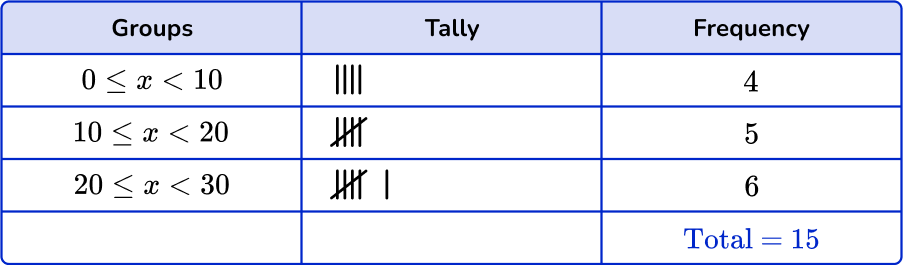
Checking the first group, there are 3 numbers in the 0 \leq x < 10 class. Checking the second group, there are 6 numbers in the 10 \leq x < 20 class. And finally there are 6 numbers in the 20 \leq x < 30 class.
3. Which is the correct grouped frequency table for the following set of data?
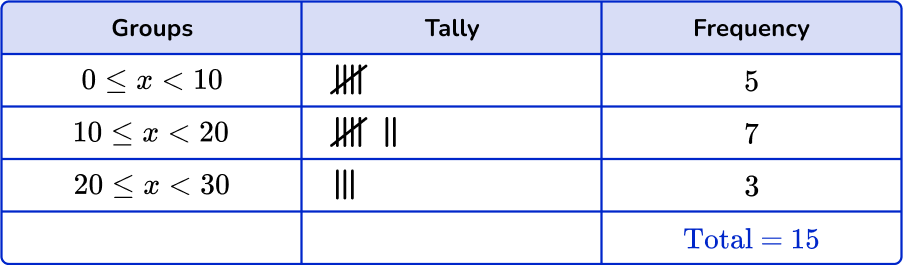
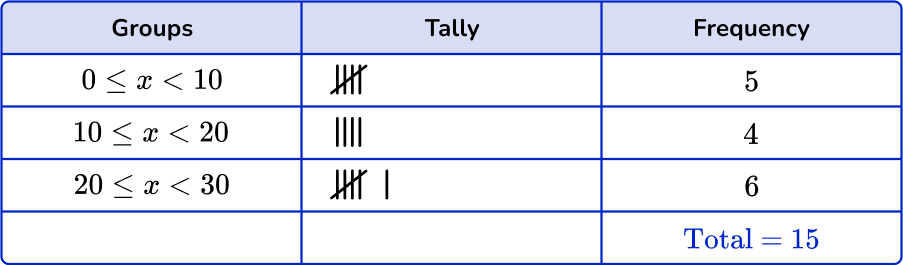
Checking the first group, there are 5 numbers in the 0 \leq x < 10 class. Checking the second group, there are 7 numbers in the 10 \leq x < 20 class. Finally there are 3 numbers in the 20 \leq x < 30 class.
4. Which is the correct grouped frequency table for the following set of data including the cumulative frequency and the relative frequency?
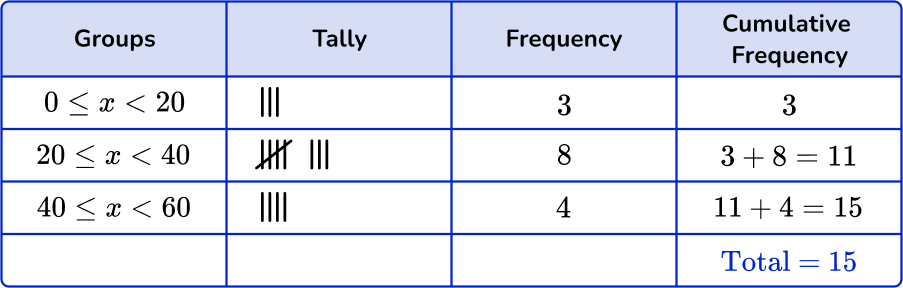
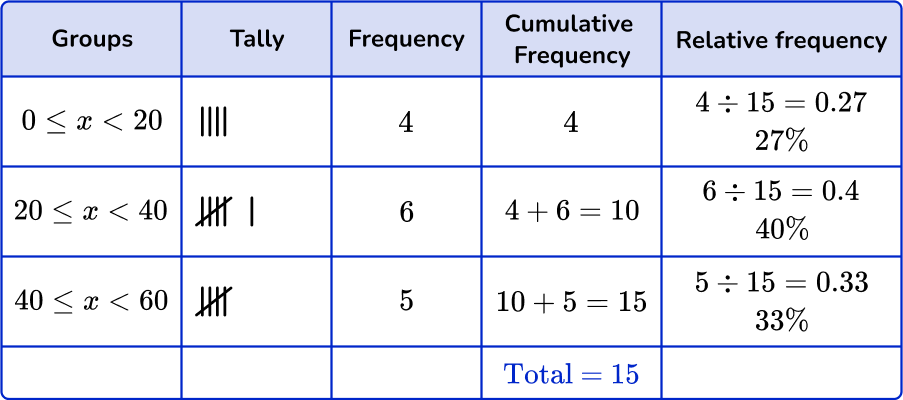
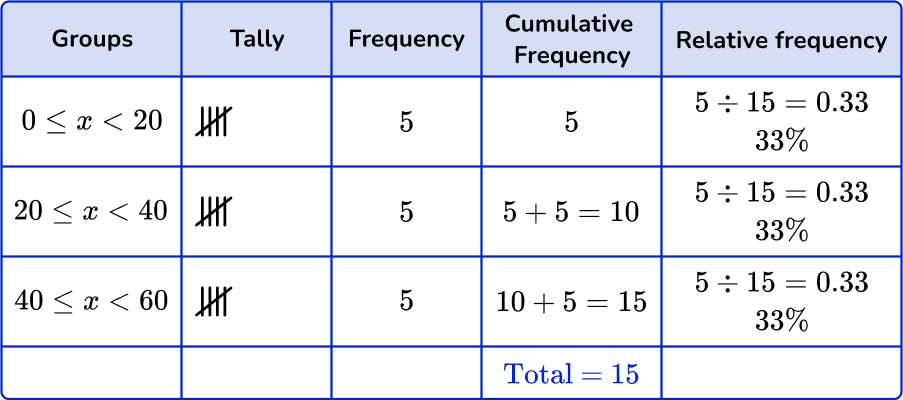
Checking the first group, there are 3 numbers in the 0 \leq x < 20 class. Checking the second group, there are 8 numbers in the 20 \leq x < 40 class. And finally there are 4 numbers in the 40 \leq x < 60 class.
To find the cumulative frequency, add the previous group’s frequency to the frequency of the current group, creating a running count. The highest frequency equals the cumulative frequency.
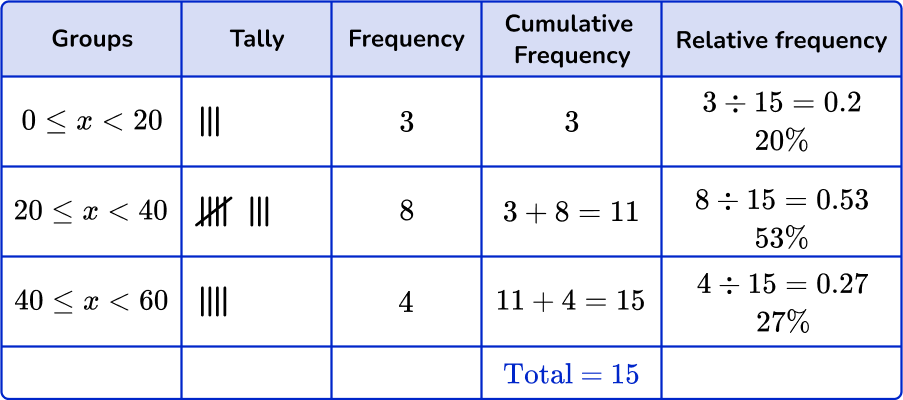
To find the relative frequency, divide the number of data points in the group by the cumulative frequency. Then multiply by 100 to find the percentage.
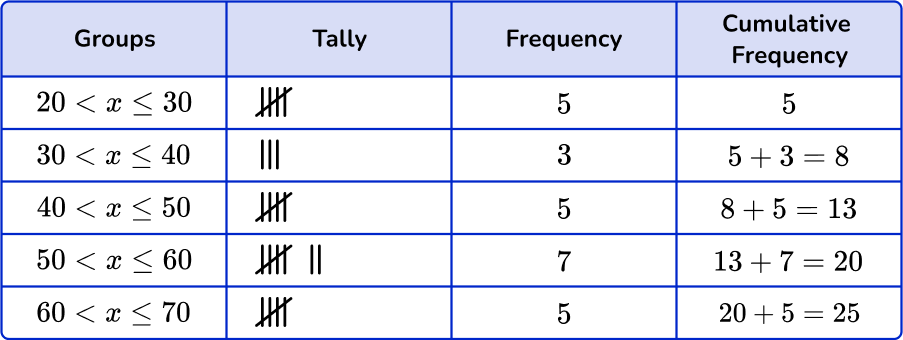
5. Which of the following grouped frequency tables matches the given dot plot?
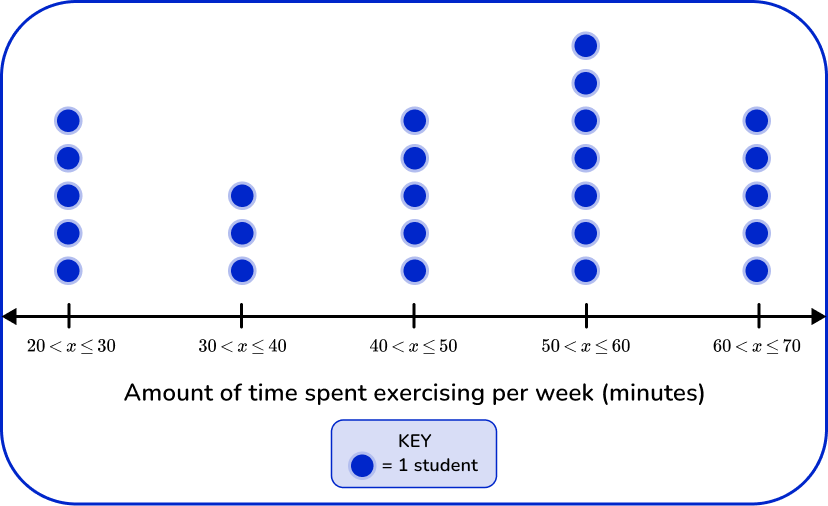
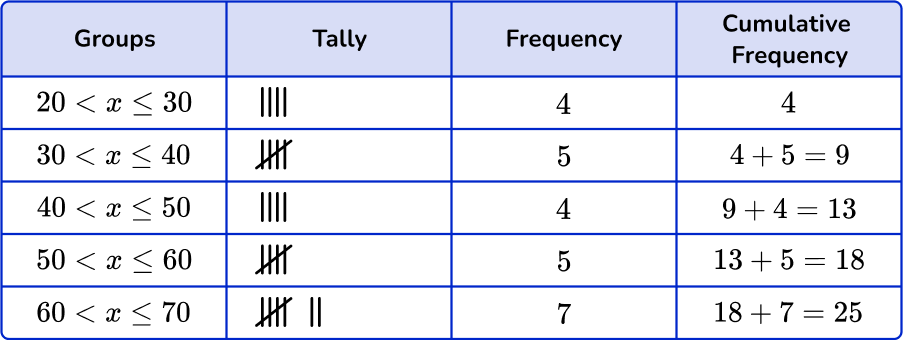

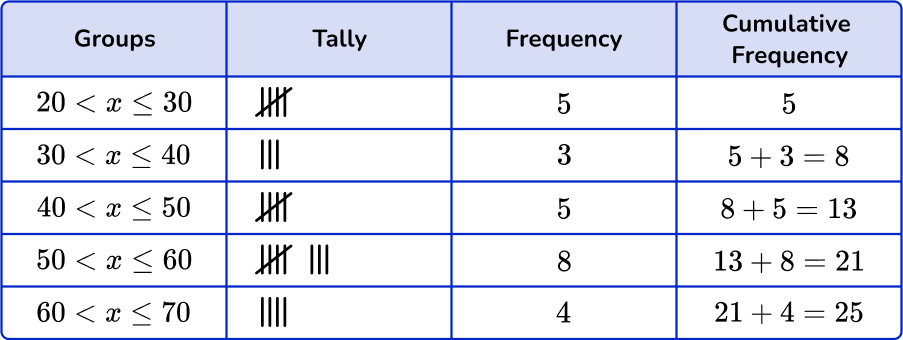
First, check that the intervals given in the grouped frequency tables match the dot plot.
Next, check that the tally and the frequency match.
\begin{aligned} & 20 < x \leq 30-5 \\\ & 30 < x \leq 40-3 \\\ & 40 < x \leq 50-5 \\\ & 50 < x \leq 60-7 \\\ & 60 < x \leq 70-5 \end{aligned}
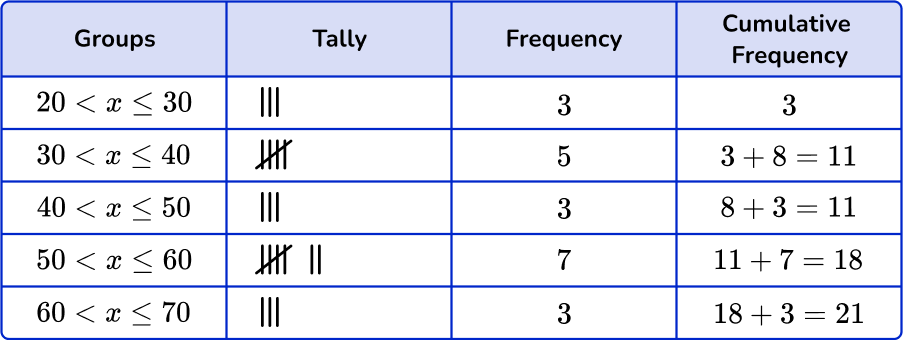
Last, check that the cumulative frequency is correct. You are left with one grouped frequency tables,
6. Which of the following grouped frequency tables matches the given histogram?
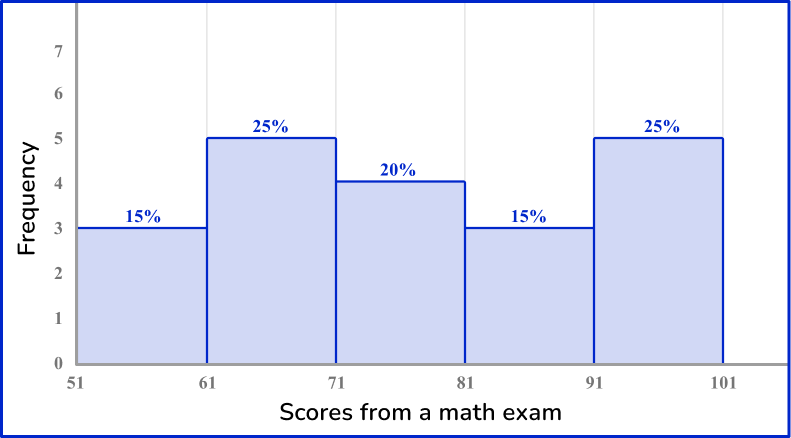
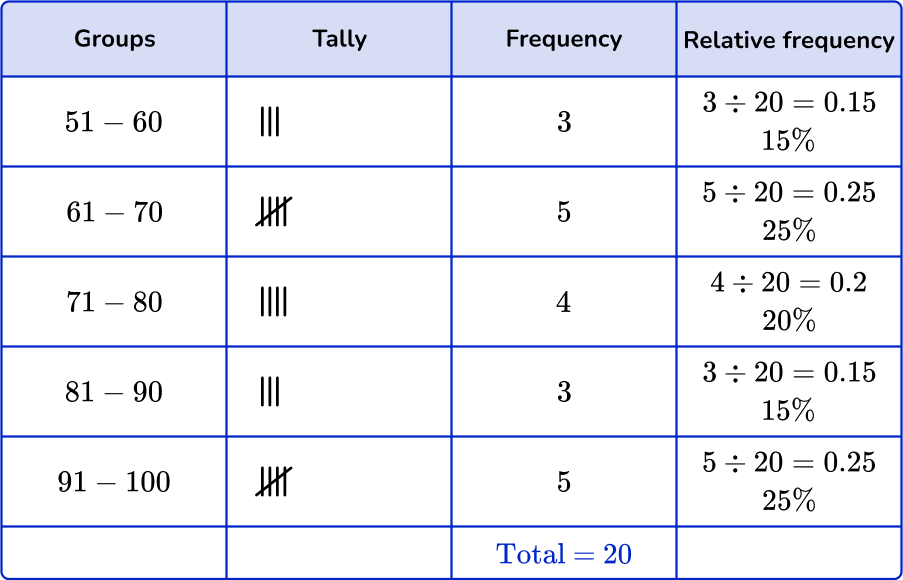
First, check that the intervals given in the grouped frequency tables match the histogram.
Next, check that the frequency and the relative frequency match the histogram.
51-60:
Frequency: 3
Cumulative frequency: 15 \%
61-70:
Frequency: 5
Cumulative frequency: 25 \%
71-80:
Frequency: 4
Cumulative frequency: 20 \%
81-90:
Frequency: 3
Cumulative frequency: 15 \%
91-100:
Frequency: 5
Cumulative frequency: 25 \%
You are left with one grouped frequency table,

Grouped frequency table FAQs
Grouped data is data that is given in the form of class intervals, such as 1-10, 11-20, etc. Ungrouped data is when the data is given as individual data points, values or numbers.
Yes, there are many different real world contexts that would include data with fractions and decimals.
The standard deviation is a value that summarizes the variation around the mean. It is another measure that can be calculated from the data in frequency tables.
The next lessons are
- Frequency graph
- Types of sampling
- Probability
- Measurement and data
- Units of measurement
Still stuck?
At Third Space Learning, we specialize in helping teachers and school leaders to provide personalized math support for more of their students through high-quality, online one-on-one math tutoring delivered by subject experts.
Each week, our tutors support thousands of students who are at risk of not meeting their grade-level expectations, and help accelerate their progress and boost their confidence.

Find out how we can help your students achieve success with our math tutoring programs.
[FREE] Common Core Practice Tests (3rd to 8th Grade)
Prepare for math tests in your state with these 3rd Grade to 8th Grade practice assessments for Common Core and state equivalents.
Get your 6 multiple choice practice tests with detailed answers to support test prep, created by US math teachers for US math teachers!