High Impact Tutoring Built By Math Experts
Personalized standards-aligned one-on-one math tutoring for schools and districts
Frequency table
Here you will learn about frequency tables, including what a frequency table is and how to make a frequency table. You will also look at how they can be used to help analyze a set of data.
Students will first learn about frequency tables as a part of measurement and data in
2 nd, 3 rd and 4 th grade and will expand on their knowledge of frequency tables in middle school.
Every week, we teach lessons on frequency tables to students in schools and districts across the US as part of our online one-on-one math tutoring programs. On this page we’ve broken down everything we’ve learnt about teaching this topic effectively.
What is a frequency table?
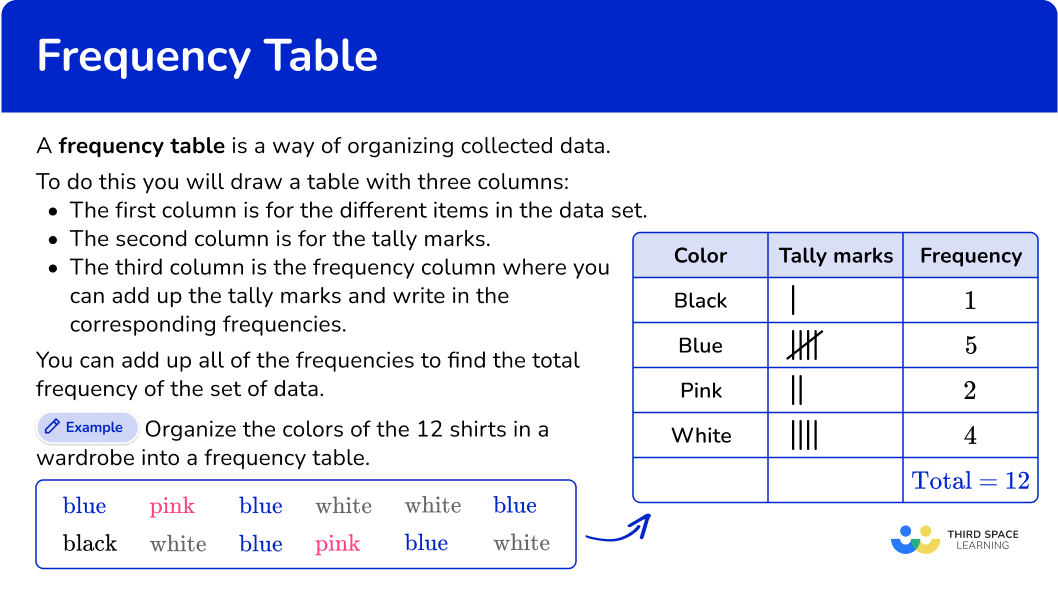
A frequency table is a way of organizing collected data.
To do this, draw a table with three columns:
- Items: The first column is for the different items in the data set.
- Tally marks: This column is for the tally marks.
- Frequency: The frequency column is where you can add up the tally marks.
In higher grade levels, the following column may be added to the columns above:
- Cumulative Frequency: The cumulative frequency column is used to add up the number of data values present in the data set.
- Cumulative relative frequency: The cumulative relative frequency is a percentage that is found by dividing the frequency by the total number of data values.
We can add up all of the frequencies to find the total frequency of the set of data, or find the cumulative frequency.
For example,
Organize the colors of the 12 shirts in a wardrobe into a frequency table.

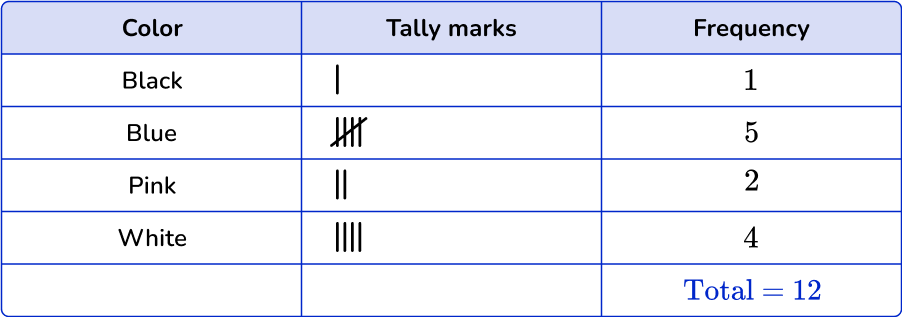
The total number of shirts is 12.
This type of frequency table is also known as an ungrouped frequency table because it displays the frequency of each individual data point, rather than groups of data points.
![[FREE] Frequency Table Worksheet (Grade 1 to 8)](https://thirdspacelearning.com/wp-content/uploads/2024/06/Frequency-table-Worksheet-listing-image.png)
[FREE] Frequency Table Worksheet (Grade 1 to 8)
Use this worksheet to check your grade 1 to 8 students’ understanding of frequency table. Includes 15 questions with answers to identify areas of strength and support!
DOWNLOAD FREE [FREE] Frequency Table Worksheet (Grade 1 to 8)
Use this worksheet to check your grade 1 to 8 students’ understanding of frequency table. Includes 15 questions with answers to identify areas of strength and support!
DOWNLOAD FREEAverages from frequency tables
You use frequency tables to find descriptive statistics. These are values which help describe the set of data such as the mean, median and mode of a set of data.
For example,
A frequency table showing the ages of 25 students on a college course.
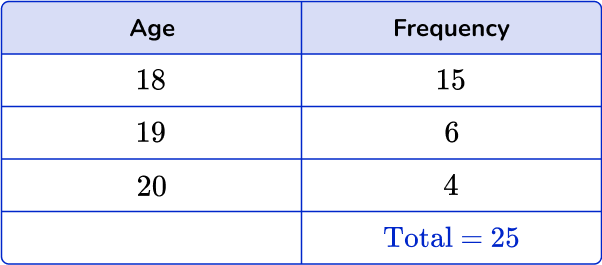
The mode is 18.
The median is the 13^{th} value which is 18.
The mean can be calculated using the total of all the values, divided by the total of the frequencies, n.
\text{mean}=\cfrac{\text{total}}{n}=\cfrac{(18\times 15)+(19\times 6)+(20\times 4)}{25}=\cfrac{464}{25}=18.56
Step by step guide: Mean from a frequency table
Step by step guide: How to find the median from a frequency table
Grouped frequency table
Numerical data can also be organized into grouped data. Here, the data is put into different classes with class intervals.
For example,
A grouped frequency table showing the heights of 15 students.
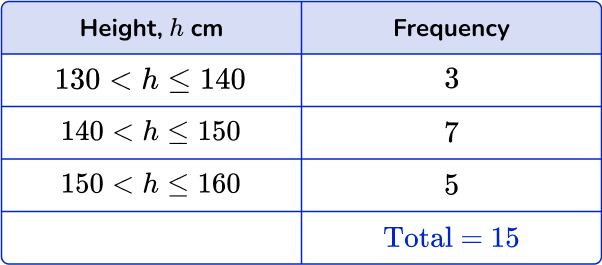
The modal class is 140 < h \leq 150
The median is the 8^{th} value which is in the 140 < h \leq 150 class interval.
You can only calculate an estimate for the mean using the midpoints of the class intervals. The total of the frequencies is n.
\text{mean}=\cfrac{\text{total}}{n}=\cfrac{(135\times 3)+(145\times 7)+(155\times 5)}{15}=\cfrac{2195}{15}=146.3 \ \text{(to 1 dp)}
Step by step guide: Modal class
Step by step guide: Grouped frequency table
Frequency tables can be used to draw different types of graphs, including line plots, bar graphs (bar charts), pie charts or histograms. They can also be used to find cumulative frequency, which in turn can be used to estimate median values and upper and lower quartiles for grouped data.
For example,
You can take this frequency table,
And use the data to create the following dot-plot,
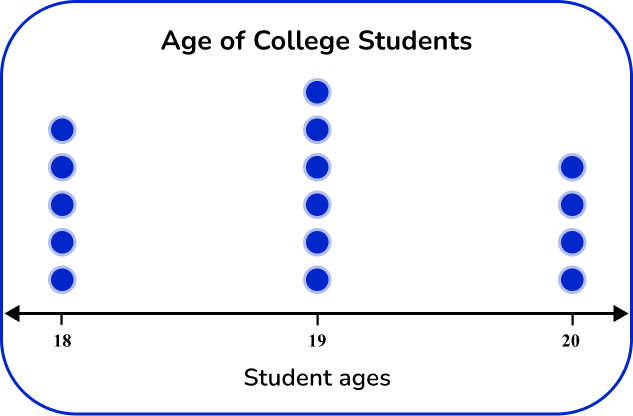
Cumulative frequency tables and relative frequency tables
Cumulative and relative frequency tables are typically covered in 7 th and 8 th grade and will not be covered in the examples and practice problems on this webpage.
Cumulative frequency tables are frequency tables that show the cumulative frequency distribution. The cumulative frequency distribution is shown in an additional column that shows a cumulative count of all frequencies within a data set.
For example,
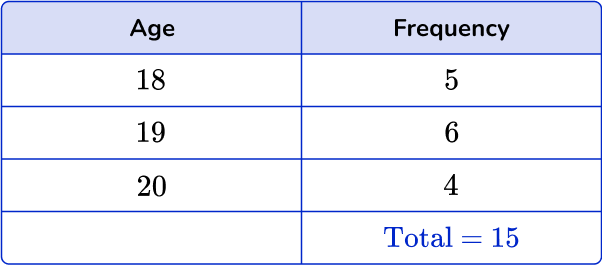
Using this frequency table, you can calculate the cumulative frequency distribution.
To find the cumulative frequency,
- Start with the first data point, 18, which has the frequency of 5.
- Then add the frequency of the next age group, which is 6; 5+6=11.
- You would continue the process until all data points or class intervals are added.
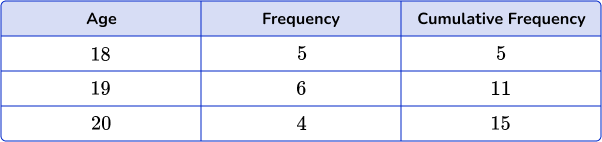
The final cumulative frequency is 15.
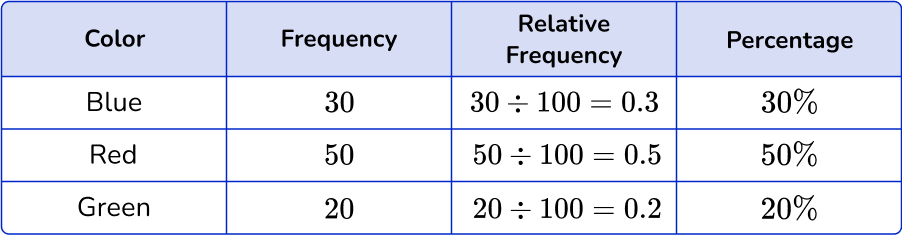
Relative frequency tables are a way to show the frequencies within a data set as a proportion or percentage of the total number of observations.
For example,
100 students were asked which of the following colors were their favorite and were recorded on a frequency table.
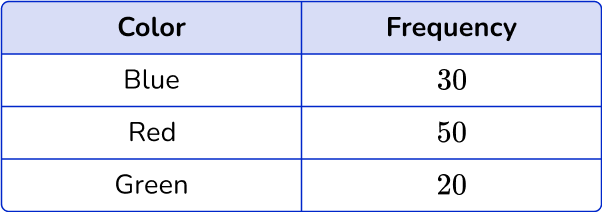
To find the relative frequency distribution, you will divide the frequency by the total number of data points collected.
What is a frequency table?
Common Core State Standards
How does this relate to 2 nd grade math, 3 rd grade math, 4 th grade math, and 6 th grade math?
- Grade 2: Measurement and Data (2.MD.D.9)
Generate measurement data by measuring lengths of several objects to the nearest whole unit, or by making repeated measurements of the same object. Show the measurements by making a line plot, where the horizontal scale is marked off in whole-number units.
- Grade 3: Measurement and Data (3.MD.B.4)
Generate measurement data by measuring lengths using rulers marked with halves and fourths of an inch. Show the data by making a line plot, where the horizontal scale is marked off in appropriate units— whole numbers, halves, or quarters.
- Grade 4: Measurement and Data (4.MD.B.4)
Make a line plot to display a data set of measurements in fractions of a unit ( \cfrac{1}{2} , \cfrac{1}{4} , \cfrac{1}{8} ). Solve problems involving addition and subtraction of fractions by using information presented in line plots. For example, from a line plot find and interpret the difference in length between the longest and shortest specimens in an insect collection.
- Grade 6: Statistics and Probability 6.SP.B.4
Display numerical data in plots on a number line, including dot plots, histograms, and box plots.
How to make a frequency table
In order to make a frequency table, you need to:
- List the different items from the data set.
- Using the set of data, account for each item with a tally mark in the table.
- Fill in the frequency column.
Frequency table examples
Example 1: categorical data
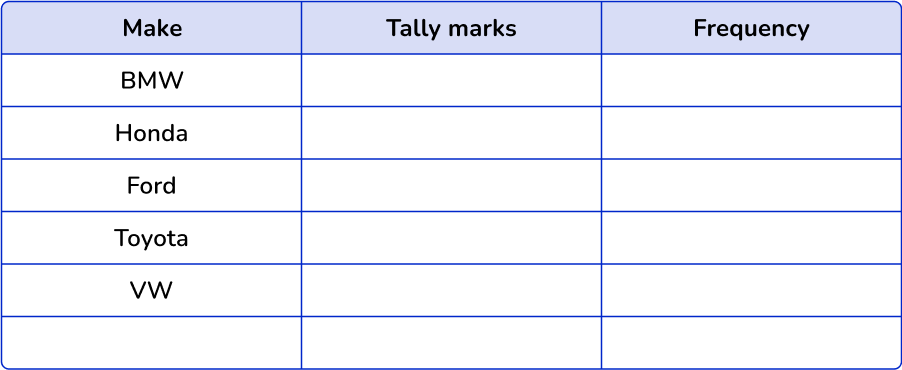
Here are the makes of 20 cars.

Complete the frequency table.
- List the different items from the data set.
For this frequency table, you will list the different makes of cars.
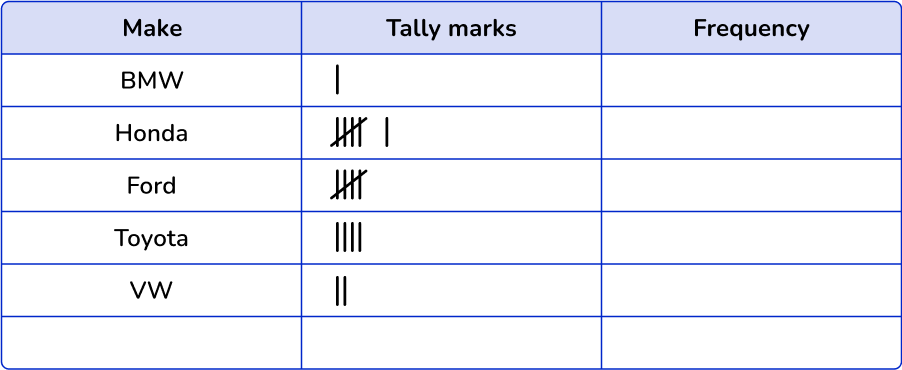
2Using the set of data, account for each item with a tally mark in the table.
Go along the data set, and for each item, put a tally mark in the table.
3Fill in the frequency column.
When you have finished, add up the tally marks to find the frequencies.
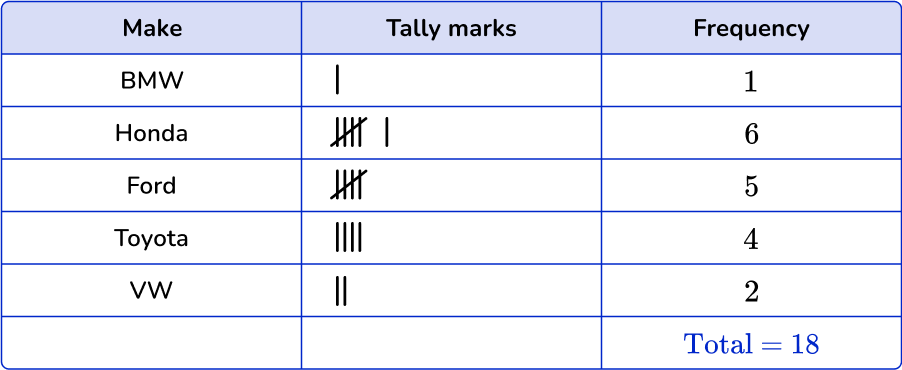
Add up the frequencies in the final column to get the total number of items in the data set.
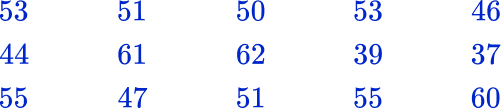
Example 2: numerical data
Here are the temperatures at noon for 7 days (in ^{\circ}F ).

Complete the frequency table.
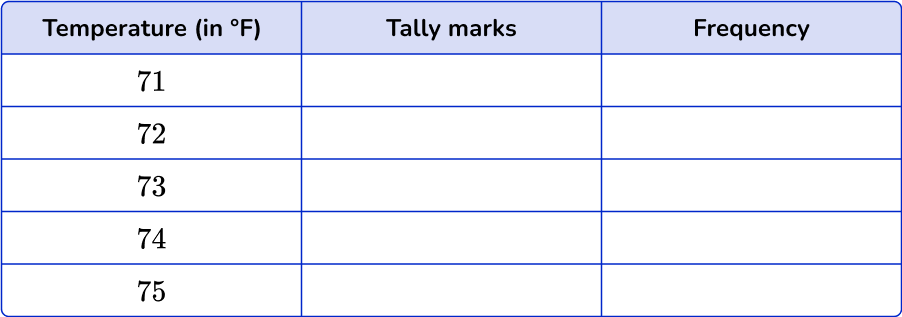
Go along the data set, and for each item, put a tally mark in the table.
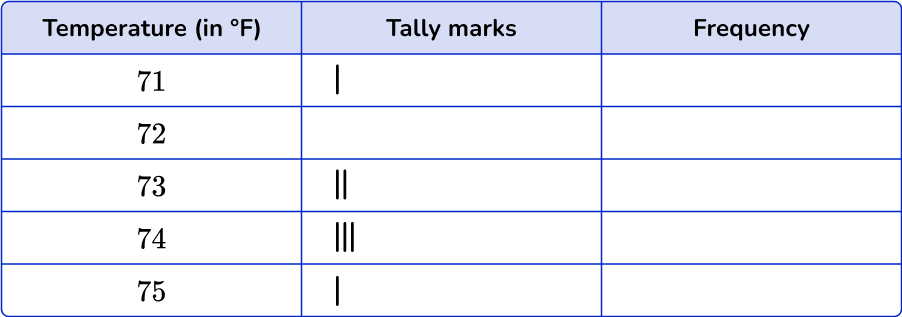
When you have finished, add up the tally marks to find the frequencies.
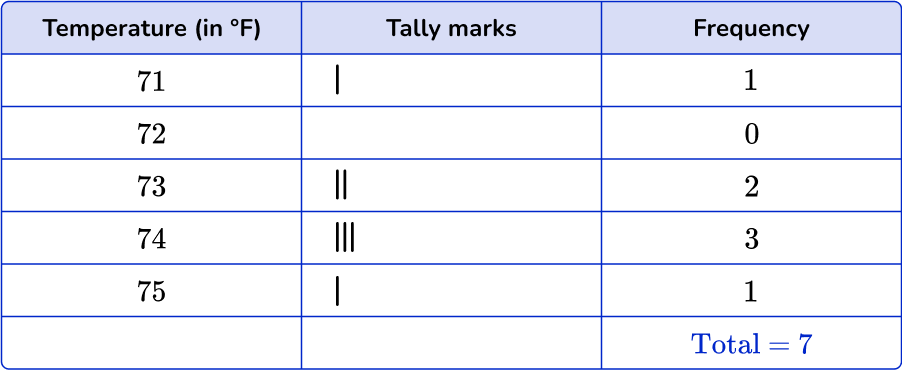
Add up the frequencies in the final column to get the total number of items in the data set.
How to make a grouped frequency table
In order to make a grouped frequency table, you need to:
- Create and list the different groups or class intervals from the data set.
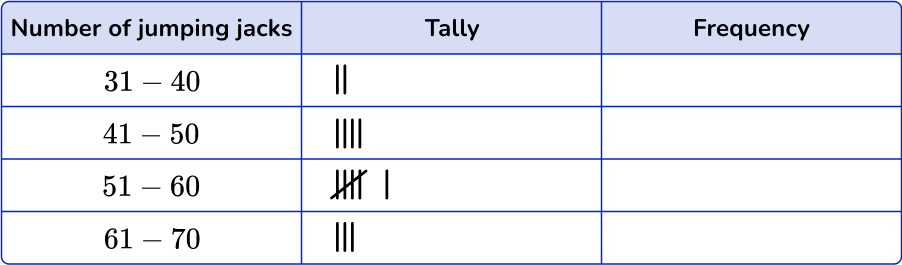
- Using the set of data, account for each item with a tally mark in the table.
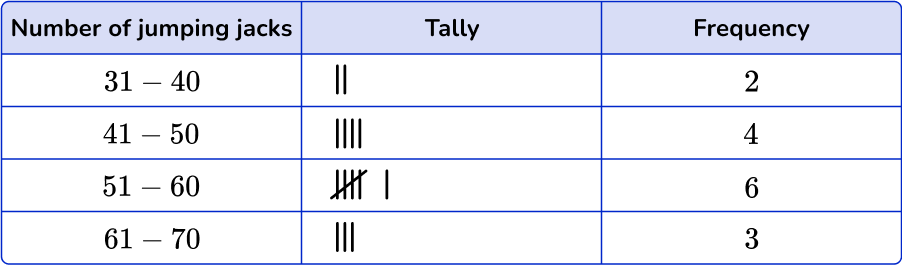
- Fill in the frequency column.
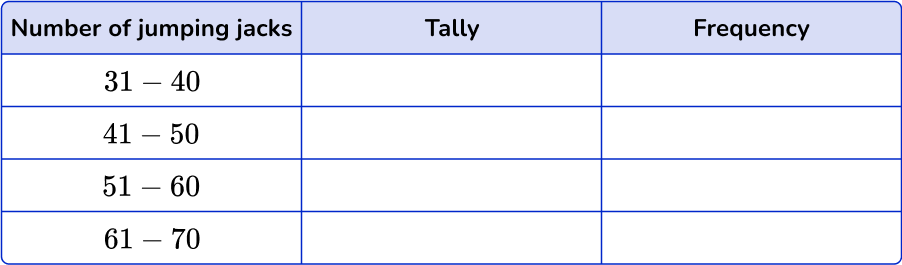
Example 3: whole numbers
The fourth graders were taking their fitness test in PE. The students were timed for 60 seconds and the number of jumping jacks they were able to complete is listed below.
Complete the frequency table.
Example 4: decimals
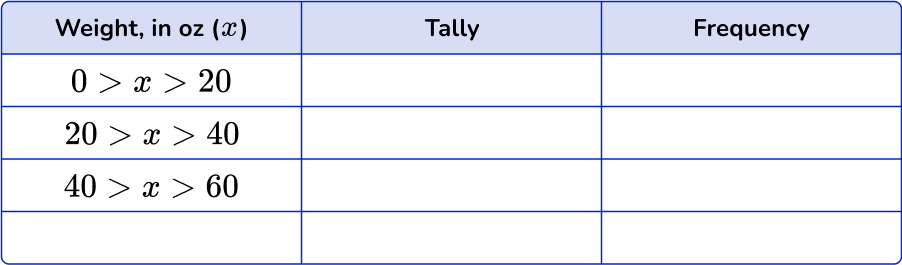
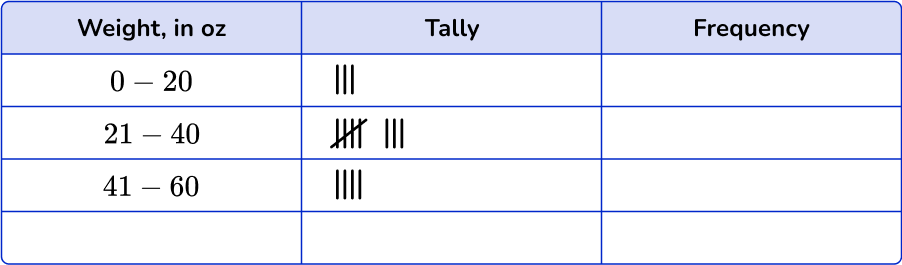
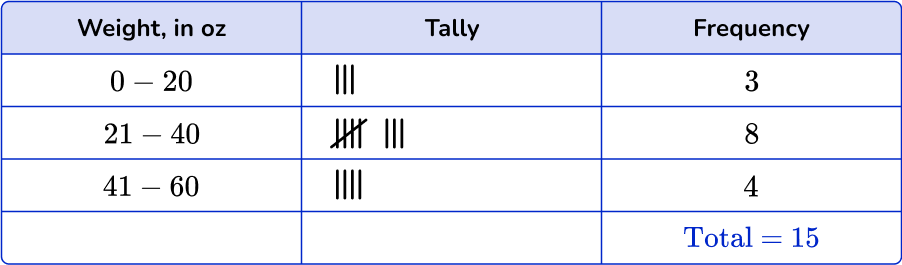
Students took turns weighing different objects in science class. The data below shows the weights in ounces.
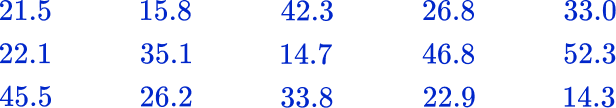
Complete the frequency table.
How to use a frequency table to make a line plot
In order to use a frequency table to make a line plot, you need to:
- Create or use a completed frequency table.
- Identify the variables and label the axes on the line plot.
- Plot data points from the frequency table.
- Add a title and key, if needed.
Example 5: dot plot from frequency table
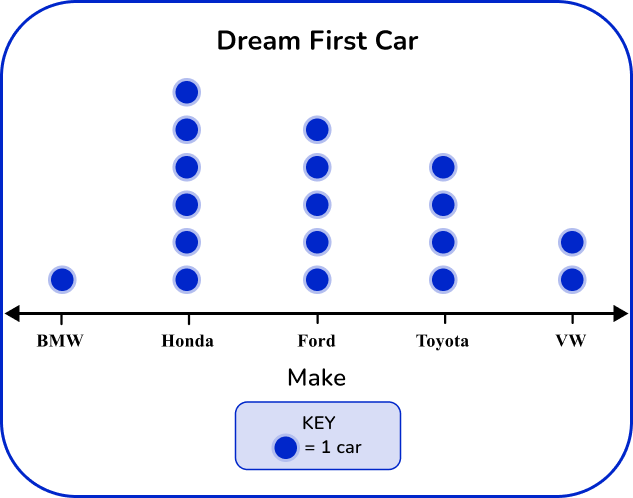
Stuart asked his friends what type of car they want for their first car. He recorded their answers in the frequency chart below.

Create a line plot based on the frequency table.
The frequency table was provided for the dot-plot.
The variables are the given makes of cars, so list each make along the bottom of the given axes.
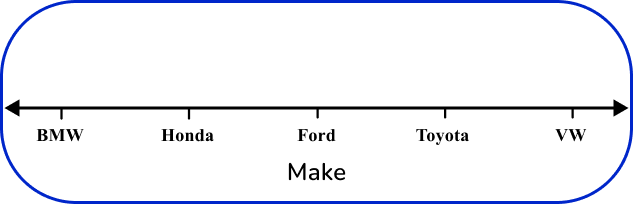
*Note: The order of the makes on the axis does not matter – they can be in any order.
For each tally mark, a dot should be placed above the make of the car until all cars are accounted for.
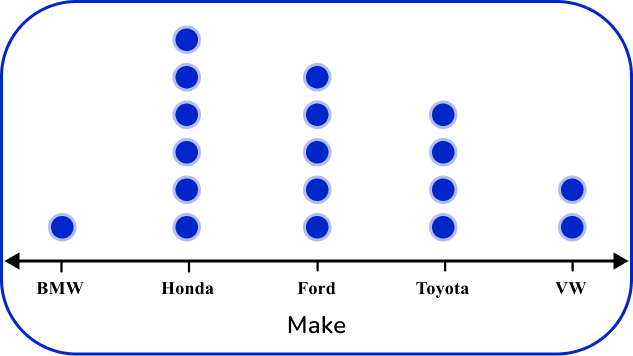
Always give your graph a title and a key to help others read the data provided.
Example 6: dot plot with frequency table.
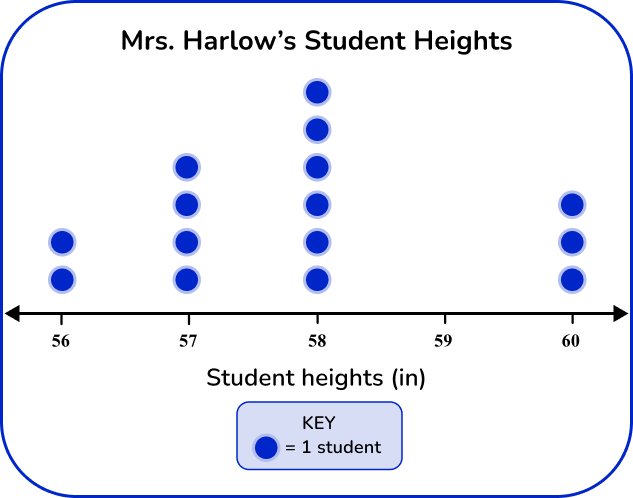
Mrs. Harlow measured the heights of some of her students. The frequency table shows the heights of 15 students in inches.
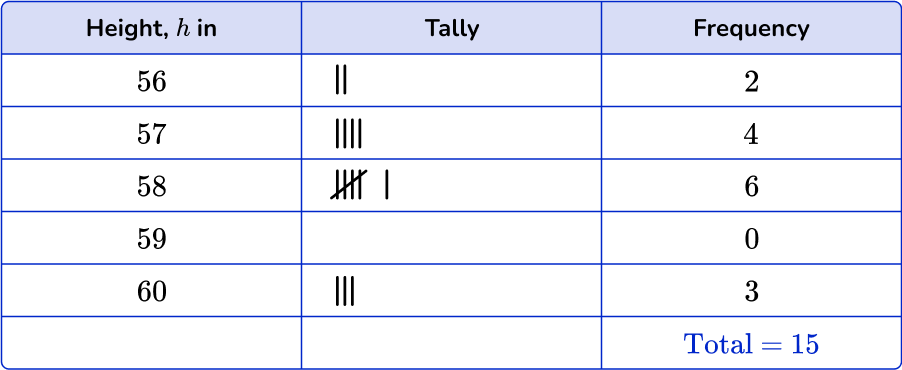
Create a line plot based on the frequency table.
The frequency table was provided for the dot plot.
The variables are the given heights in inches, so list each make along the bottom of the given axes.
Make sure to place the heights in order from first interval to last interval.
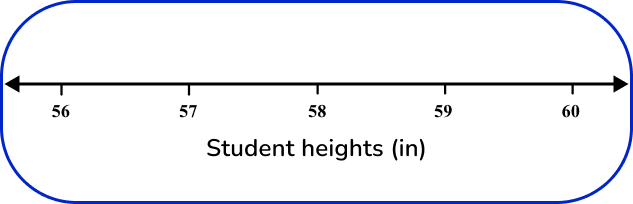
For each tally mark, a dot should be placed above the height until all student heights are accounted for.
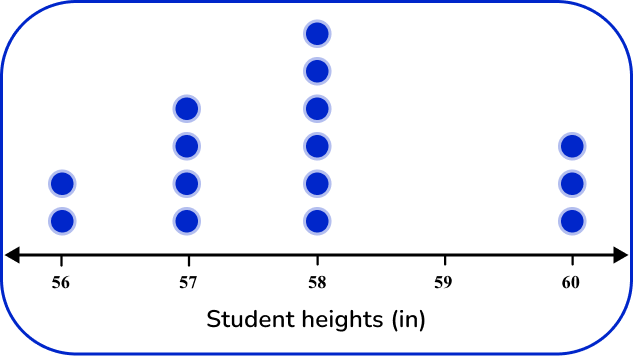
Always give your graph a title and a key to help others read the data provided.
[FREE] Frequency Table Worksheet (Grade 1 to 8)
Use this worksheet to check your grade 1 to 8 students’ understanding of frequency table. Includes 15 questions with answers to identify areas of strength and support!
DOWNLOAD FREE [FREE] Frequency Table Worksheet (Grade 1 to 8)
Use this worksheet to check your grade 1 to 8 students’ understanding of frequency table. Includes 15 questions with answers to identify areas of strength and support!
DOWNLOAD FREETeaching tips for frequency tables
- Using real-life contexts is an easy way to make using frequency tables relevant to students. Students can record the number of observations on a particular topic, or poll their classmates to create frequency tables.
- Once students have the hang of creating frequency tables, students can use the data collected and connect it to creating different types of graphs.
Easy mistakes to make
- Incorrectly counting the items
When attempting to count the items in each group and fill in the frequencies, it is easy to make a mistake. Using tally marks can help with accuracy.
- Believing that only whole numbers can be represented in a frequency table
The data represented in frequency tables can be whole numbers, decimals, fractions, and even negative numbers.
Practice frequency table questions
1. Which is the correct frequency table for the following set of data?
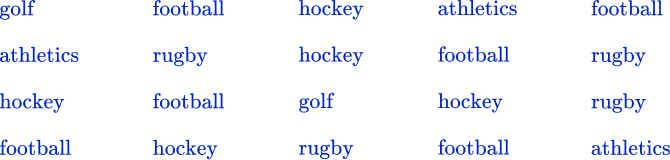
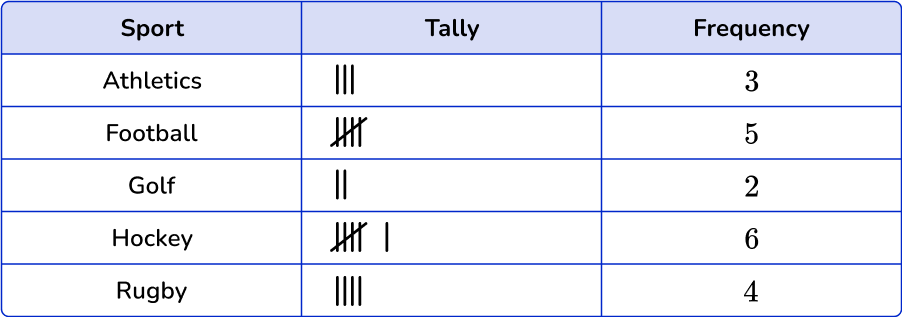

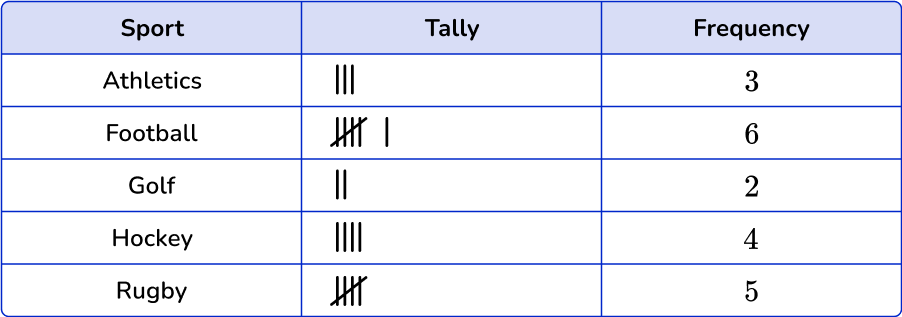
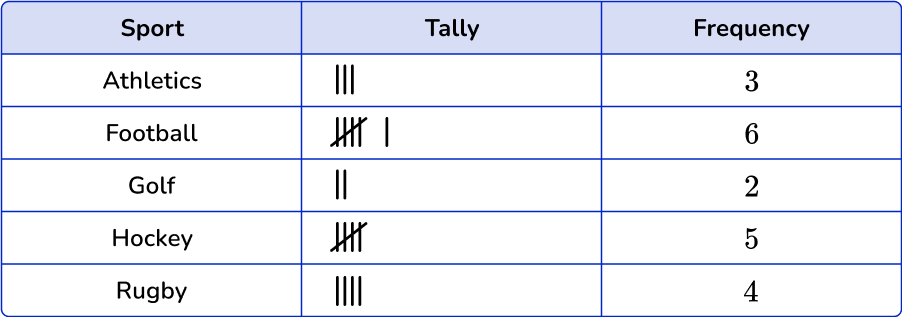

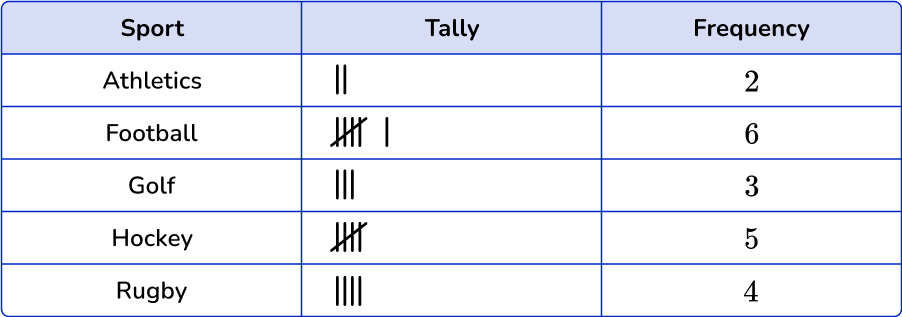
Athletics occurs 3 times in the data set, football 6 times, golf 2 times, hockey 5 times and rugby 4 times.
2. Which is the correct frequency table for the following set of data?
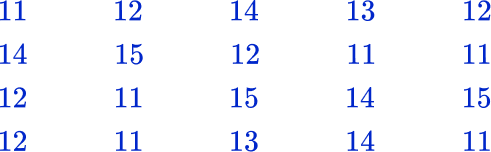
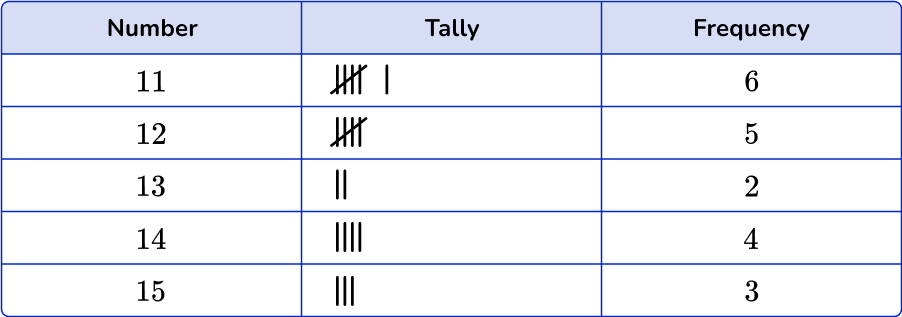
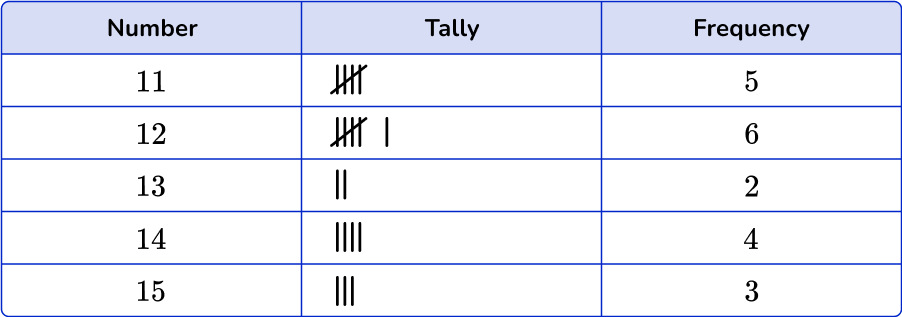

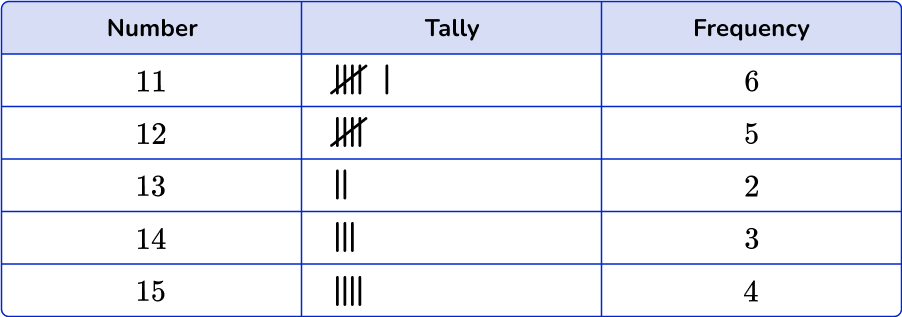
Count the number of times each number is used. The number 11 occurs six times in the data set, the number 12 five times, the number 13 two times, the number 14 five times and the number 15 three times.
3. Which is the correct frequency table for the following set of data?
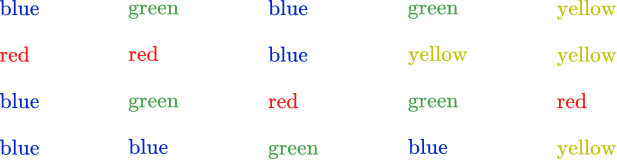
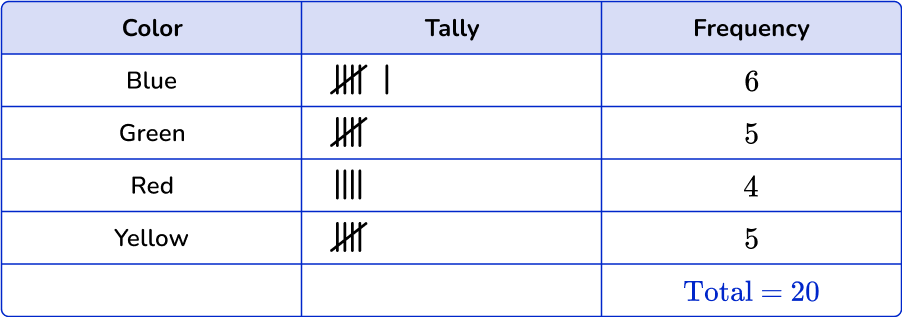
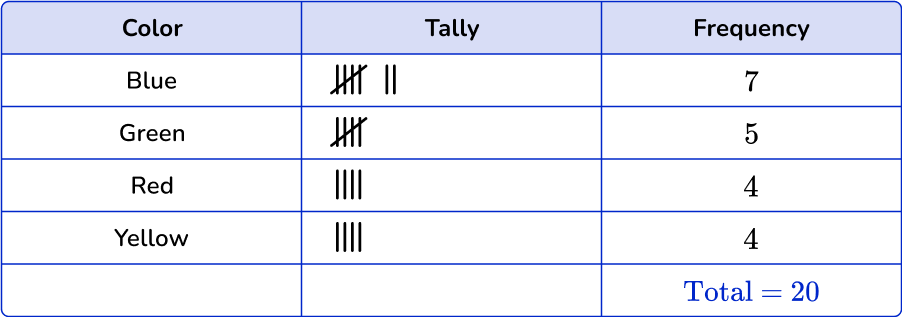
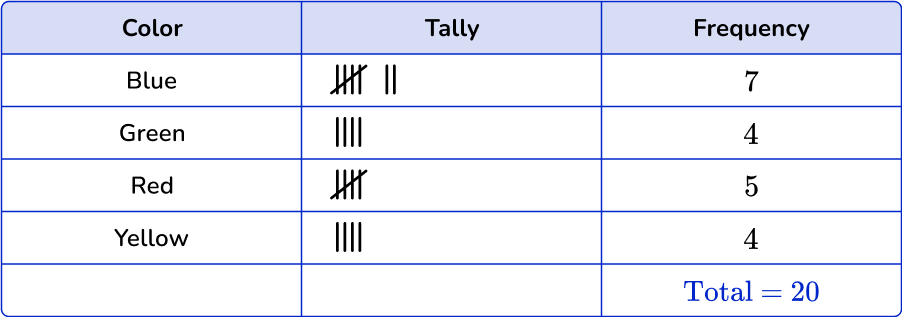
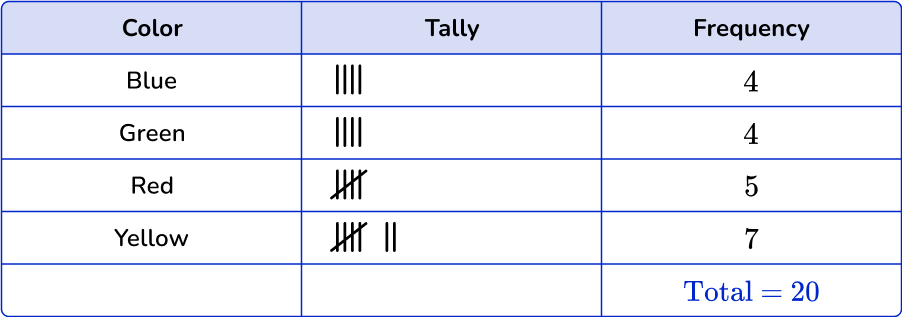
Blue occurs 7 times in the data set, green occurs 5 times, red and yellow occur 4 times each.
4. Which is the correct grouped frequency table for the following set of data?
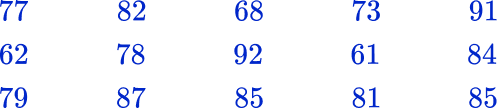

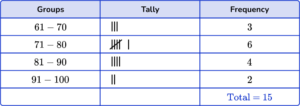
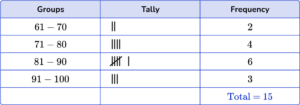
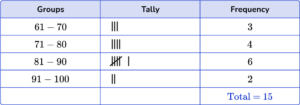
Count the number of times each number is used and place it into the correct group. Numbers between 60-70 happen 3 times, numbers between 71-80 happen 4 times, numbers between 81-90 happen 6 times, and numbers between 91-100 happen 2 times.
5. Which of the following dot plots matches this frequency table?
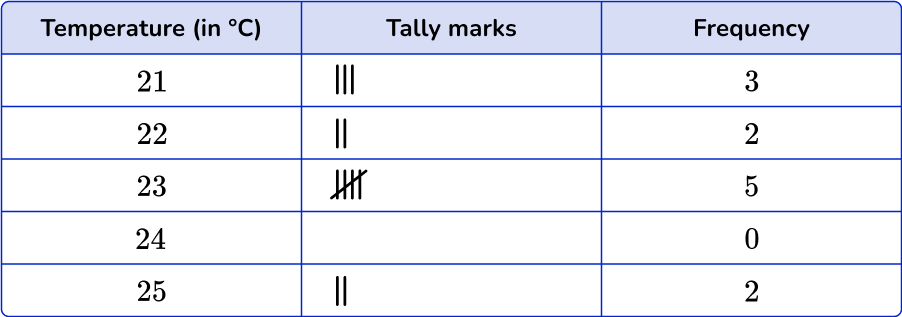
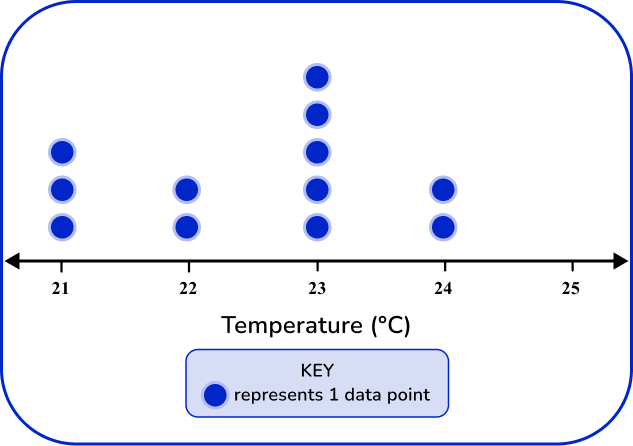
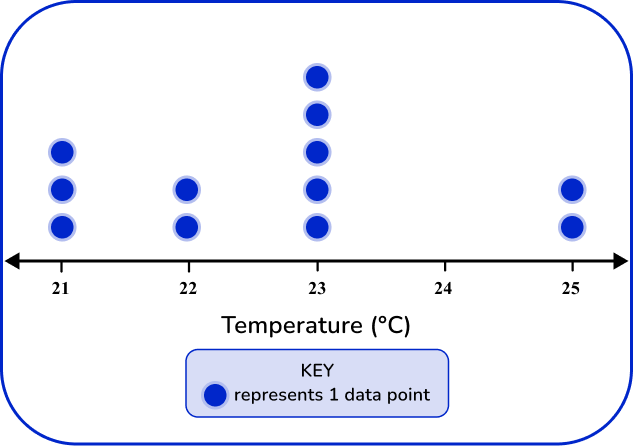
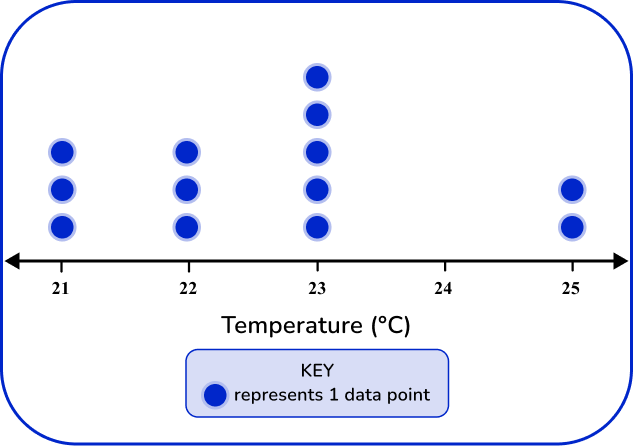
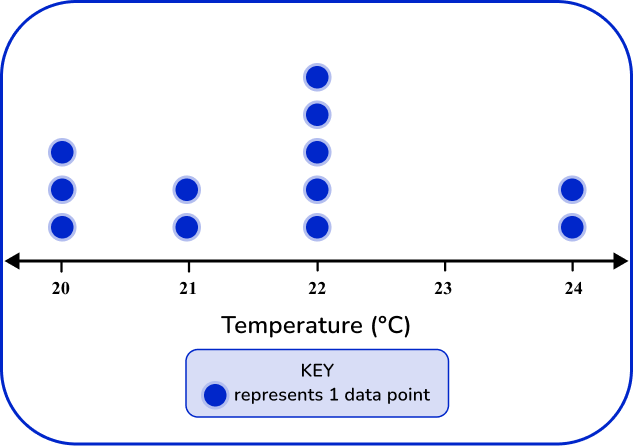
The dot plot should match the tallies and frequency in the frequency table.
21 degrees has 3 data points, 22 degrees has 2 data points, 23 has 5 data points, and 25 has 2 data points.
6. Which of the following dot plots matches this frequency table?
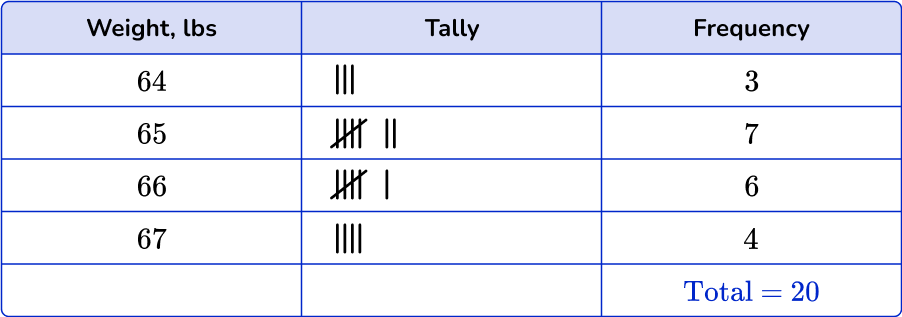
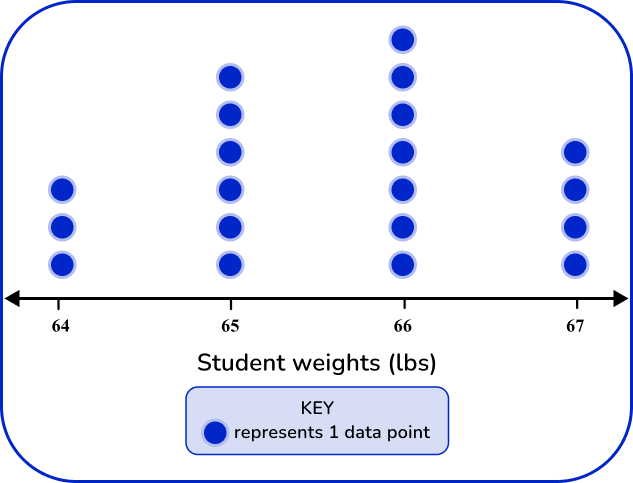
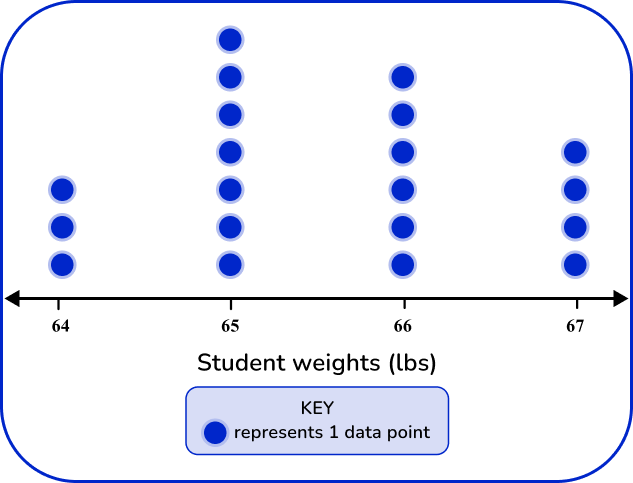
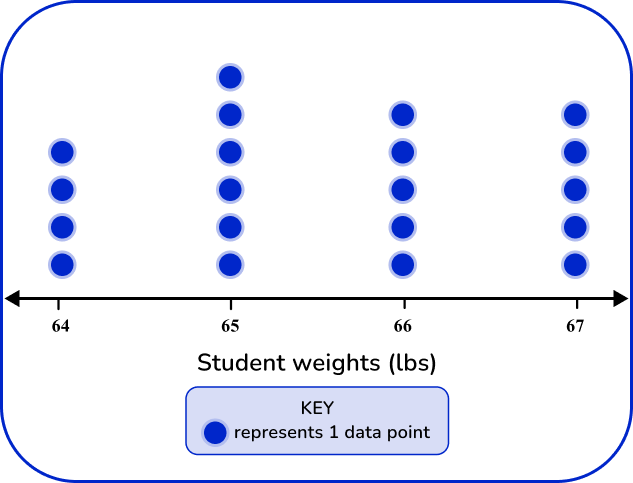
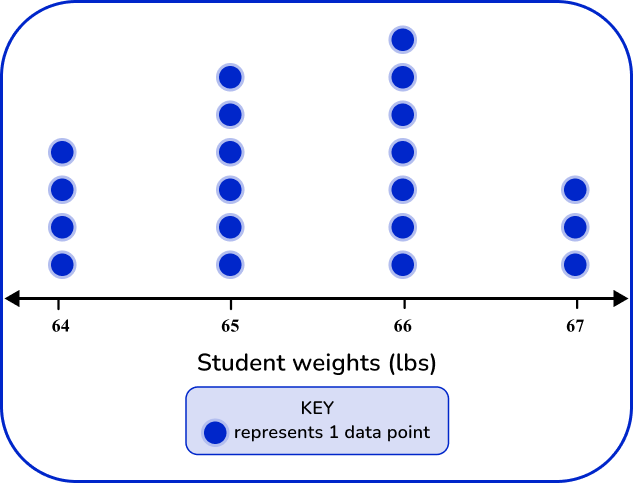
The dot plot should match the tallies and frequency in the frequency table.
64 lbs has 3 data points, 65 lbs has 7 data points, 66 lbs has 6 data points, and 67 lbs has 4 data points.
Frequency table FAQs
A frequency table represents the frequencies of one variable, whereas a contingency table, or two-way table, displays the frequencies of two or more variables at the same time.
A cumulative frequency table displays the cumulative count of the frequencies. In other words, each entry in this table represents the number of data points that fall in that category or any category before it.
The standard deviation is a value that summarizes the variation around the mean. It is another measure that can be calculated from the data in frequency tables.
The next lessons are
- Frequency graph
- Types of sampling
- Probability
- Measurement and data
- Units of measurement
Still stuck?
At Third Space Learning, we specialize in helping teachers and school leaders to provide personalized math support for more of their students through high-quality, online one-on-one math tutoring delivered by subject experts.
Each week, our tutors support thousands of students who are at risk of not meeting their grade-level expectations, and help accelerate their progress and boost their confidence.

Find out how we can help your students achieve success with our math tutoring programs.
[FREE] Common Core Practice Tests (3rd to 8th Grade)
Prepare for math tests in your state with these 3rd Grade to 8th Grade practice assessments for Common Core and state equivalents.
Get your 6 multiple choice practice tests with detailed answers to support test prep, created by US math teachers for US math teachers!