Here you will learn about the mode in math, including what the mode is and how to find it.
Students will first learn about the mode in math as part of statistics and probability in 6 th grade.
What is the mode in math?
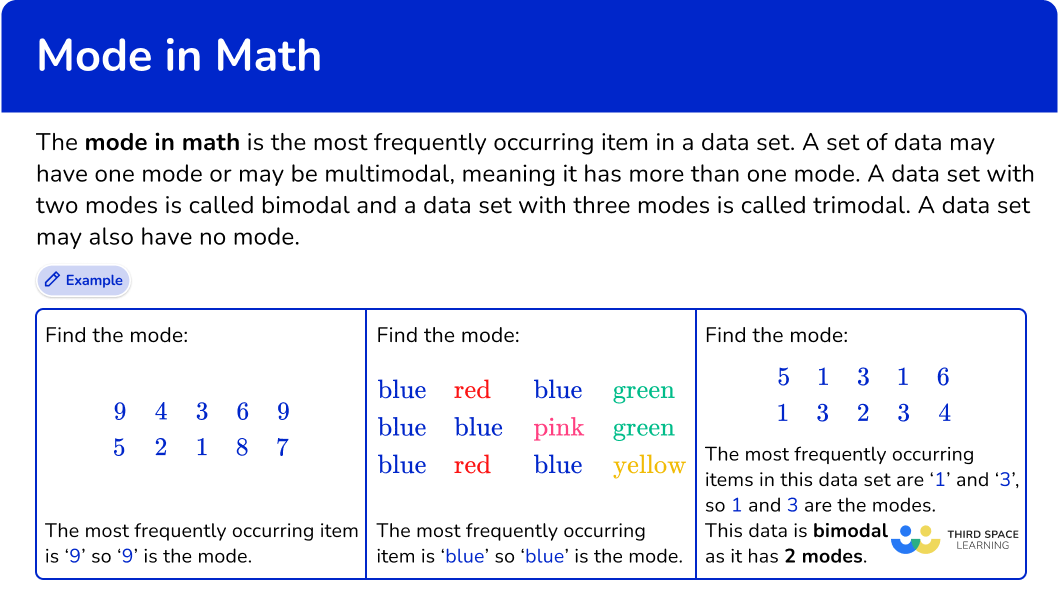
The mode in math is the most frequently occurring item in a data set. A set of data may have one mode or may be multimodal, meaning it has more than one mode.
A data set with two modes is called bimodal and a data set with three modes is called trimodal. A data set may also have no mode.
For example, find the mode:
The most frequently occurring item is ‘9’ , so 9 is the mode.
For example, find the mode:
The most frequently occurring item is ‘blue’, so ‘blue’ is the mode.
For example, find the mode:
The most frequently occurring items in this data set are ‘1’ and ‘3’ , so 1 and 3 are the modes. This data is bimodal as it has \bf{2} modes.
The mode in math or modal value is a measure of central tendency because it describes a set of numbers by identifying a central position within the data.
What is the mode in math?
Common Core State Standards
How does this relate to 6 th grade math?
Grade 6 – Statistics and Probability (6.SP.A.3) Recognize that a measure of center for a numerical data set summarizes all of its values with a single number, while a measure of variation describes how its values vary with a single number.
How to find the mode
In order to find the mode:
Find the most frequently occurring item.
Write down the answer.
[FREE] Averages and Range Check for Understanding (Grade 6)
Use this quiz to check your 6th grade students’ understanding of averages and range. 10+ questions with answers covering a range of 6th grade averages and range topics to identify areas of strength and support!
[FREE] Averages and Range Check for Understanding (Grade 6)
Use this quiz to check your 6th grade students’ understanding of averages and range. 10+ questions with answers covering a range of 6th grade averages and range topics to identify areas of strength and support!
You will need to count the number of times the different words occur. The most common item is ‘red’. The number of times ‘red’ occurs is 3 times.
2Write down the answer.
The mode is red.
Example 2: categorical data
Find the mode of this data set:
You will need to count the number of times the different words occur. The most common item is ‘apple’. The number of times ‘apple’ occurs is 4 times.
The mode is apple.
Example 3: numerical data
Find the mode of this list of numbers:
You will need to count the number of times the different values occur. The most common item is ‘4’. The number of times ‘4’ occurs is 3 times.
The mode (or modal value) is 4.
Example 4: numerical data
Find the mode of this list of numbers:
You will need to count the number of times the different values occur. The most common item is ‘25’. The number of times ‘25’ occurs is 4 times.
The mode (or modal value) is 25.
Example 5: bimodal
Find the mode of this list of numbers:
You will need to count the number of times the different values occur. The most common items are ‘1’ and ‘3’. They both occur 3 times and the other values only occur once.
The mode (or modal value) is 1 and 3.
Example 6: bimodal
Find the mode of this list of numbers:
You will need to count the number of times the different values occur. The most common items are ‘3’ and ‘5’. They both occur 2 times and the other values only occur once.
The mode (or modal value) is 3 and 5.
Teaching tips for mode in math
Provide students with data sets in which the items include various types of numerical values including fractions, decimals, integers, and whole numbers.
The data sets can also be varied by the number of numbers in the set. Start with data sets that include a low number of values and gradually increase the number of values as well as the complexity of the list of values.
For struggling students, provide hands-on activities that involve sorting and counting objects rather than worksheets showing only numerical values. For example, provide a basket of colored cubes or counters and have students identify the most frequent color by physically grouping and counting the objects.
Talk about how outliers can affect the mode. It’s important to note that outliers are less likely to skew the mode than the mean or median. This is because the mode focuses on frequency rather than numerical values or position. However, the presence of extreme outliers can still impact the mode if they occur frequently enough to become the most common value(s) in the data set.
Easy mistakes to make
Confusing mode for median or mean Students hear the terms mean, median, and mode mentioned together frequently in math and can confuse the three terms. Mean is the average value of a data set with numerical values, median is the middle number or middle value when the list of values is placed in ascending order, and mode is the piece of data with the highest frequency within the data set.
Thinking a data set must have a mode A data set can have 1 mode or it can be multimodal (have more than 1 mode). But it is possible that a data set has no mode at all.
Naming the frequency as the mode The mode will be the item – NOT the frequency. For example, Find the mode: There are 3 As, \, 2 \, Bs , and 6 \, Cs. The item that occurs the most often is ‘C.’ So the mode is ‘C.’ As ‘C’ occurs 6 times, the frequency of C is 6.
The most common item is ‘yellow’. The number of times ‘yellow’ occurs is 2 times. The other colors only occur once.
2. Find the mode:
Medium
Large
Small
There is no mode
The most common item is ‘small.’ The number of times ‘small’ occurs is 3 times. ‘Medium’ occurs twice and ‘large’ once.
3. Find the mode:
2
3
4
1
The most common item is ‘1.’ The number of times ‘1’ occurs is 2 times. The other numbers only occur once.
4. Find the mode of the following data set:
6
2
2 and 6
There is no mode
The most common item is ‘2’. The number of times ‘2’ occurs is 3 times. The number of times ‘6’ occurs is 2 times, and the other numbers only occur once.
5. Find the mode of this set of numbers:
There is no mode
13
16
12
Each number occurs only one time. Therefore, there is no mode.
6. Find the mode:
10
20
30
10 and 30
The most common items are 10 and 30. They both occur 3 times. This data has two modes. It is bimodal.
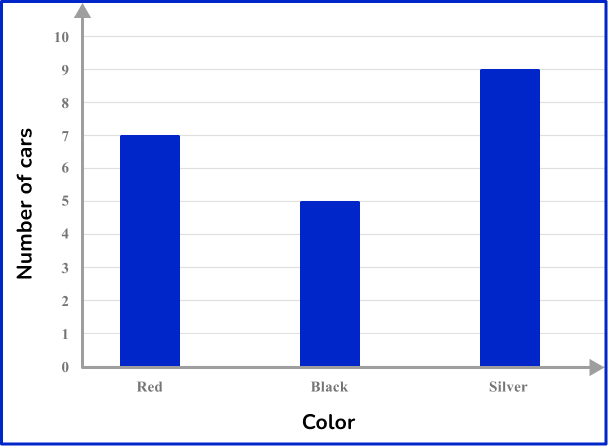
7. Theo did a survey of the color of the cars passing his house. The cars were only red, black, silver or blue.
The chart shows the number of red cars, the number of black cars and the number of silver cars. Theo saw a total of 25 cars.
What is the mode of the complete set of data?
red
silver
black
blue
First, you need to find the number of blue cars. To do this, add up the data values of the cars shown on the graph. Then, subtract this number from the total number of cars.
Red – 7
Black – 5
Silver – 9
Total =21
Total number of cars =25
25-21=4. There were 4 blue cars.
This means the color of the car that had the highest frequency was silver, so silver is the mode of the data set.
Mode in math FAQs
What is the mode in math?
The mode in math is the most frequently occurring item in a data set.
How do you find the mode of a data set?
To find the mode of a data set, look at the entire list of values in the data set and determine which item or number has the highest frequency or occurs most often in the set.
What are descriptive statistics?
Descriptive statistics are used to condense or arrange a collection of data. Arithmetic mean, median, mode, and range are frequently used descriptive statistics to provide an overview of the data set.
How is finding the mode different from finding the median?
Finding the mode is about identifying the value that appears most often in a data set, while finding the median is about determining the middle value in a data set. The mode is about frequency, while the median is about position.
At Third Space Learning, we specialize in helping teachers and school leaders to provide personalized math support for more of their students through high-quality, online one-on-one math tutoring delivered by subject experts.
Each week, our tutors support thousands of students who are at risk of not meeting their grade-level expectations, and help accelerate their progress and boost their confidence.
We use essential and non-essential cookies to improve the experience on our website. Please read our Cookies Policy for information on how we use cookies and how to manage or change your cookie settings.Accept
Privacy & Cookies Policy
Privacy Overview
This website uses cookies to improve your experience while you navigate through the website. Out of these, the cookies that are categorized as necessary are stored on your browser as they are essential for the working of basic functionalities of the website. We also use third-party cookies that help us analyze and understand how you use this website. These cookies will be stored in your browser only with your consent. You also have the option to opt-out of these cookies. But opting out of some of these cookies may affect your browsing experience.
Necessary cookies are absolutely essential for the website to function properly. This category only includes cookies that ensures basic functionalities and security features of the website. These cookies do not store any personal information.
Any cookies that may not be particularly necessary for the website to function and is used specifically to collect user personal data via analytics, ads, other embedded contents are termed as non-necessary cookies. It is mandatory to procure user consent prior to running these cookies on your website.
![[FREE] Averages and Range Check for Understanding (Grade 6)](https://thirdspacelearning.com/wp-content/uploads/2023/11/Averages-and-Range-listing-image.png)