High Impact Tutoring Built By Math Experts
Personalized standards-aligned one-on-one math tutoring for schools and districts
In order to access this I need to be confident with:
Place value Multiplication and division Addition and subtraction Mean median mode Mean in math Median Mode in math Range in mathStem and leaf plot
Here you will learn about stem and leaf plots, including drawing, interpreting, and comparing them.
Students will first learn about stem and leaf plots as part of statistics and probability in 7 th grade.
Every week, we teach lessons on stem and leaf plots to students in schools and districts across the US as part of our online one-on-one math tutoring programs. On this page we’ve broken down everything we’ve learnt about teaching this topic effectively.
What is a stem and leaf plot?
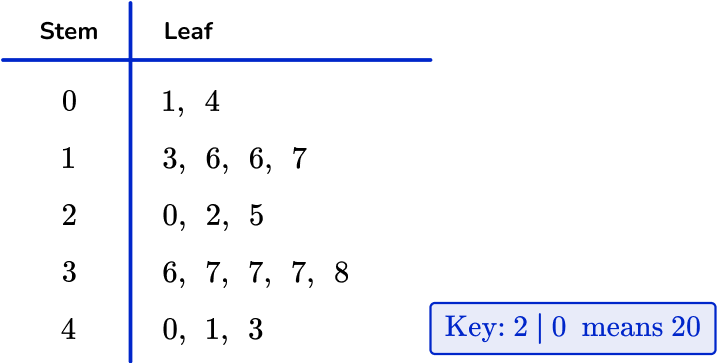
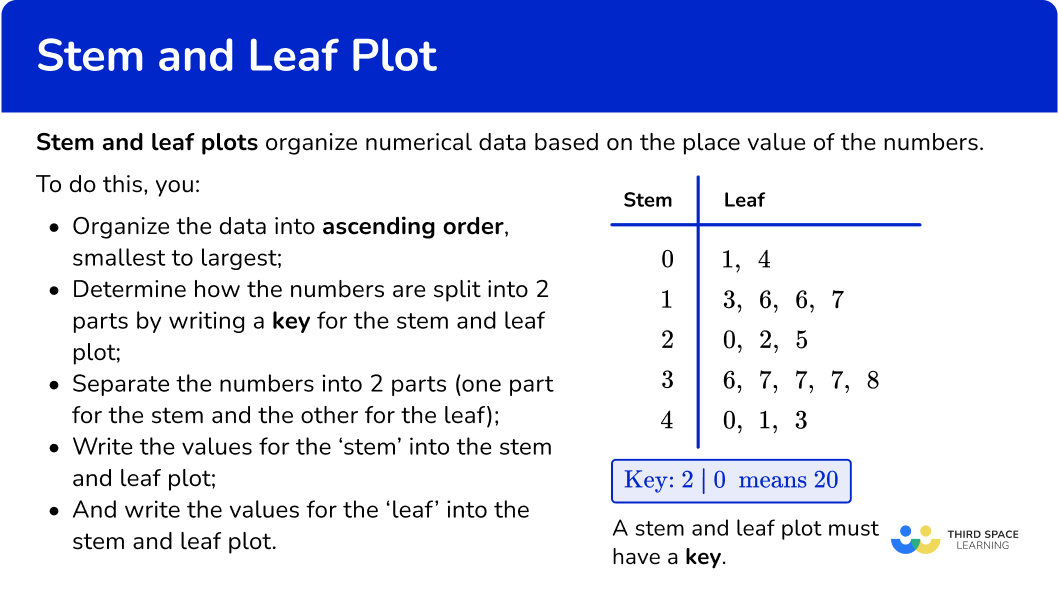
A stem and leaf plot is a method of organizing numerical data based on the place value of the numbers.
Each number is split into two parts:
- The first digit(s) form the stem.
- The last digit forms the leaf.
The number of digits for the stem can vary, but the number of digits for the leaf should only ever contain a single digit.
For example, if the numerical data contains all whole numbers, the numbers in the tens place and greater would make up the stem values while all numbers in the ones place would make up the leaf values.
Each piece of numerical data will be written with the last digit to the right of a vertical line and all other digits to the left of the vertical line. For example, the number 154 would be split into two parts where the digits \bf{15} would be the stem and \bf{4} would be the leaf.

To set up a stem and leaf plot you need to:
- Organize the data into ascending order, smallest to largest.
- Determine how the numbers are split into 2 parts by writing a key for the stem and leaf plot.
- Write the values for the ‘stem’ into the stem and leaf plot.
- Write the values for the ‘leaf’ into the stem and leaf plot.
NOTE: A stem and leaf plot must have a key (sometimes referred to as a legend). This explains how to convert the digits in the stem and leaf plot into a single data point.
You can use stem and leaf plots to calculate averages like the median, the mode and the mean, and to calculate measures of spread like the range and the interquartile range.
![[FREE] Stem And Leaf Plot Worksheet (Grade 7)](https://thirdspacelearning.com/wp-content/uploads/2024/06/Stem-and-Leaf-Plot-Worksheet-listing-image.png)
[FREE] Stem And Leaf Plot Worksheet (Grade 7)
Use this worksheet to check your grade 7 students’ understanding of stem and leaf plot. 15 questions with answers to identify areas of strength and support!
DOWNLOAD FREE [FREE] Stem And Leaf Plot Worksheet (Grade 7)
Use this worksheet to check your grade 7 students’ understanding of stem and leaf plot. 15 questions with answers to identify areas of strength and support!
DOWNLOAD FREEDual stem and leaf plot
Comparing data sets is simplified by using a dual stem and leaf plot which have two sets of data represented back to back.
For example, here are two sets of data showing test scores of 20 males and 20 females.
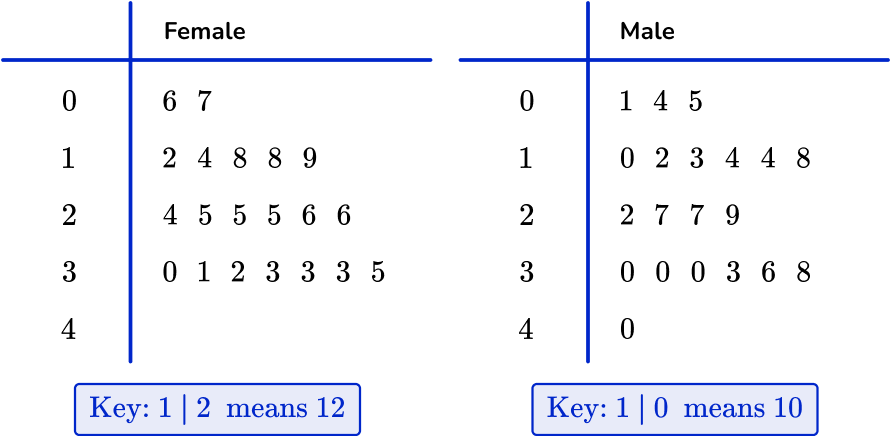
By combining them together to form one dual stem and leaf plot, you can directly compare the two sets of data.
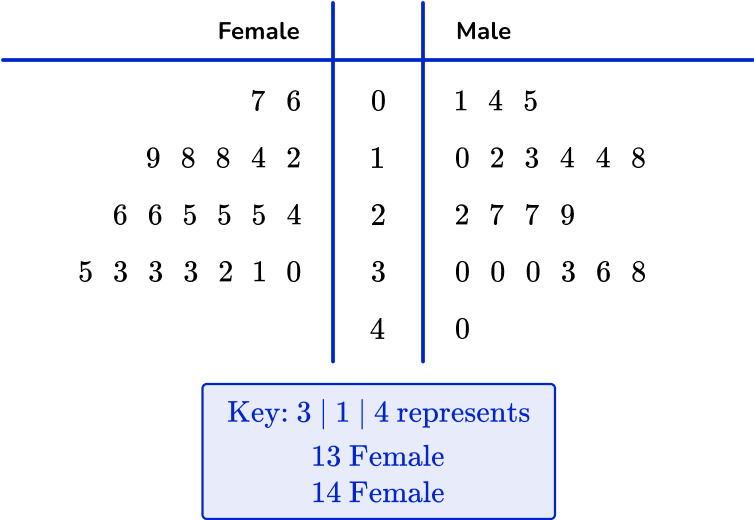
The data must be closely related for it to be compared effectively on the diagram. Note that the digits in the leaf for females is still in ascending order but from right to left, rather than left to right. Also, the key represents the data values for each side of the stem and leaf plot.
What is a stem and leaf plot?
Common Core State Standards
How does this relate to 7 th grade math?
- Grade 7 – Statistics and Probability (7.SP.B.4)
Use measures of center and measures of variability for numerical data from random samples to draw informal comparative inferences about two populations. For example, decide whether the words in a chapter of a seventh-grade science book are generally longer than the words in a chapter of a fourth-grade science book.
How to draw a stem and leaf plot
In order to draw a stem and leaf plot:
- Order the numbers from smallest to largest.
- Split the numbers into two parts; the last part must be one digit only.
- Put the values into the diagram and create a key.
Stem and leaf plot examples
Example 1: two digit numbers
The data below shows the ages of people at a party.
35, \quad 50, \quad 37, \quad 44, \quad 53, \quad 41, \quad 39, \quad 45, \quad 48, \quad 56
Draw an ordered stem and leaf plot for the data. Remember to include a suitable key.
- Order the numbers from smallest to largest.
35, \quad 50, \quad 37, \quad 44, \quad 53, \quad 41, \quad 39, \quad 45, \quad 48, \quad 56
becomes
35, \quad 37, \quad 39, \quad 41, \quad 44, \quad 45, \quad 48, \quad 50, \quad 53, \quad 56
2Split the numbers into two parts; the last part must be one digit only.
The numbers in the data will split into tens and ones, so 35 will be 3 and 5 ( 3 represents 30 or 3 tens, and 5 is 5 ones).
3Put the values into the diagram and create a key.
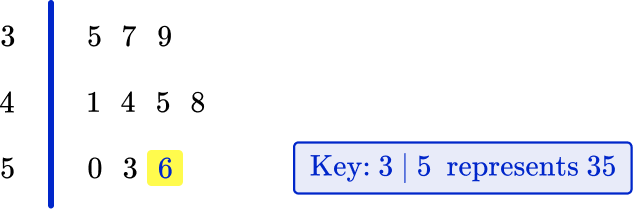
Example 2: three digit numbers
The data below shows the length in centimeters of 13 long jumps on a 9 th grade sports day.
153, 144, 148, 140, 149, 145, 144, \\\\ \quad 142, 158, 135, 140, 139, 160.
Draw an ordered stem and leaf plot for the following set of data. Remember to include a suitable key.
153, 144, 148, 140, 149, 145, 144, 142, 158, 135, 140, 139, 160
becomes
135, 139, 140, 140, 142, 144, 144, 145, 148, 149, 153, 158, 160.
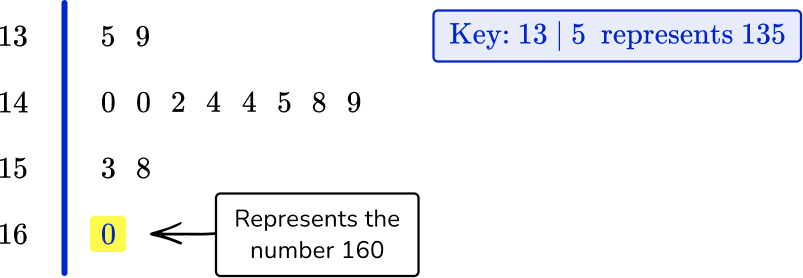
The numbers in the data will be split into two parts: 148 will become 14 and 8 ( 14 represents 140 or 14 tens, and 8 represents 8 ones).
Example 3: decimal values
A group of students are making model gargoyles out of clay. The weight of each gargoyle is written below.
1.5 \, kg \quad 2.3 \, kg \quad 1.6 \, kg \quad 3.1 \, kg \quad 3.1 \, kg \\\\ 1.4 \, kg \quad 2.5 \, kg \quad 1.7 \, kg \quad 1.8 \, kg \quad 2.4 \, kg
Draw an ordered stem and leaf plot for data. Remember to include a suitable key.
1.5 \, kg , \, 2.3 \, kg, \, 1.6 \, kg, \, 3.1 \, kg, \, 3.1 \, kg, \, 1.4 \, kg, \, 2.5 \, kg, \, 1.7 \, kg, \, 1.8 \, kg, \, 2.4 \, kg
becomes
1.4 \, kg, \, 1.5 \, kg, \, 1.6 \, kg, \, 1.7 \, kg, \, 1.8 \, kg, \, 2.3 \, kg, \, 2.4 \, kg, \, 2.5 \, kg, \, 3.1 \, kg, \, 3.1 \, kg.
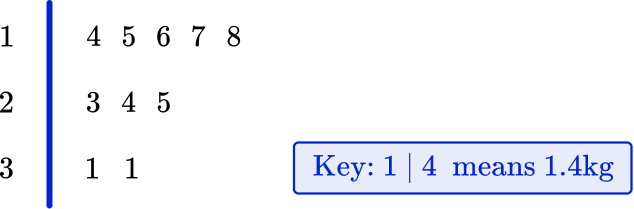
As the numbers are decimals, they are split like this – 1.4 \, kg splits into ones (1) and tenths (4).
How to interpret a stem and leaf plot
In order to interpret a stem and leaf plot:
- Read the question(s).
- Use the information in the stem and leaf plot to answer the question(s).
Example 4: answering questions using a stem and leaf plot
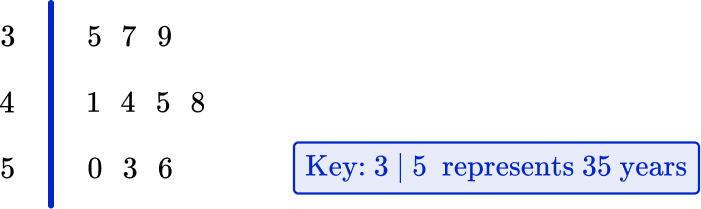
The stem and leaf plot below shows the ages of a group of people at a party.
(a) How many people are there in the group?
(b) What age is the youngest member of the group?
(c) What age is the oldest member of the group?
(d) How many people are under 45?
(e) How many people are 45 and over?
(a) How many people are there in the group?
Count all the numbers in the leaf, so the answer is 10 people.
(b) What age is the youngest member of the group?
The first number in the leaf is the smallest value, so the answer is 35 years old.
(c) What age is the oldest member of the group?
The last number in the leaf is the largest value, so the answer is 56 years old.
(d) How many people are under 45?
Count all the values in the leaf that are less than 45, so the answer is 5 people.
(e) How many people are 45 and over?
Count all the people in the leaf that are 45 and above, so the answer is 5 people.
Example 5: calculating averages and the range from a stem and leaf plot
The stem and leaf plot below shows the weight of 10 puppies in kilograms.
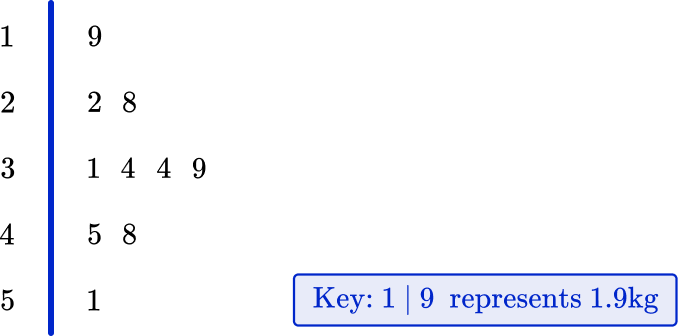
(a) What is the modal weight?
(b) What is the median weight?
(c) What is the range of the weights?
(d) What is the mean weight of the puppies?
(a) What is the modal weight?
The mode is the most frequent value, so the mode for this set of data is 3.4 \, kg, as it occurs twice.
(b) What is the median weight?
The median is the middle value. As there are 10 values, the median is located in the position \cfrac{10+1}{2}=5.5.
Count 5 and a half places; in this case, that is between 3.4 and 3.4. So you would add them up and divide by 2, which gives you a median of 3.4 \, kg.
(c) What is the range of the weights?
The range is calculated by subtracting the lowest value from the highest value.
5.1-1.9=3.2 \mathrm{~kg}
(d) What is the mean weight of the puppies?
The mean is calculated by adding up all the numbers and dividing by the number of values. The sum of all 10 values is 35.1. Dividing by 10, you get a mean of 3.51 \, kg.
35.1 \div 10=3.51 \mathrm{~kg}
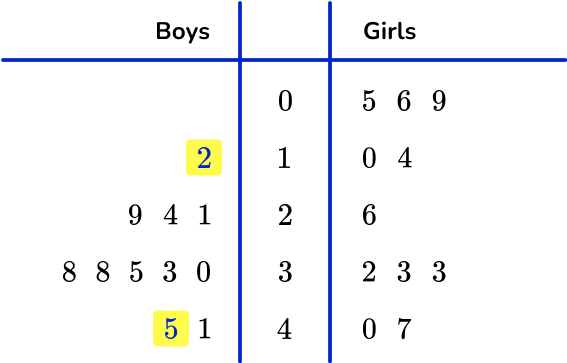
Example 6: dual stem and leaf plot
This dual stem and leaf plot shows test scores for the students in Miss Thomas’ class.
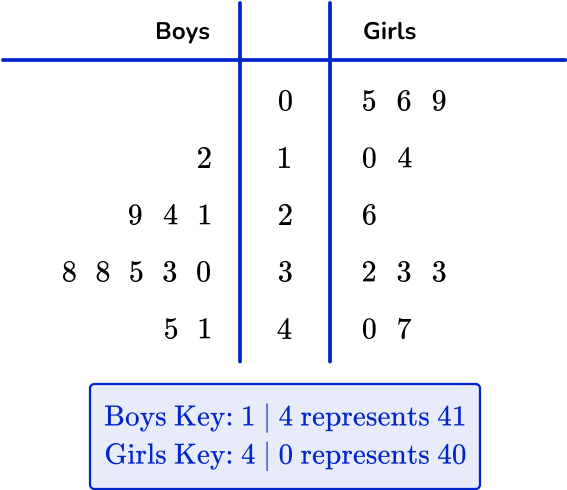
(a) What is the range of the boys’ scores?
(b) What is the median of the girls’ scores?
(c) What is the mode for the boys’ scores?
(d) Compare the median and range of the boys’ and girls’ scores.
(a) What is the range of the boys’ scores?
The range is found by subtracting the lowest from the highest values on the ‘boys’ side of the diagram.
45-12=33
The range is 33.
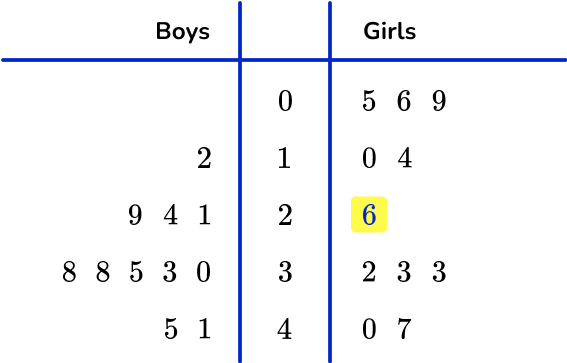
(b) What is the median of the girls’ scores?
The median is the middle value on the girls’ side of the diagram. There are 11 values, so the middle value is found by adding 1 and dividing by 2. 11+1 \div 2=6 \text{th} place. The median is therefore 26.
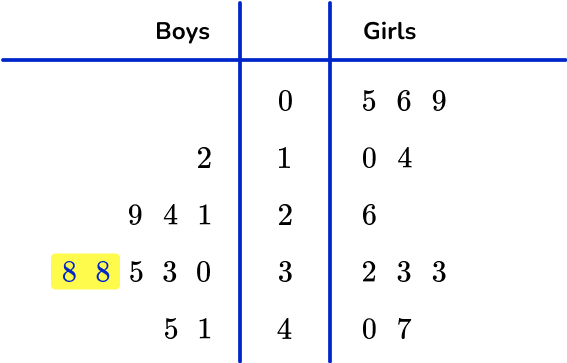
(c) What is the mode for the boys’ scores?
The mode is the most common number.
Here, the mode is 38 as it is the most frequent value for the boys.
(d) Compare the median and range of the boys’ and girls’ scores.
You need to compare the median and range for each set of data:
The boys did better on average (median =33 ) than the girls (median =26 ).
The girls’ scores (range =42 ) were more spread out than the boys (range =33 ).
Teaching tips for stem and leaf plot
- Start with simple data values ( 2 digit numbers whole numbers) and a clear explanation. Begin by explaining what a stem and leaf plot is and how it represents a set of data. Emphasize that it shows individual values split into stems (tens digit) and leaves (ones digit).
- Offer multiple guided examples where students can practice creating stem and leaf plots. Provide data sets and worksheets that gradually increase in complexity.
- Connect stem and leaf plots to real-life scenarios to make them more relatable. Use examples such as test scores, measurements, or survey data to show how stem and leaf plots can be used to analyze and interpret information.
- Provide visual aids or display examples around the classroom for students to differentiate between graph types including stem and leaf plots, bar graphs, histograms, and dot plots, and box plots.
Easy mistakes to make
- Incorrectly reading the numbers in the diagram
For example, for the following stem and leaf plot, the value of 13|5 is misinterpreted as the value 5, instead of 135.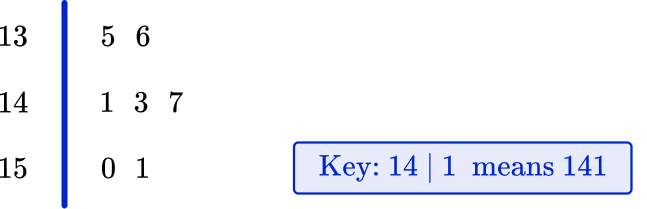
- Miscounting
A common error is to incorrectly count the numbers in a stem and leaf plot when calculating an average or range. It is a good idea to mark off each number to avoid missing a number.
- More than one digit for the leaf
The leaf must only be one digit, otherwise the data can be greatly misinterpreted. Make sure that the smallest place value for the data is used for the leaf.
Related representing data lessons
Practice stem and leaf plot questions
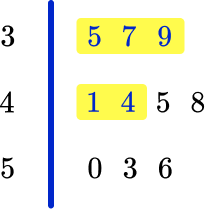
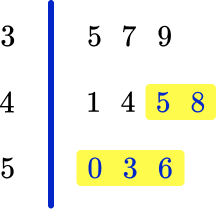
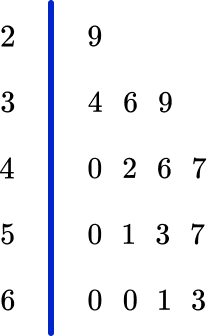
1. Which stem and leaf plot matches this data?
29 \, cm \quad 60 \, cm \quad 51 \, cm \quad 34 \, cm \\\\ 42 \, cm \quad 61 \, cm \quad 46 \, cm \quad 36 \, cm
63 \, cm \quad 50 \, cm \quad 57 \, cm \quad 53 \, cm \quad \\\\ 60 \, cm \quad 39 \, cm \quad 47 \, cm \quad 40 \, cm
Use the key ![]() .
.
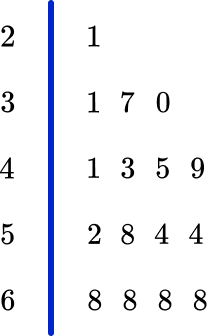

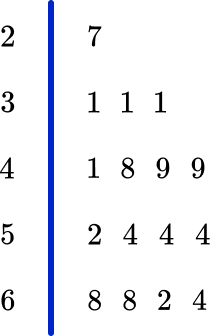


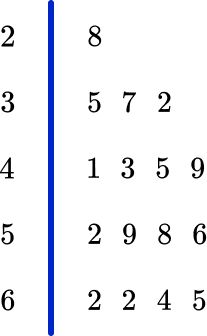
By checking the highest and lowest values from the list ( 29 is the lowest and 63 is the highest), you can see that the correct stem and leaf plot is:
2. The stem and leaf plot below shows heights of Mrs. Wilks’ flowers in centimeters.
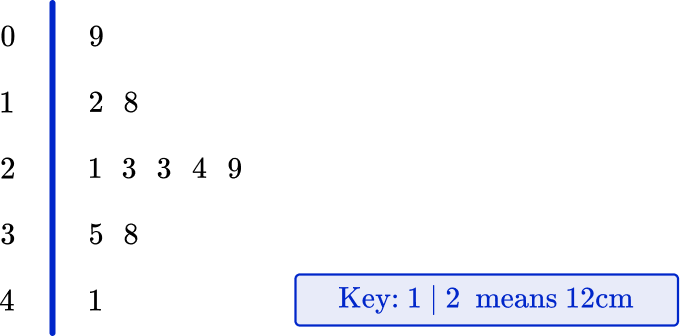
What is the range of the height of Mrs. Wilks’ flowers?
The range of the data is found by subtracting the lowest value from the highest value.
41-9=32 \mathrm{~cm}
3. Below is a stem and leaf plot showing the scores of 18 javelin throws in a school sports day. The longest throw wins.
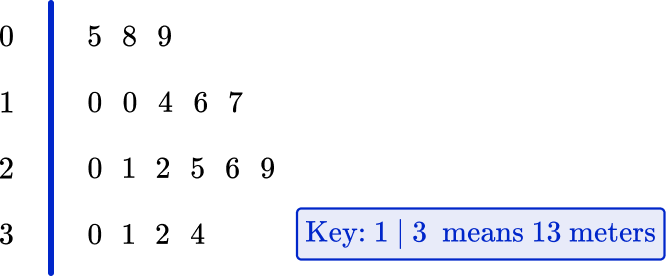
What was the mean distance thrown?
The mean is the sum of all the values, divided by the total number of values.
5+8+9+10+10+14+16+17+20+21+22+25+26+29+30+31+32+34=359 \, m
359 \div 18=19.9\overline{4} \mathrm{~m}=19.9 \mathrm{~m} \text { (to the nearest tenth) }
4. The stem and leaf plot below represents a sample of the lengths of leaves from a tree.
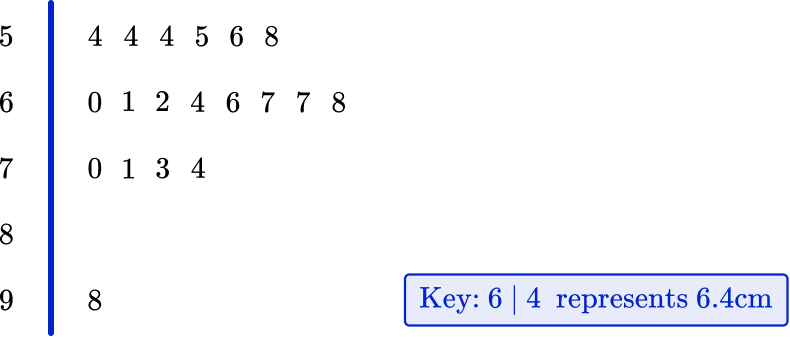
Which average would be the most suitable to represent the data?
Mean
Median
Range
Mode
As there is one value that is very large, this would affect the mean and the range. The mode is unsuitable because it does not use all of the data. The median is most suitable, as this is not affected as much as the mean when there are outliers.
5. The stem and leaf plot below shows the maximum weight of a deadlift lifted by each competitor in a weightlifting competition. Everyone managed to record at least one lift.
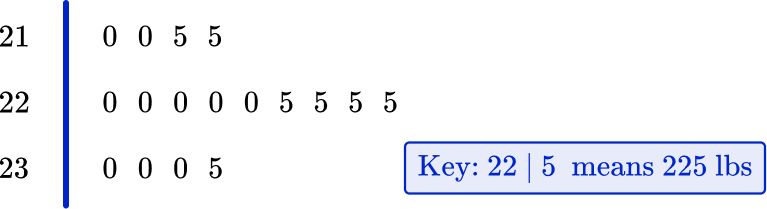
What was the median weight lifted?
The median is located at the middle position in the data.
17 \div 2=8.5^{\text {th }} value. This value lies between 220 \, lbs and 220 \, lbs.
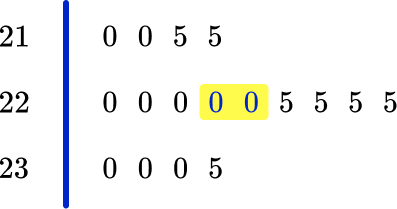
As these two values are the same, the median is 220 \, lbs.
6. 42 people competed in a local 3 legged race. The time for each pair was recorded in a back to back stem and leaf plot.
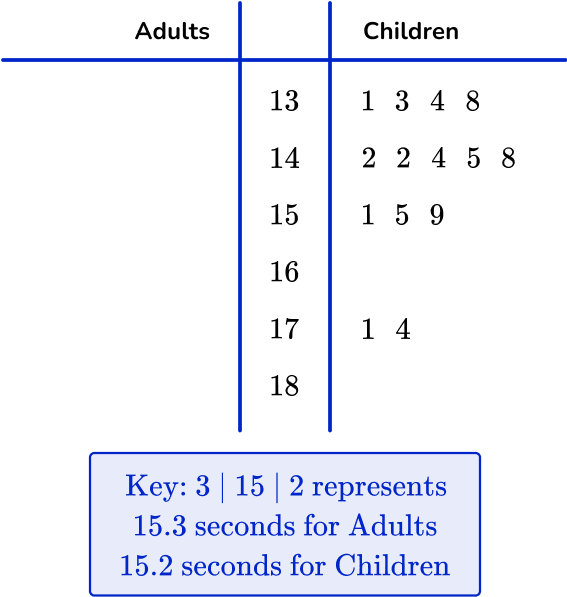
Select the completed stem and leaf plot for the adult race using the results below.
16.3s \quad 18.1s \quad 15.9s \quad 16.1s \quad 17.4s \quad 18.9s \quad 17.5s
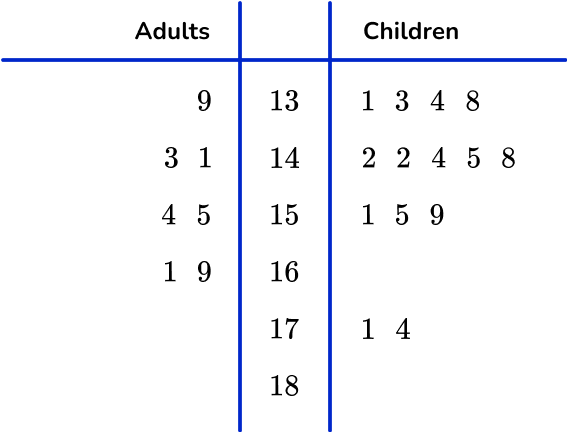
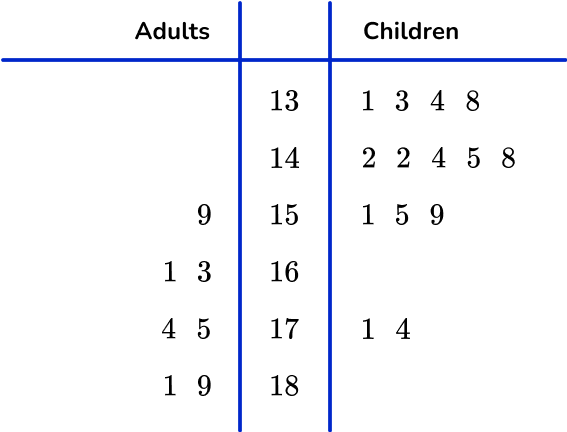
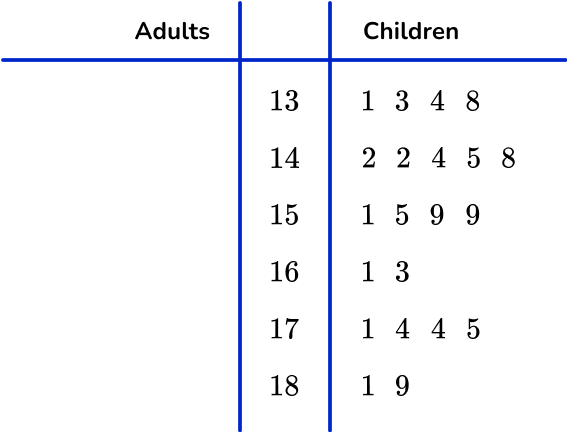
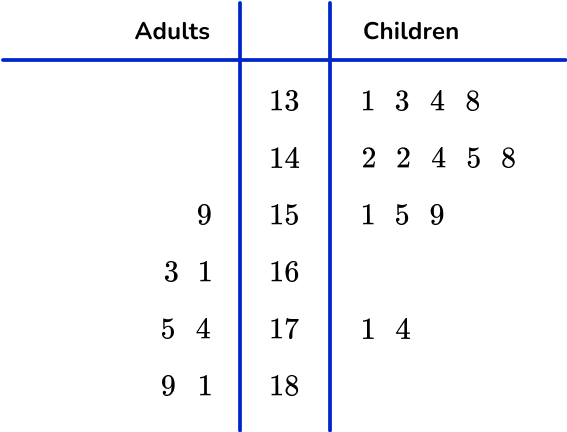
The values are written:
- In the correct row.
- In order (right to left) from the stem.
- On the left side of the stem and leaf plot and to the left of the vertical line.

Stem and leaf plot FAQs
A stem and leaf plot is a method of organizing numerical data based on the place value of the numbers. A stem and leaf plot can help visualize the shape of a distribution for quantitative data.
A stem and leaf plot may also be called a stem plot, a stem plot diagram, a stem and leaf diagram, or a stem and leaf display.
The next lessons are
- Frequency table
- Frequency graph
- Sampling methods
- Represent and interpret data
Still stuck?
At Third Space Learning, we specialize in helping teachers and school leaders to provide personalized math support for more of their students through high-quality, online one-on-one math tutoring delivered by subject experts.
Each week, our tutors support thousands of students who are at risk of not meeting their grade-level expectations, and help accelerate their progress and boost their confidence.

Find out how we can help your students achieve success with our math tutoring programs.
[FREE] Common Core Practice Tests (3rd to 8th Grade)
Prepare for math tests in your state with these 3rd Grade to 8th Grade practice assessments for Common Core and state equivalents.
Get your 6 multiple choice practice tests with detailed answers to support test prep, created by US math teachers for US math teachers!