High Impact Tutoring Built By Math Experts
Personalized standards-aligned one-on-one math tutoring for schools and districts
Quartile
Here you will learn about a quartile, including what a quartile is, how to find the lower quartile and upper quartile for a set of data, and why these measures are useful.
Students will first learn about quartiles as part of statistics and probability in 6 th grade.
Every week, we teach lessons on quartiles to students in schools and districts across the US as part of our online one-on-one math tutoring programs. On this page we’ve broken down everything we’ve learnt about teaching this topic effectively.
What is a quartile?
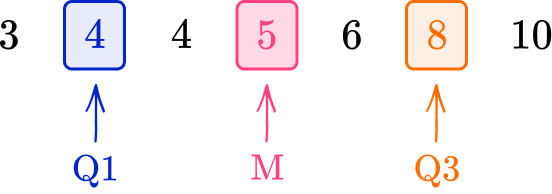
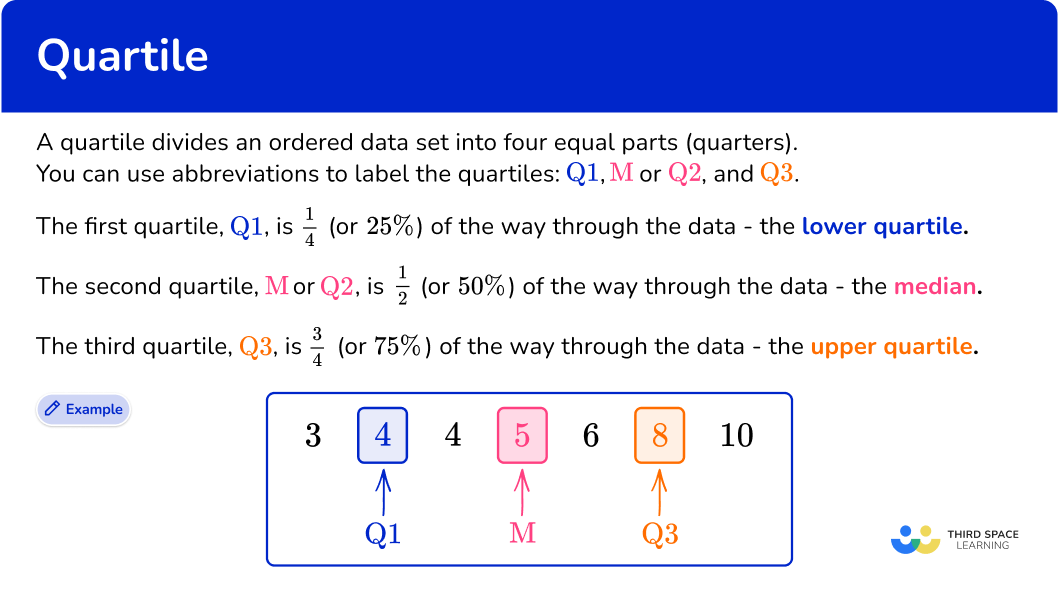
A quartile divides an ordered data set into four equal parts (quarters). You can use abbreviations to label the quartiles: Q1, M or Q2, and Q3.
The first quartile, Q1, is \cfrac{1}{4} \: ( or 25 \%) of the way through the data – the lower quartile.
The second quartile, M or Q2, is \cfrac{1}{2} \: ( or 50 \%) of the way through the data – the median.
The third quartile, Q3 is \cfrac{3}{4} \: ( or 75 \%) of the way through the data – the upper quartile.
You can only find quartiles for quantitative (numerical) data sets, but they can be found for both discrete and continuous quantitative data sets.
Remember, discrete data is data that can only take certain values (counted data), whereas continuous data can take any value within a given range (measured data).
For a small data set, you can find quartiles by simply counting and finding the correct data points.
For example,
![[FREE] Quartile Worksheet (Grade 6)](https://thirdspacelearning.com/wp-content/uploads/2024/06/Quartile-Worksheet-listing-image.png)
[FREE] Quartile Worksheet (Grade 6)
Use this worksheet to check your grade 6 students’ understanding of quartile. 15 questions with answers on how to find quartiles for a set of data, to identify areas of strength and support!
DOWNLOAD FREE NOW [FREE] Quartile Worksheet (Grade 6)
Use this worksheet to check your grade 6 students’ understanding of quartile. 15 questions with answers on how to find quartiles for a set of data, to identify areas of strength and support!
DOWNLOAD FREE NOWInterquartile range
Finding the lower quartile and upper quartile for a data set allows you to examine the middle half of the data centralized around the median – this is useful if a data set contains a lot of outliers or extreme values.
The lower quartile and upper quartile can also be used to calculate the interquartile range (IQR), which is a measure of the variability or spread of the data.
I Q R=U Q-L Q or I Q R=Q 3-Q 1
Box plot
The median and lower and upper quartiles, along with the minimum value and the maximum value of the data set, form a five-number summary of descriptive statistics for the data set.
This information can then be presented in a box plot (also known as a box and whisker plot or diagram), making it easy to compare with other sets of data.
Percentiles
Quartiles are one way of splitting data to analyze; you may see the word percentiles used when discussing data sets in different contexts, such as news reports or test scores.
For example, you might see something about ‘the top 10 \% of test scores’ – to calculate this, you would find the 90 th percentile using a similar method to that for quartiles.
There is a link between quartiles and percentiles, as follows:
- First/lower quartile (Q1) - 25 th percentile
- Second quartile/median (M or Q2) - 50 th percentile
- Third/upper quartile (Q3) - 75 th percentile
You will use percentiles as you progress through your statistics and probability units, along with standard deviation (a measure of dispersion or central tendency), determining outliers, using the normal distribution, including quantiles and deciles, and more exploratory data analysis techniques.
What is a quartile?
Common Core State Standards
How does this relate to 6 th grade math?
- Grade 6 – Statistics and Probability (6.SP.B.4)
Display numerical data in plots on a number line, including dot plots, histograms, and box plots.
How to find a quartile for a small data set
In order to find the quartiles for a small data set:
- Order the data and find the median \textbf{(Q2).}
- Count the number of data items in the set. Highlight the median and find the halfway point in the lower half of the data \textbf{(Q1).}
- Highlight the median and find the halfway point in the upper half of the data \textbf{(Q3).}
Quartile examples
Example 1: small discrete data set, odd number of data points
Find the lower and upper quartiles.

- Order the data and find the median \textbf{(Q2).}
The data is ordered, so you can go straight ahead and find the median. For a small data set, you can just cross numbers off from either end one by one until you reach the middle.
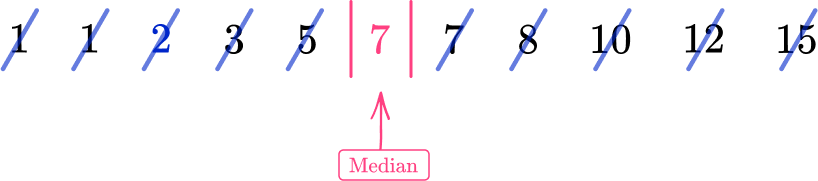
The median (Q2) is 7.
2Count the number of data items in the set. Highlight the median and find the halfway point in the lower half of the data \textbf{(Q1).}
There are 11 items of data. As there is an odd number of data items, you do not include the median when looking at the lower half of the data.
If you mark 7 (the median) using two vertical lines either side of the number, as if to fence off the value from further calculations, the lower half of the data is:

Repeating the process of crossing off to find the middle value for the lower half of the data, you have:
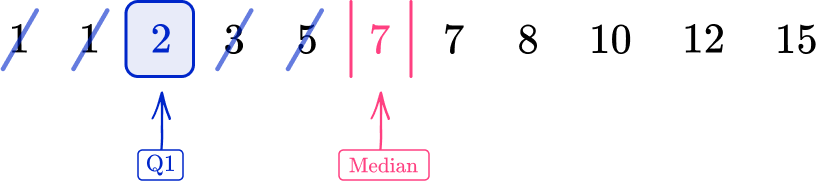
The lower quartile (Q1) is 2.
3Highlight the median and find the halfway point in the upper half of the data \textbf{(Q3).}
Excluding the median, the upper half of the data is:

Repeating the process of crossing off to find the middle value for the upper half of the data, you have:
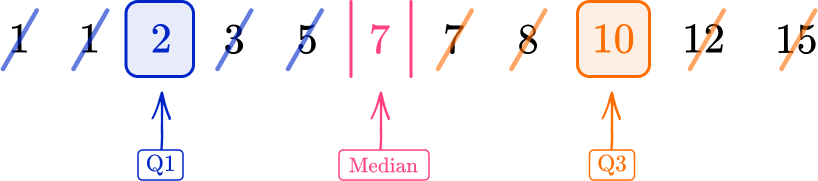
The upper quartile (Q3) is 10.
Example 2: small continuous data set, even number of data points
The data below shows birth weights of 10 babies in kilograms.
Find the lower and upper quartiles.
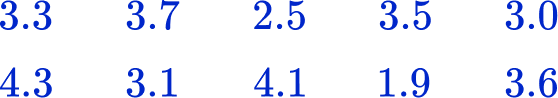
Ordering the data, you get:

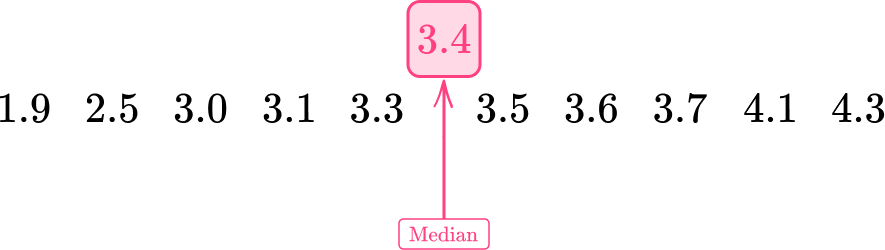
Now, find the median by crossing numbers off from either end one by one until you reach the middle.

There are two middle values, so you need to calculate the midpoint of these.
(3.3+3.5)\div{2}=3.4
The median (Q2) is 3.4{~kg}.
The median was 3.4. Marking this on our set of data, you still do not include this value when calculating the lower quartile, but you do find the middle of all of the values below the median.
You mark 3.4, which is the median. The lower half of the data is:

You do include the 3.3 value you used in the median calculation, as this wasn’t actually the median value.
Repeating the process of crossing off values to find the middle value for the lower half of the data, you have:
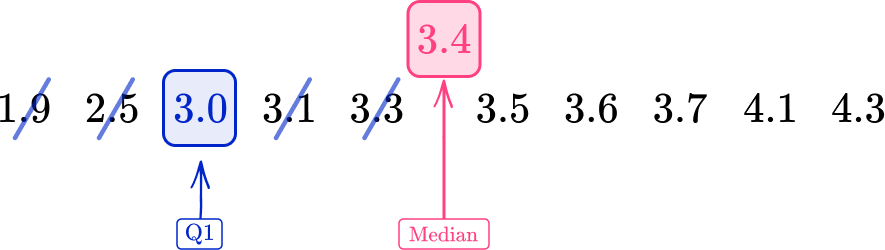
The lower quartile (Q1) is 3.0{~kg}.
Excluding the median, the upper half of the data is:

Again, note that you do include the data point 3.5.
Repeat the process of crossing off to find the middle value for the upper half of the data.
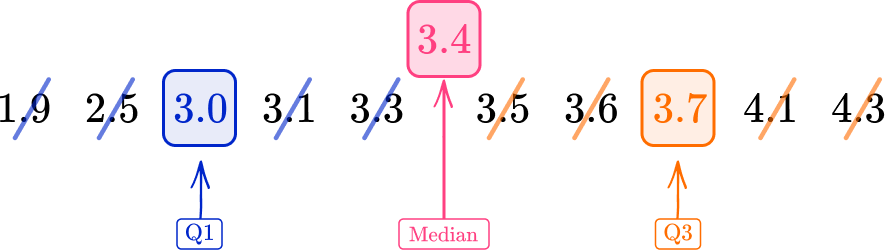
The upper quartile (Q3) is 3.7{~kg}.
Example 3: small discrete data set, using midpoints for quartiles
Find the lower and upper quartiles for the following data set.

Ordering this data set from smallest to largest, you have:

As this is a small data set, just cross numbers off from either end in turn until you reach the middle.

The median (Q2) is 14.
As there is an odd number of data values, you do not use the median value when finding the other two quartiles. You mark 14, which is the median and so the lower half of the data is:

Repeating the process of crossing off to find the middle value for the lower half of the data, you have:
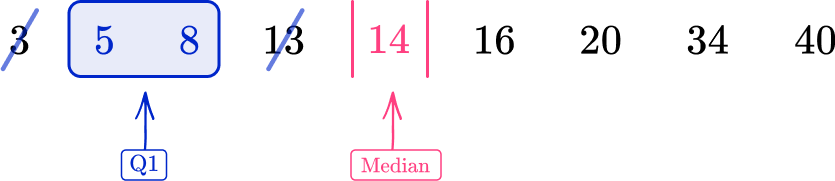
As there are two data points, 5 and 8, you need to calculate the midpoint of these two values.
\cfrac{5+8}{2}=\cfrac{13}{2}=6.5
The lower quartile (Q1) is therefore 6.5.
The values in the upper half of the data are:

Again, note that you don’t include the median data point in the upper half.
Repeat the process of crossing off to find the middle value for the upper half of the data.
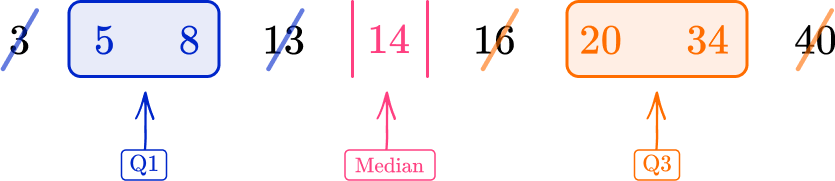
Again, there are two data points, 20 and 34, in the middle of the data, so you find the midpoint of these, which is 27.
If you weren’t sure on the midpoint, you could do the calculation:
\cfrac{20+34}{2}=\cfrac{54}{2}=27
The upper quartile (Q3) is 27.
Working with a large data set
For a large data set, crossing numbers off a list can be time-consuming and a bit confusing, particularly if the data spans over two or more lines when listed. You can use an alternative method to find the lower and upper quartiles.
For a data set containing n values:
- The lower quartile, Q1, is located at the position \cfrac{n+1}{4}.
- The median, M or Q2, is located at the position \cfrac{n+1}{2}.
- The upper quartile, Q3, is located at the position 3\times\cfrac{n+1}{4}.
Note that you are finding out the position of the lower or upper quartile. You still need to count through the data set to find which values these are.
In situations where data is grouped, this method can also be used to find the class intervals in which the lower and upper quartiles lie. This is particularly true when estimating the quartiles in a histogram.
Note: The quartile function in Google Sheets or Microsoft Excel can help determine quartiles for very large sets of data.
How to find quartiles for a large data set
In order to find the lower quartile and upper quartile for a large data set:
- Order the data and find the value of \textbf{n} (the number of data points).
- Use the formula \bf{\cfrac{\textbf{n}+1}{4}} to calculate the position of \textbf{Q1} and state/calculate the data value at this position.
- Use the formula \bf{3\times\cfrac{\textbf{n}+1}{4}} to calculate the position of \textbf{Q3} and state/calculate the data value at this position.
Quartile for a large data set examples
Example 4: large data set
A set of data has been arranged into a stem and leaf plot. Calculate the value of each quartile for the following data.
The data is already ordered. There are 24 data points, so n=24.
Using the formula \cfrac{n+1}{4} with n=24, you have
\cfrac{24+1}{4}=\cfrac{25}{4}=6.25
So the lower quartile lies between the 6 th and 7 th data point.
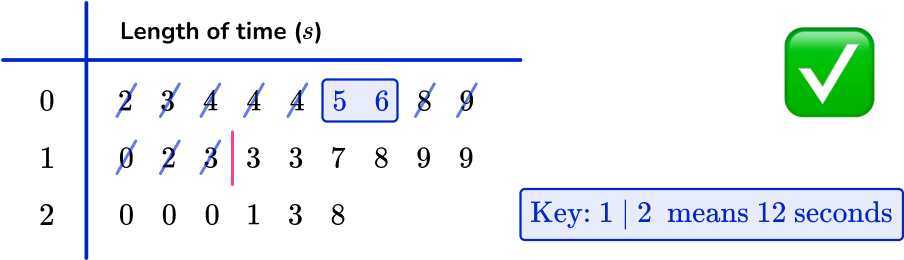
The values are 5 and 6, and the midpoint of these is 5.5, so the lower quartile is 5.5.
You use the formula 3\times\cfrac{n+1}{4} with n=24 to give
3 \times \cfrac{24+1}{4}=3 \times \cfrac{25}{4}=3 \times 6.25=18.75
Note that if you’ve already found that the lower quartile is the 6.25 th value, you can simply multiply 6.25 by 3 to get 18.75.
So the upper quartile lies between the 18 th and 19 th data points, and you use the midpoint of these values.
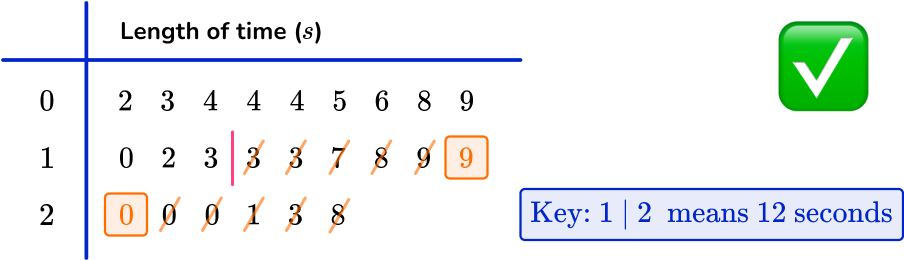
The values are 19 and 20, and the midpoint of these is 19.5, so the upper quartile is 19.5.
Example 5: grouped data
The heights (h) of 40 students are given in the table below. In which class intervals do the lower and upper quartiles lie?
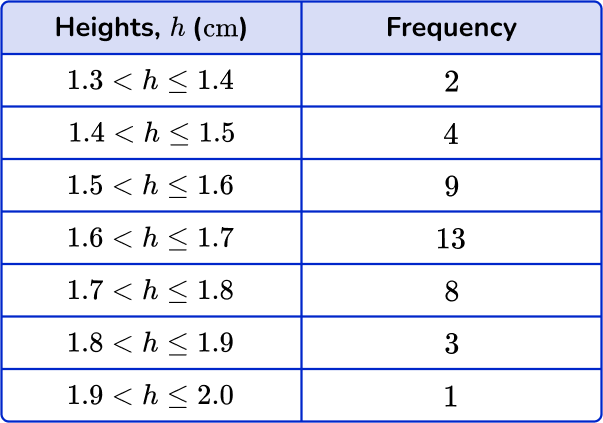
You don’t need to order the data. There are 40 data points, so n=40.
Note, this is given information in the actual question.
Using the formula \cfrac{n+1}{4} with n=40, you have
\cfrac{40+1}{4}=\cfrac{41}{4}=10.25
So the lower quartile value lies between the 10 th and 11 th data points.
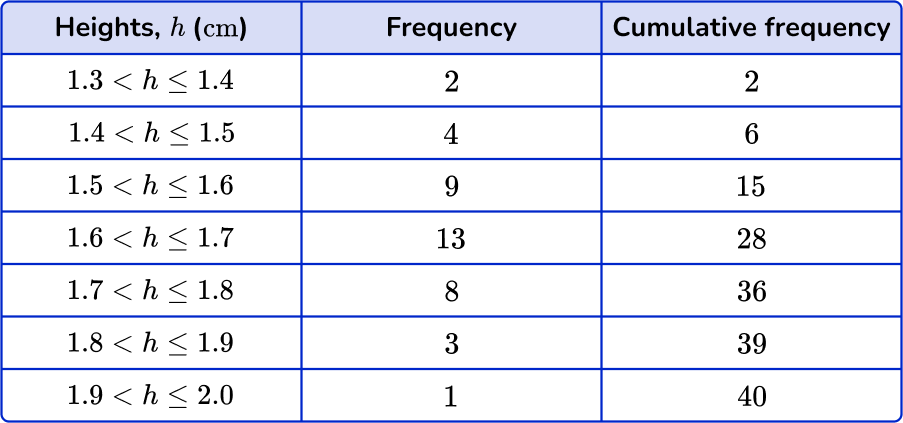
The 10 th and the 11 th values both lie in the class interval 1.5 < h \leq {1.6} because, by using the cumulative frequency, you can see that 15 items of data have a height h\leq{1.6}\text{m}.
The lower quartile lies in the group 1.5<h\leq{1.6}.
Using the formula 3\times\cfrac{n+1}{4} with n=40, you have
3 \times \cfrac{40+1}{4}=3 \times \cfrac{41}{4}=3 \times 10.25=30.75
So the upper quartile value lies between the 30 th and 31 st data points.
The 30 th and the 31 st values both lie in the class interval 1.7 < h \leq {1.8} because, by using the cumulative frequency, you can see that 28 items of data have a height h\leq{1.7}\text{m}.
The upper quartile lies in the group 1.7<h\leq{1.8}.
Example 6: quartiles from a cumulative frequency diagram
The cumulative frequency diagram below shows the distribution of building heights in a city, in meters.
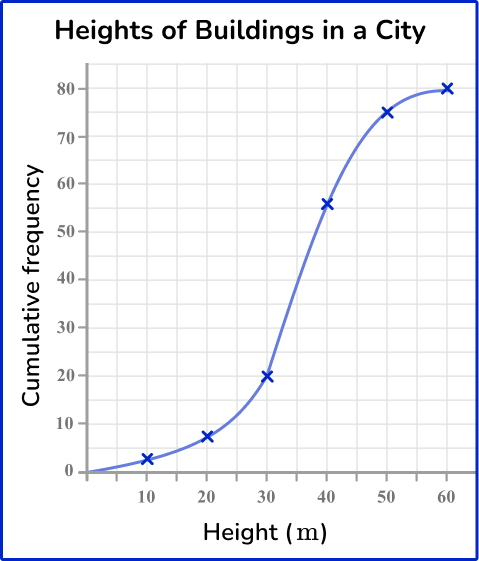
Use the diagram to calculate the values for Q1 and Q3 for this set of data.
The data within a cumulative frequency diagram is already ordered from smallest to largest. The value n is the highest value for the cumulative frequency on the graph. Here, n=80.
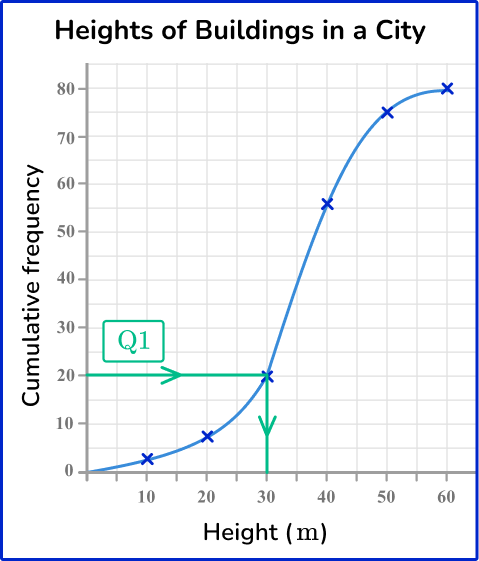
Using \cfrac{n+1}{4} with n=80, the position of Q1 is
\cfrac{80+1}{4}=\cfrac{81}{4}=20.25
This is the value on the cumulative frequency axis. Drawing a horizontal line to the curve, and then down to the x -axis, you can see that the value for the lower quartile is approximately 30{~m} (see diagram below).
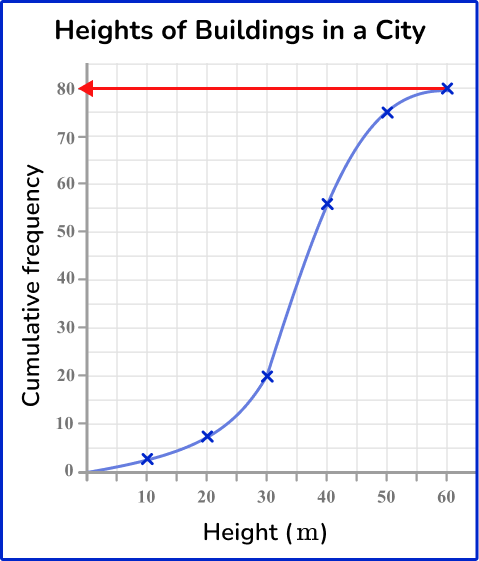
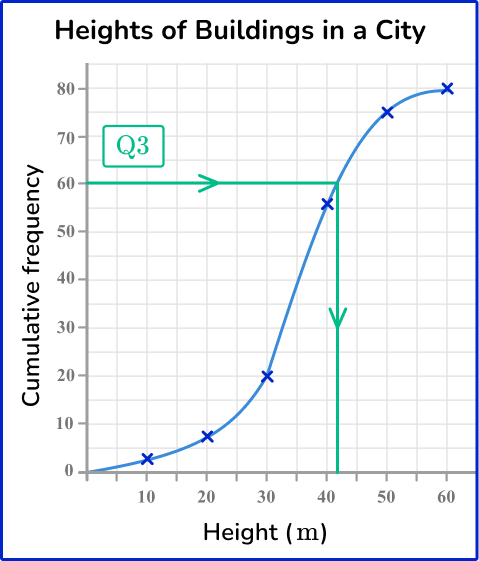
The upper quartile is located at 3\times\cfrac{n+1}{4}. When n=20
Q_{1}=3\times\cfrac{20+1}{4}=3\times\cfrac{21}{4}=3\times{20.25}=60.75
Drawing a horizontal line from the cumulative frequency axis at the value 60.25, across to the curve and then down to the x -axis, the upper quartile is approximately 42{~m} (see diagram below).
Teaching tips for quartile
- Use visual aids such as number lines, bar graphs, or dot plots to illustrate quartiles. Show students how to locate Q1, Q2, and Q3 for any given set of values. Encourage them to interpret and analyze the data based on the quartiles.
- Make the concept relatable by using real-life examples that students can connect with. For instance, use numeric values related to their favorite sports, hobbies, or interests. This helps students see the relevance of quartiles in analyzing and understanding data.
- Provide ample opportunities for students to practice finding quartiles using different data sets. Offer exercises with varying levels of difficulty to challenge and reinforce their understanding.
- Utilize interactive tools or online resources that allow for manipulating, exploring, and even calculating quartiles to manipulate and explore quartiles. For example, use virtual manipulatives or educational websites that provide interactive activities related to quartiles.
Easy mistakes to make
- Forgetting to order the data set before finding the median or quartiles
The list must be in order before you start finding the key values!
- Stating the quartile value as the number given by the formula, rather than counting and finding that value in the data
For example, for the data set 3, \, 4, \, 6, \, 7, \, 10, the formula for the lower quartile gives \cfrac{5+1}{4}=\cfrac{6}{4}=1.5. This tells you which data values to select (in this case, the midpoint of the 1 st and 2 nd values); do not just write Q1=1.5.
Related representing data lessons
Practice quartile questions
1) Find the values of the lower and upper quartiles for the following 11 items of data.


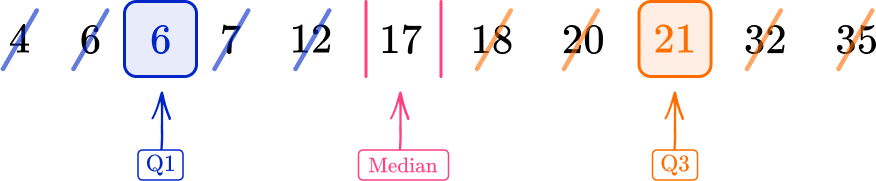
The median is 17, so mark this, then find the median of the lower half of the data (4, \, 6, \, 6, \, 7, \, 12) and the median of the upper half of the data (18, \, 20, \, 21, \, 32,3 \, 5).
Q1 is 6 and Q2 is 21.
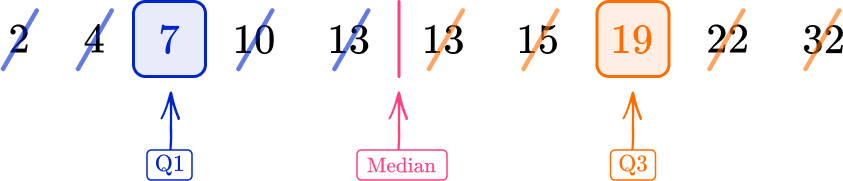
2) Find the lower and upper quartiles.
![]()
The median is the middle number in an ordered list. The list is already ordered, but there are two values in the middle of the data.
As they are both 13, the median is 13.
The middle of the lower half of the data (2, \, 4, \, 7, \, 10, \, 13) is 7 so the lower quartile is 7.
The middle of the upper half of the data (13, \, 15, \, 19, \, 22, \, 32) is 19 so the upper quartile is 19.
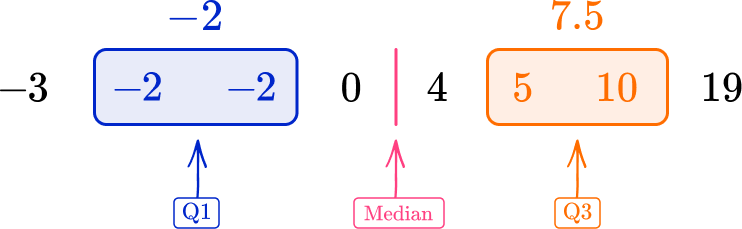
3) Find the lower and upper quartiles for the following set of data.
![]()
Ordering the data first, you have
![]()
The median is the midpoint of 0 and 4; mark this, then find the median of the lower half of the data (-3, \, -2, \, -2, \, 0) and the median of the upper half of the data (4, \, 5, \, 10, \, 19).
There are an even number of data points, so use the midpoint of the 2 nd and 3 rd for Q1 and the midpoint of the 6 th and 7 th for Q3.
4) This table shows the shoe sizes of 15 girls. Find the lower and upper quartiles.
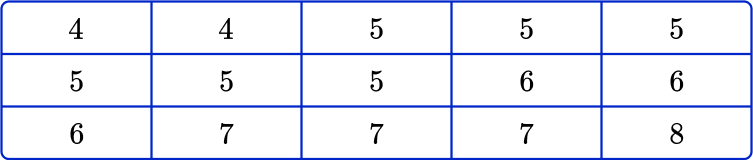
Use the formula to find out which values to pick for the lower quartile and the upper quartile. There are 15 pieces of data, so n=15.
Q1=\cfrac{15+1}{4}=4 so the lower quartile is the 4 th data point, which is 5.
Q3=3\times\cfrac{15+1}{4}=12 so the upper quartile is the 12 th data point, which is 7.
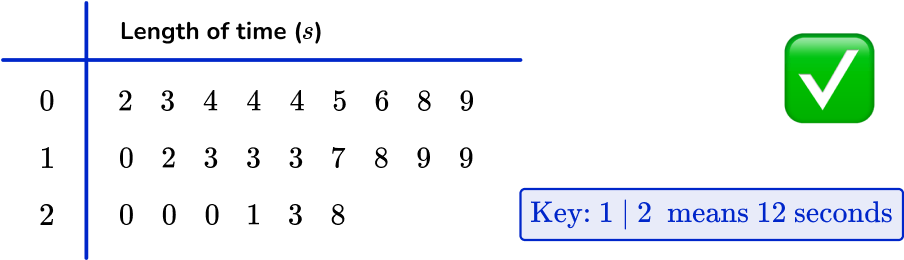
5) Raheem writes down how long his bus journey to school takes on 20 different days. The times are given to the nearest minute. Find the lower and upper quartiles for his data set.

Use the formula to find out which values to pick for the lower quartile and the upper quartile. There are 20 data points, so n=20.
Q1=\cfrac{20+1}{4}=5.25 so by finding the midpoint of the 5 th and 6 th data points, which are both 11 (remember to use the key), the lower quartile is 11.
Q3=3\times\cfrac{15+1}{4}=15.75 so the midpoint of the 15 th and 16 th data points, which are both 18 (using the key), gives us the upper quartile of 18.
6) The weights (w) of 30 teenagers are given in the table below. Which class interval contains the upper quartile?
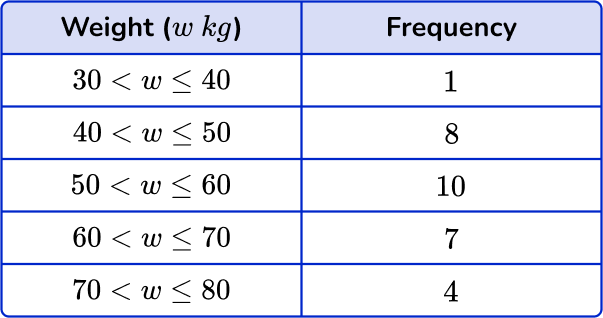
Using the formula 3\times\cfrac{n+1}{4} to determine the upper quartile with n=1+8+10+7+4=30, you have
Q3=3\times\cfrac{30+1}{4}=3\times\cfrac{31}{4}=23.25
So the upper quartile is between the 23 rd and 24 th data points.
Counting the cumulative frequency for the data set, you have
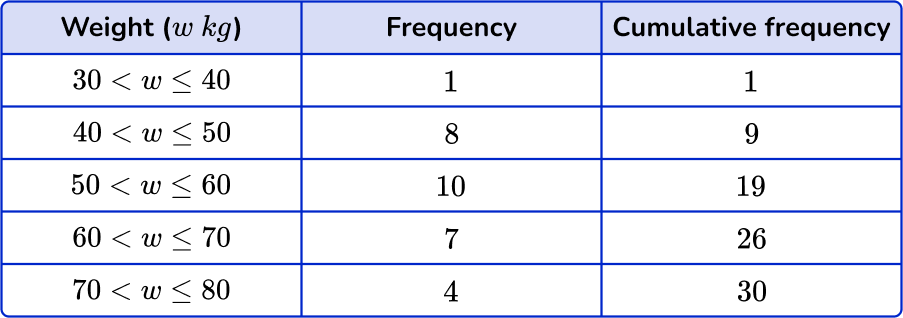
The 23 rd and 24 th data points both lie in the class interval 60<w\leq{70}.
Quartile FAQs
A quartile is a type of quantile that divides an ordered data set into four equal parts (quarters).
To find each quartile of a data set, first sort the data set in ascending order from smallest to largest and find the median (Q2). Find the lower quartile (Q1) by locating the median (central value) of the lower half of the data set, and find the upper quartile (Q3) by locating the median (central value) of the upper half of the data set.
The next lessons are
- Frequency table
- Frequency graph
- Sampling methods
- Percent
Still stuck?
At Third Space Learning, we specialize in helping teachers and school leaders to provide personalized math support for more of their students through high-quality, online one-on-one math tutoring delivered by subject experts.
Each week, our tutors support thousands of students who are at risk of not meeting their grade-level expectations, and help accelerate their progress and boost their confidence.

Find out how we can help your students achieve success with our math tutoring programs.
[FREE] Common Core Practice Tests (3rd to 8th Grade)
Prepare for math tests in your state with these 3rd Grade to 8th Grade practice assessments for Common Core and state equivalents.
Get your 6 multiple choice practice tests with detailed answers to support test prep, created by US math teachers for US math teachers!