GCSE Tutoring Programme
Our chosen students improved 1.19 of a grade on average - 0.45 more than those who didn't have the tutoring.
In order to access this I need to be confident with:
Types of data Grouped frequency tables Averages from frequency tablesThis topic is relevant for:

Frequency Density
Here we will learn about frequency density, including how to calculate it from a grouped frequency table.
You can also download the following free frequency density resources all suitable for those following Edexcel, AQA or OCR exam boards:
What is frequency density?
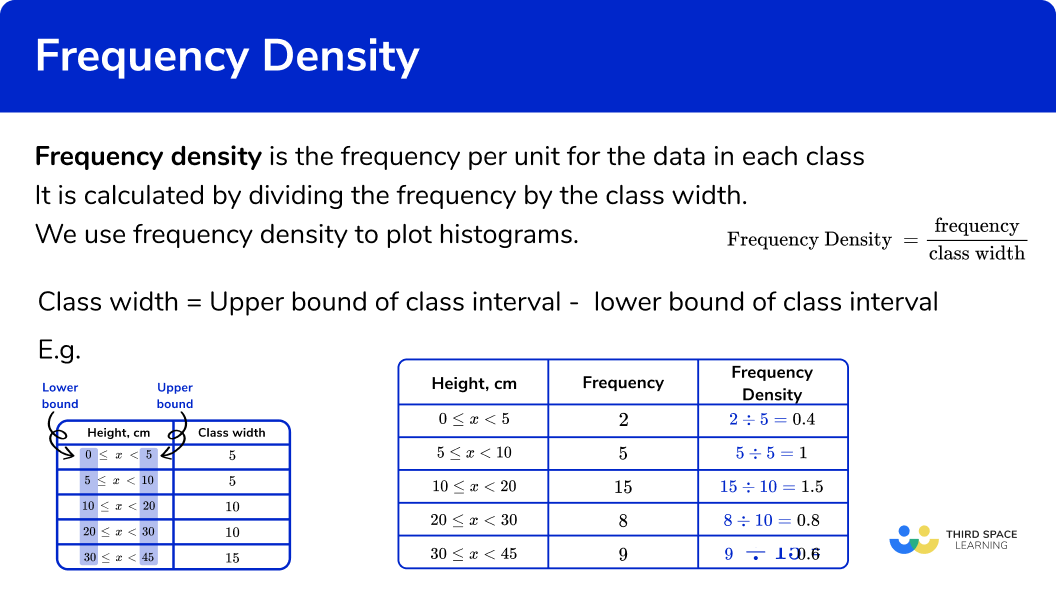
Frequency density is the frequency per unit for the data in each class. It is calculated by dividing the frequency by the class width ie the difference between the upper limit of the class interval and the lower limit of the class interval.
We use frequency density to plot histograms.
\text{Frequency density }=\frac{\text{Frequency}}{\text{Class width}}
Step-by-step guide: Frequency density formula (coming soon)
To work out frequency density we first need to identify the class width of the interval by subtracting the lower bound from the upper bound of the class interval.

Once we have identified the class width the frequency density can be calculated:

In a histogram:
- the frequency density is the height of the bar
- the frequency of a class interval is equal to the area of the bar
- the total area of the bars is equal to the total frequency
What is frequency density?
How to calculate frequency density
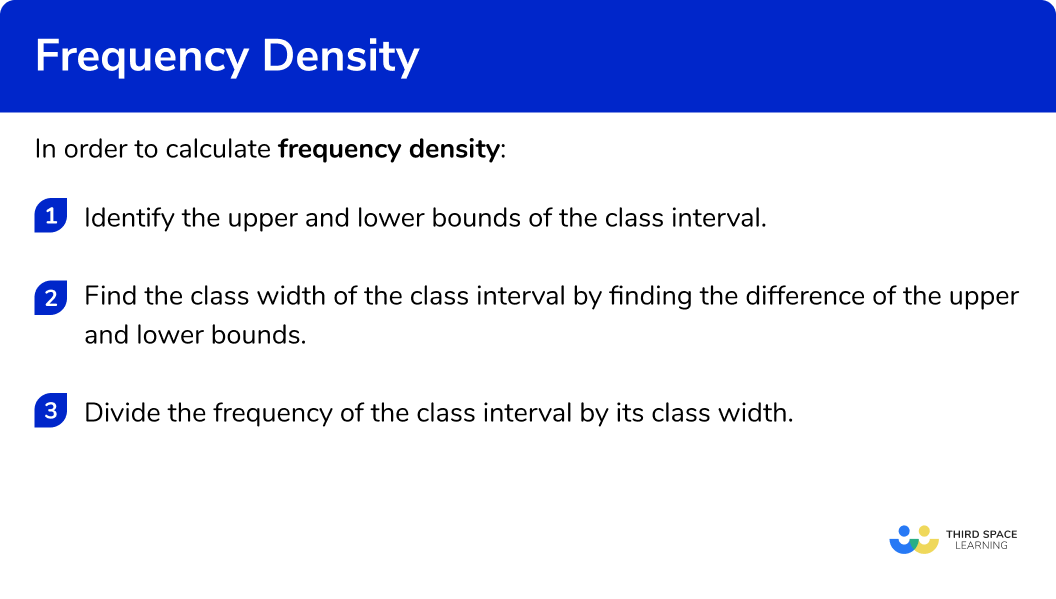
In order to calculate frequency density:
- Identify the upper and lower bounds of the class interval.
- Find the class width of the class interval by finding the difference of the upper and lower bounds.
- Divide the frequency of the class interval by its class width.
How to calculate frequency density
Histograms worksheet
Get your free histograms worksheet of 20+ questions and answers including frequency density and frequency density formula questions. With reasoning and applied questions.
DOWNLOAD FREE Histograms worksheet
Get your free histograms worksheet of 20+ questions and answers including frequency density and frequency density formula questions. With reasoning and applied questions.
DOWNLOAD FREERelated lessons on histograms
Frequency density is part of our series of lessons to support revision on histograms. You may find it helpful to start with the main histograms lesson for a summary of what to expect, or use the step by step guides below for further detail on individual topics. Other lessons in this series include:
Frequency density examples
Example 1: calculating frequency density
The table shows information about the ages of people at a cinema.

Calculate the frequency densities.
- Identify the upper and lower bounds of the class interval.

2Find the class width of the class interval by finding the difference of the upper and lower bounds.

3Divide the frequency of the class interval by its class width.

Example 2: calculating frequency density
The table shows information about the heights of pupils in a mathematics class.

Calculate the frequency densities.


Example 3: calculating frequency density
The table shows information about the mass of fish in a lake.

Calculate the frequency densities.


Example 4: finding frequencies from the frequency density
The table shows information about the heights of plants in a garden.

Calculate the missing frequencies and frequency densities.


Here we have some missing frequencies as well as missing frequency densities.
We can calculate the frequency densities for the final two class intervals in the usual way.
To calculate the missing frequencies we need to work backwards.
\text{Frequency density} = \frac{\text{Frequency}}{\text{Class width}}
therefore
\text{Frequency} = \text{Frequency density} \times \text{Class width}
Multiply the frequency density by the class width to find the frequency.

Example 5: finding the frequencies from the frequency density
This table shows information about the ages of people playing bingo.

Calculate the missing frequencies and frequency densities.


\text{Frequency density} = \frac{\text{Frequency}}{\text{Class width}}
therefore
\text{Frequency} = \text{Frequency density} \times \text{Class width}

Example 6: finding the frequencies from the frequency density
This table shows how far some children travel to school.

Work out the missing frequencies and frequency densities.


\text{Frequency density} = \frac{\text{Frequency}}{\text{Class width}}
therefore
\text{Frequency} = \text{Frequency density} \times \text{Class width}

Common misconceptions
- Midpoint of the group
A common error is to use the midpoint when calculating frequency densities rather than the class width. This is because the midpoint is used for estimating the mean from a frequency table and frequency polygons.
Frequency density is the frequency per unit for the data in each class so it is important to use the width of the class in the calculation.
Practice frequency density questions
1. To calculate the frequency density we use the formula


Frequency density is the frequency per unit for the data in each class.
2. A class interval was given as 25 \leq x < 30. How would you calculate the class width?
Class width = upper bound – lower bound
3. A class interval given as 15 \leq x < 20. has a frequency density of 1.6. What is its frequency?
We need to multiply the frequency density by the class width.
1.6 \times 5=8
4. The table shows information about the heights of a group of children.

Which table shows the correct frequency densities?


5. The table shows the frequency densities for the mass of some stones in a garden.

Which table shows the correct frequencies?


We need to multiply the frequency density by the class width.
6. This table shows information about the heights of trees in a wood.

Which table shows the correct missing values?


To find the missing frequencies, we need to multiply frequency density by class width.
To find the missing frequency densities we need to divide the frequency by the class width.
Frequency density GCSE questions
1. The table shows information about the heights of sunflowers in an allotment.

Complete the frequency density column.
(3 marks)

Attempt to divide frequency by class width
(1)
Three correct
(1)
All correct
(1)
2. The table shows the frequency densities for the mass of sheep in a field.

Complete the frequency column.
(3 marks)

Attempt to multiply frequency density by class width
(1)
Three correct
(1)
All correct
(1)
3. The table shows information about the ages of guests at a hotel.

Complete the missing values.
(4 marks)

Attempt to multiply frequency density by class width
(1)
Attempt to divide frequency by class width
(1)
Three correct
(1)
All correct
(1)
Learning checklist
You have now learned how to:
The next lessons are
Still stuck?
Prepare your KS4 students for maths GCSEs success with Third Space Learning. Weekly online one to one GCSE maths revision lessons delivered by expert maths tutors.

Find out more about our GCSE maths tuition programme.