FREE DOWNLOAD
Histograms Worksheet
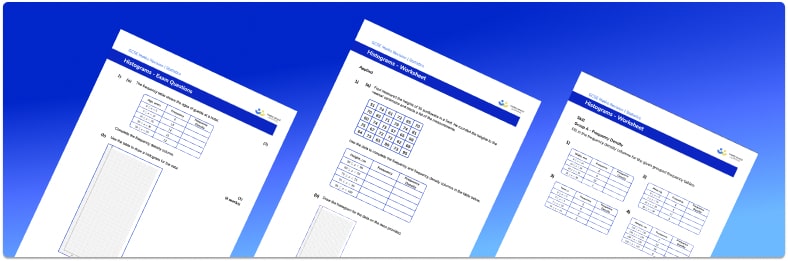
Help your students prepare for their Maths GCSE with this free histograms worksheet of 20 questions and answers
- Section 1 of the histograms worksheet contains 12 skills-based histograms questions, in 3 groups to support differentiation
- Section 2 contains 4 applied histograms questions with a mix of worded problems and deeper problem solving questions
- Section 3 contains 4 foundation and higher level GCSE exam style questions
- Answers and a mark scheme for all histograms questions are provided
- Questions follow variation theory with plenty of opportunities for students to work independently at their own level
- All maths resources created by fully qualified expert secondary maths teachers
- Suitable for GCSE and Key Stage 4 maths revision for AQA, OCR and Edexcel exam boards
Raise maths attainment across your school with hundreds of flexible and easy to use GCSE maths worksheets and lessons designed by teachers for teachers.
Histograms at a glance
A histogram is a frequency diagram used to display the frequency distribution of a grouped data set, often with unequal class widths. Histograms are primarily used to display continuous data and look very similar to bar charts, with a couple of key differences. Unlike on a bar graph, the bars on a histogram do not have gaps between them and the area of each bar is proportional to frequency. Frequency density is plotted on the y-axis.
When drawing histograms we first calculate the frequency density for each class interval by dividing frequency by class width. Then we need to draw a bar to represent each class interval, marking the height of the bar at the calculated frequency density.
Note that frequency densities can often have fraction or decimal values, so students must take care when selecting an appropriate scale for the frequency density axis.
Looking forward, students can then progress to additional Statistics worksheets, for example a pie chart worksheet, averages worksheet or line graphs worksheet.
For more teaching and learning support on Statistics our GCSE maths lessons provide step by step support for all GCSE maths concepts.
Do you have students who need additional support?
With Third Space Learning's secondary maths tutoring programmes, students in Year 7-11 receive regular one to one maths tutoring to address gaps, build confidence and boost progress.
"My confidence in the tutoring is high. We've had some phenomenal results. I even had one girl get a Grade 8 this year; she came to every tutoring session."
Stacey Atkins, Maths Director, Outwood Grange Academies Trust