GCSE Tutoring Programme
Our chosen students improved 1.19 of a grade on average - 0.45 more than those who didn't have the tutoring.
In order to access this I need to be confident with:
Collecting data Frequency tables Arithmetic Adding and subtracting decimals Adding and subtracting fractions How to calculate probabilityThis topic is relevant for:

Two Way Tables
Here we will learn about two way tables, including what a two way table is, how to construct them, interpret them, and how to calculate the probability of an event using a two way table.
You can also download the following free two way tables resources all suitable for those following Edexcel, AQA or OCR exam boards:
What are two way tables?
Two way tables are a type of frequency table used for organising data. They are also known as contingency tables.
Two way tables are mostly used for categorical data, though they can be used for numerical data too. Categorical data is data where the items are words rather than numbers.
For example, colours, sports, and car manufacturers.
To construct a two way table, we need two categorical variables. One variable is featured as the top row within the two way table, and the other variable features on the first column of the table.
For example,
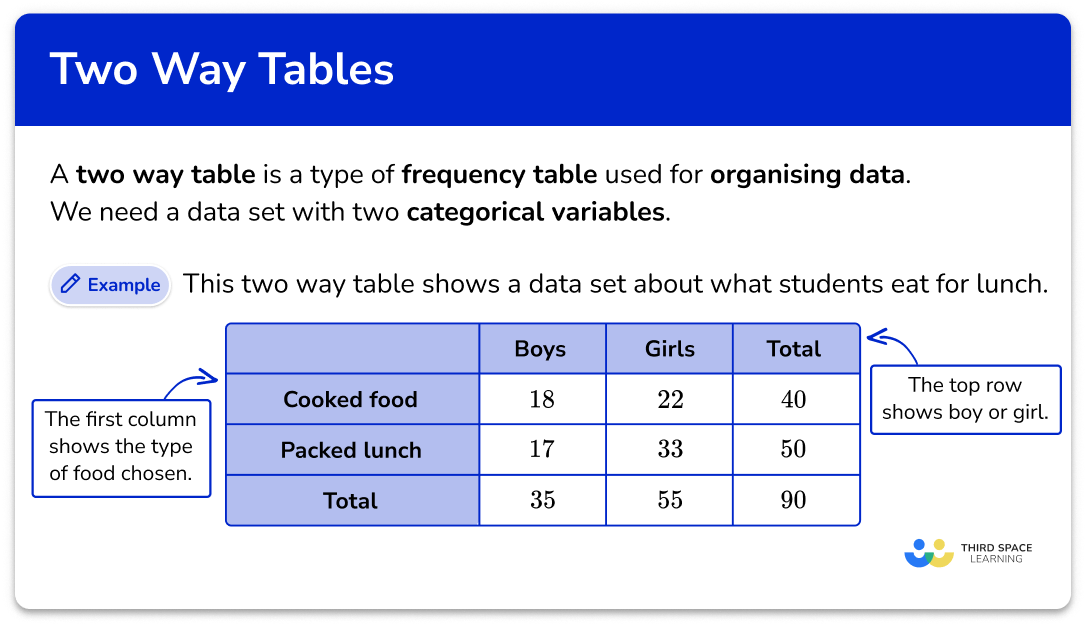
This two way table shows a data set about what students eat for lunch. One categorical variable is the gender of the child, the other categorical variable is what type of lunch they have.
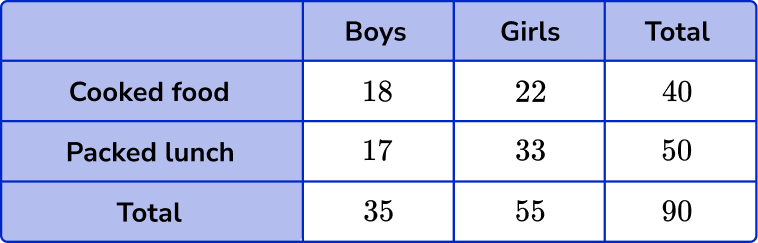
There are row and column totals. So we can see that there are 35 boys and that 50 students have packed lunch. The total number of students in the table is 90.
What are two way tables?
How to construct two way tables
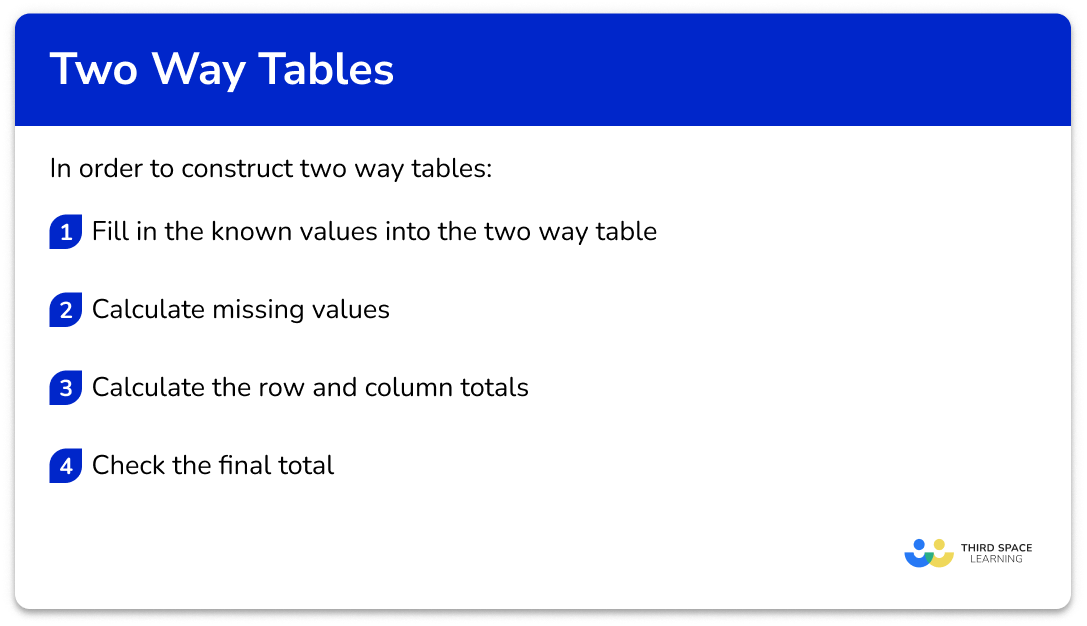
In order to construct two way tables:
- Fill in the known values into the two way table.
- Calculate missing values.
- Calculate the row and column totals.
- Check the final total.
Explain how to construct two way tables
Two way tables worksheet
Get your free two way tables worksheet of 20+ questions and answers. Includes reasoning and applied questions.
DOWNLOAD FREE Two way tables worksheet
Get your free two way tables worksheet of 20+ questions and answers. Includes reasoning and applied questions.
DOWNLOAD FREERelated lessons on representing data
Two way tables is part of our series of lessons to support revision on representing data. You may find it helpful to start with the main representing data lesson for a summary of what to expect, or use the step by step guides below for further detail on individual topics. Other lessons in this series include:
Two way tables examples
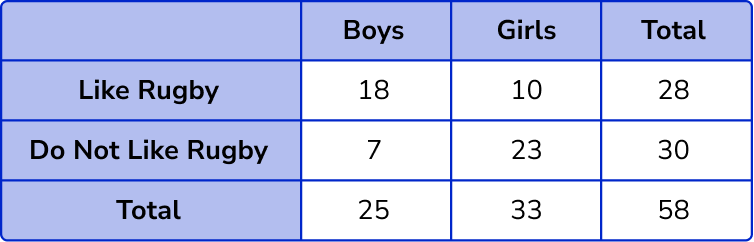
Example 1: missing row and column totals
Complete this two way table,
- Fill in the known values into the two way table.
Here, we know each of the individual values for each category so we can move on to Step 2.
2Calculate missing values.
Here, we do not have any missing values and so we can move on to Step 3.
3Calculate the row and column totals.
The total number of boys = 18 + 7 = 25 .
The total number of girls = 10 + 23 = 33 .
The total number of students who like rugby = 18 + 10 = 28 .
The total number of students who do not like rugby = 7 + 23 = 30 .
Filling in these values into the table, we have
4Check the final total.
The total number of boys and girls = 25 + 33 = 58 .
The total number of students who do (not) like rugby = 28 + 30 = 58 .
Filling in the grand total of 58 , we have the final solution.
Example 2: three categories with missing totals
Complete this two way table,

Here, we know each of the individual values for each category so we can move on to Step 2.
Here, we do not have any missing values and so we can move on to Step 3.
The total number of males = 5 + 12 + 3 = 20 .
The total number of females = 14 + 3 + 7 = 24 .
The total number of people who drink tea = 5 + 14 = 19 .
The total number of people who drink coffee = 12 + 3 = 15 .
The total number of people who drink juice = 3 + 7 = 10 .
Filling in these values into the table, we have
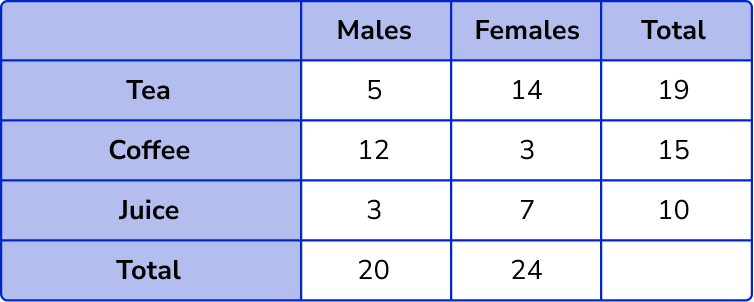
The total number of males and females = 20 + 24 = 44 .
The total number of people who drink tea, coffee, and juice = 19 + 15 + 10 = 44 .
Filling in the grand total of 44 , we have the final solution.

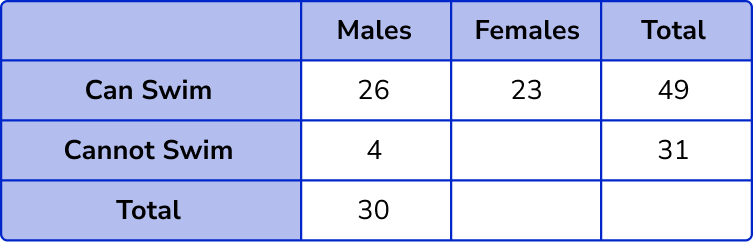
Example 3: missing values throughout the table
Complete this two way table,

Here, we know some of the individual values for each category so we can move on to Step 2.
We have quite a few missing values in the two way table, so we need to find these values. We need to look for a row or column where we know all but one of the missing values.
Here, we know the number of females who can swim, and the total number of people who can swim. This means we can calculate the number of males by subtracting the number of females from the row total, 49-23 = 26.

Now we can calculate the number of males that cannot swim as we know the number of males that can swim, and the total number of males, 30-26 = 4 .
Now we can calculate the number of females who cannot swim, 31-4 = 27 .
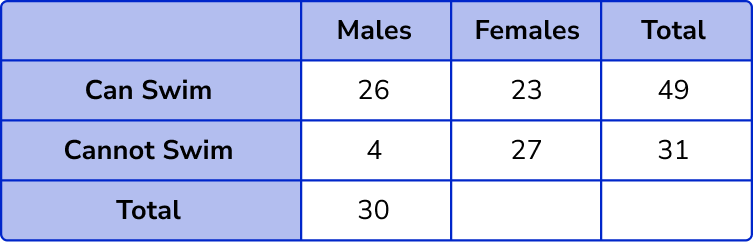
The total number of females = 23 + 27 = 50 .
Filling in this value, we have
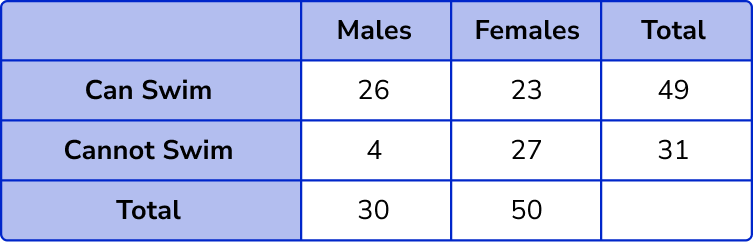
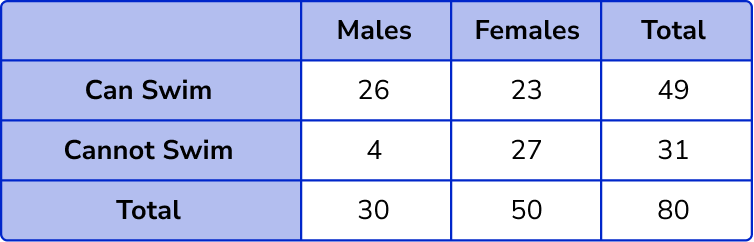
The total number of males and females = 30 + 50 = 80 .
The total number of people can (not) swim = 49 + 31 = 80 .
Filling in the grand total of 80 , we have the final solution.
Example 4: constructing a two way table from a worded problem
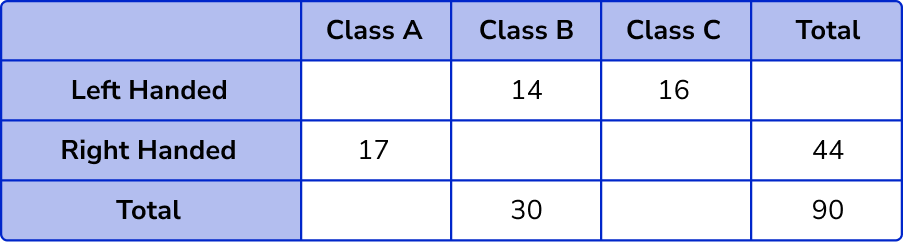
A school is researching the handedness of 90 students in Year 3. 17 students in Class A are right-handed. 14 students in Class B are left-handed. 16 students in Class C are left-handed. There are 44 students who are right-handed, and 30 students in Class B. Construct a two way table to represent this data.
Here, we know that we have 3 classes (A, B, C) and we are comparing left and right handedness. Drawing the two way table, we have
Completing the information given from the question, fill in the known values into the correct section in the table.
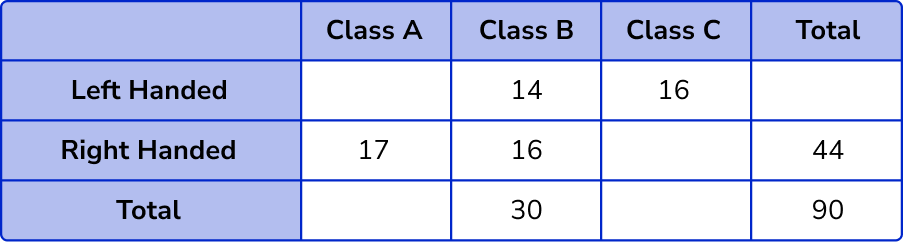
We have quite a few missing values in the two way table, so we need to find these values. We need to look for a row or column where we know all but one of the missing values.
Here, we know that out of the 30 students in Class B, 14 are left-handed, and so we can find the number of right-handed students in Class B, 30-14 = 16 .
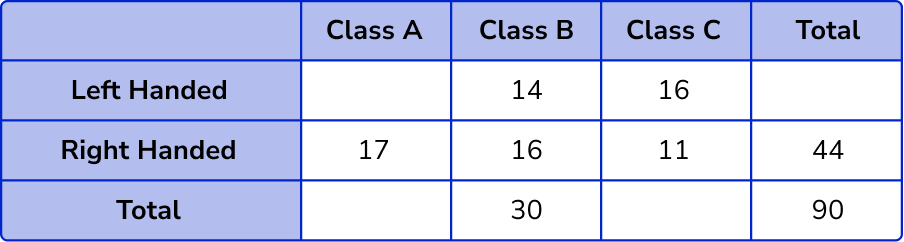
We now know all but one value in the right-handed row, 44-(17 + 16) = 11 .
For the number of left-handed students in Class A, we need to know the row total, 90-44 = 46 .
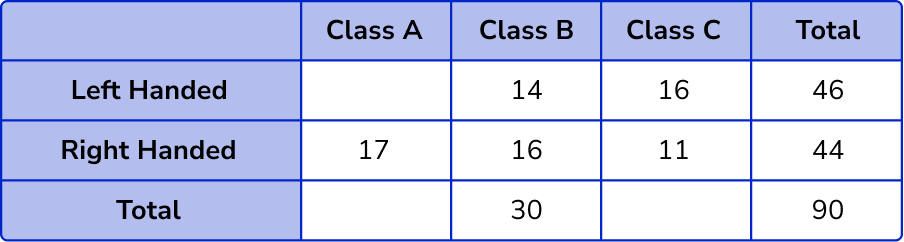
The number of left-handed students in Class A = 46-(14 + 16) = 16 .
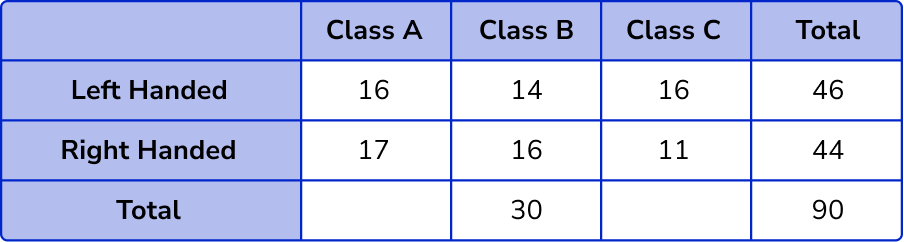
The total number of students in Class A = 16 + 17 = 33 .
The total number of students in Class C = 16 + 7 = 23 .
Filling in these values, we have
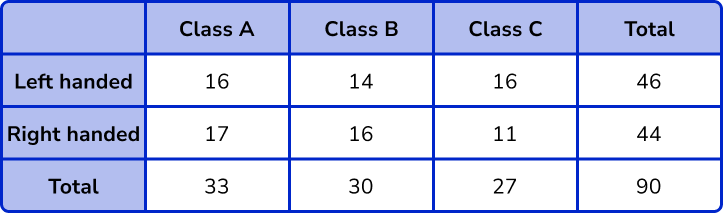
The total number of students in the three classes = 27 + 30 + 23 = 90 .
The total number of left-/right-handed people = 46 + 44 = 90 .
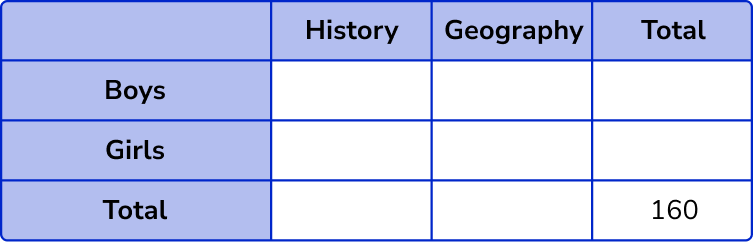
Example 5: using a two way table to work out a probability
160 students chose to study History or Geography.
86 of the students chose History.
34 of the boys chose Geography.
41 of the girls chose History.
A student is chosen at random. By constructing a two way table, work out the probability that the student is a boy who studies history.
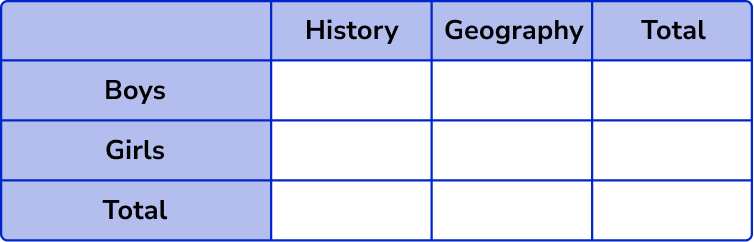
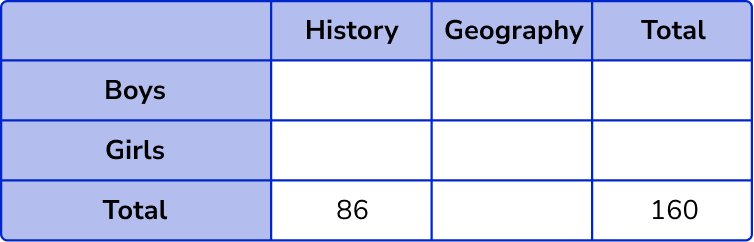
As 160 students chose to study History or Geography, this is our overall total.
86 students chose History.
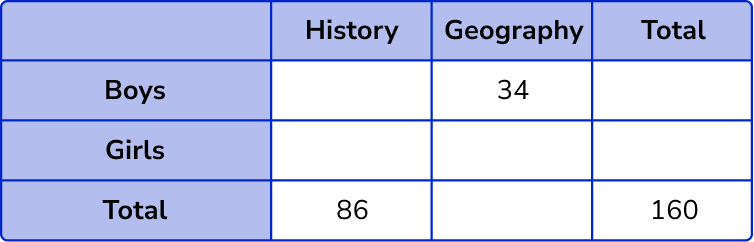
34 boys chose Geography.
41 girls chose History.
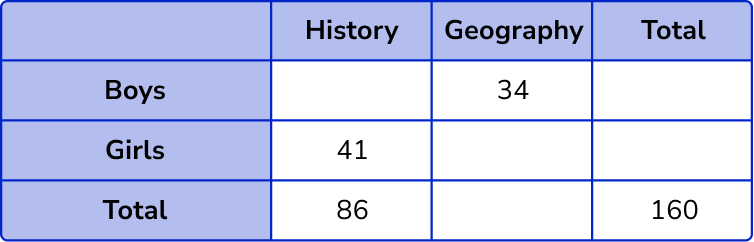
This completes the table with all the information we know so far.
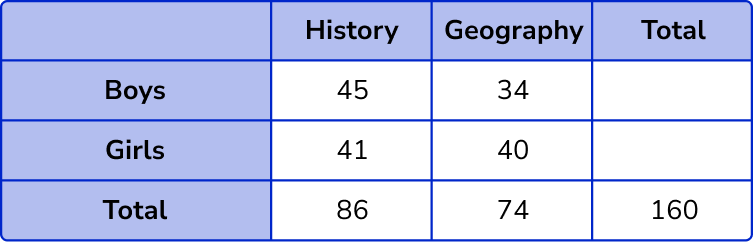
Inspecting the table, we need to find the row or column where we only have one unknown value. This is the column for History, where we need to calculate the number of boys who chose History, 86-41 = 45 .

To calculate the number of girls who chose Geography, we need to know the total number of girls, 160-86 = 74 .
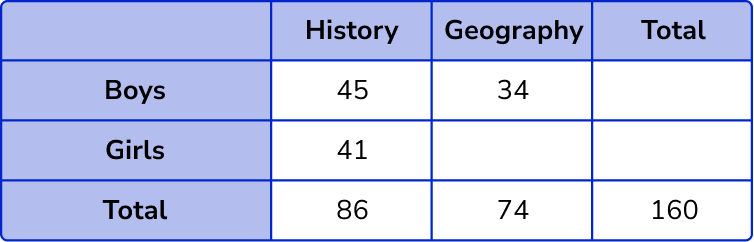
The number of girls who chose Geography is therefore 74-34 = 40 .
The total number of boys = 45 + 34 = 79 .
The total number of girls = 41 + 40 = 81 .
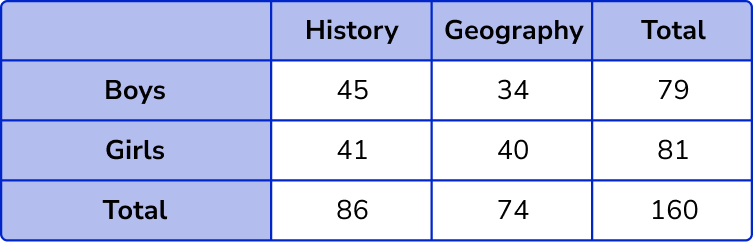
The total number of boys and girls = 79 + 81 = 160 .
The total number of students who chose History or Geography = 86 + 74 = 160 .
Now that we have the two way table, we need to use this to calculate the probability of selecting a student who is a boy who studies History.
Looking at the two way table, there are 45 boys who study History out of a total of 160 students, so P(\text{boy who studies History}) = \frac{45}{160}.
Note: Unless the question states, leave the answer to a probability as a fraction without simplifying it – it may be useful for the next question.
Example 6: conditional probability
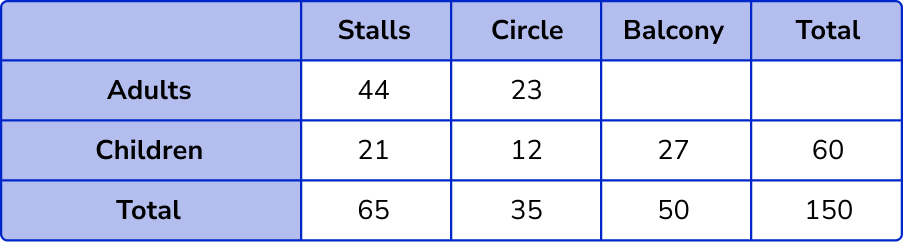
People can sit in a seat in the stalls or the circle or the balcony of a theatre. There are 150 seats altogether.
There are 60 children who have seats in the theatre.
There are 44 adults in the stalls and 23 adults in the circle.
Altogether there are 65 people in the stalls and 50 people in the balcony.
A person is chosen at random. Work out the probability that the person is a child, given that they are sitting on the balcony.
As there are 150 seats altogether, the overall total is 150.
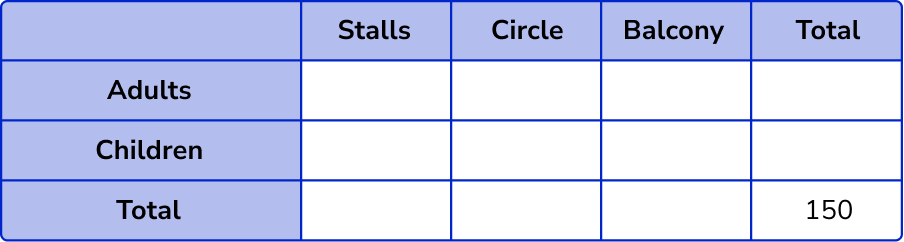
As there are 60 children, the total number of children is 60.

As there are 44 adults in the stalls, and 23 adults in the circle, we can fill in these two values in the adult row.

As there are 65 people in the stalls and 50 people in the balcony, we can also fill in these values.
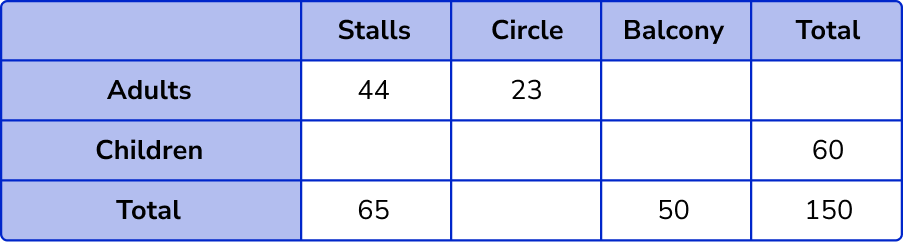
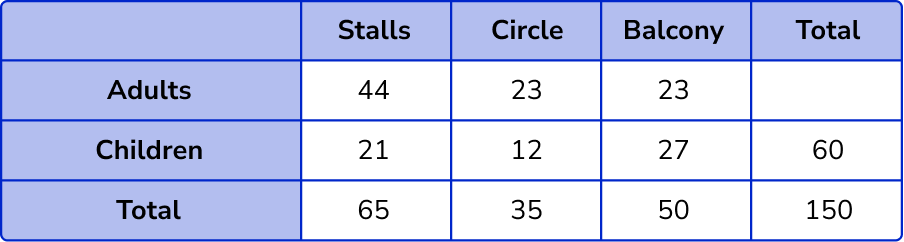
The row or column that has one missing value is the column for the stalls where we do not know the number of children, 65-44 = 21 .

To calculate the number of children in the circle, we need to know the total number of people in the circle, 150-(65 + 50) = 35 .
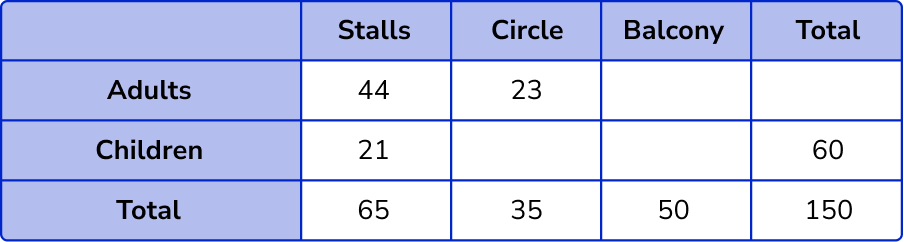
The number of children in the circle is, 35-23 = 12 .
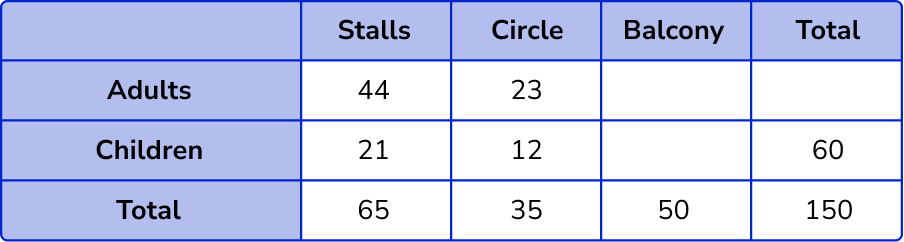
The total number of children in the balcony is 60-(21 + 12) = 27 .
The number of adults in the balcony is 50-27 = 23 .
The only total we need to calculate to complete the two way table is the number of adults,
44+23+23 = 90 .
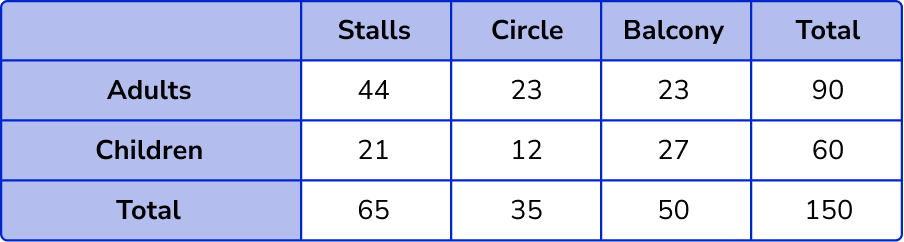
The total number of people = 90 + 60 = 150.
The total number of people in the stalls, circle and balcony = 65 + 35 + 50 = 150
Now we can calculate the probability of selecting a person at random that is a child, given that they are in the balcony seats.
There are 50 people in the balcony seats.
27 of these people are children.
So P(\text{child given they are in the balcony seats}) = \frac{27}{50} .
Common misconceptions
- Whole numbers
The numbers in the two way table are whole numbers, not decimals or fractions. This is because the numbers are frequencies where data has been counted.
- Modelling in maths
The situations in maths questions have been simplified to make the situation simpler to study. The world is a more complex place to live. So individuals need to go under one category and one only.
For example, a school asks students to choose football or rugby. In maths we keep these separate. But in real-life the school may accommodate students who want to choose both or neither. This is where we would use a Venn diagram instead.
Step-by-step guide: Venn diagram
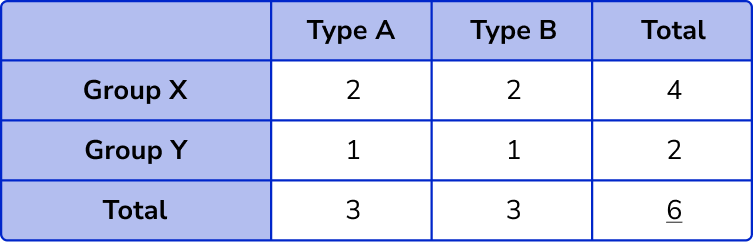
- Frequencies
Each individual is only counted once in the main body of the table. Each of the 14 individuals are only in one of the four cells of the main section of the table.

- Overall total
Be careful not to double the overall total (or grand total).
For example, the ‘grand total’ of this table is 6 . Each individual item only counts once towards the ‘grand total’. But it can be worked out using the row totals or the column totals.
4+2=3+3=6
Practice two way tables questions
1. Complete the two way table.
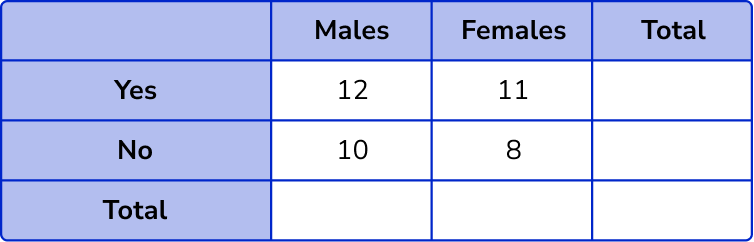
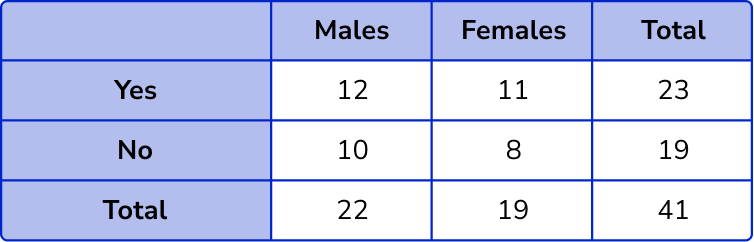


The column totals are 12+10=22 and 11+8=19.
The row totals are 12+11=23 and 10+18=18.
The overall total will be 22+19=41.
2. Complete the two way table.
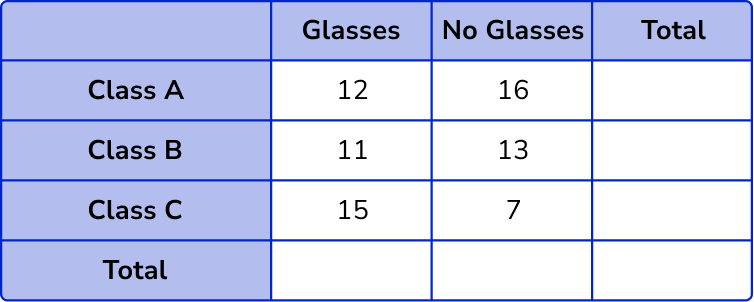

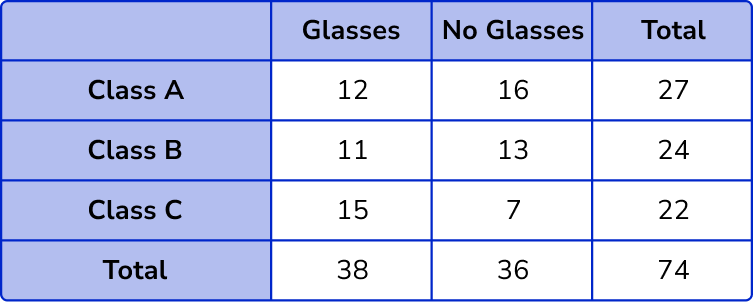
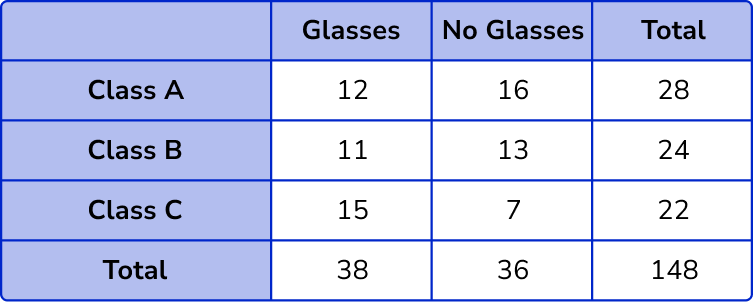

The column totals are 12+11+15=38 and 16+13+7=36 .
The row totals are 12+16=28, 11+13=24 and 15+7=22 .
The overall total will be 38+36=74.
3. Complete the two way table.
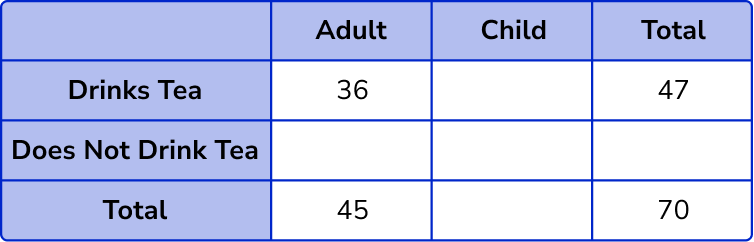


Find the missing values in the table by subtracting or adding.
Total number of children = 70 – 45 = 25 .

Adult and does not drink tea = 45 – 36 = 9 .
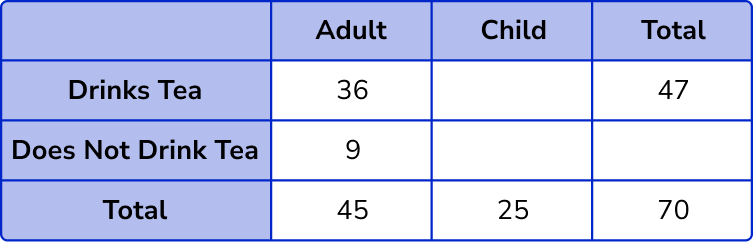
Child and drinks tea = 47 – 36 = 11 .
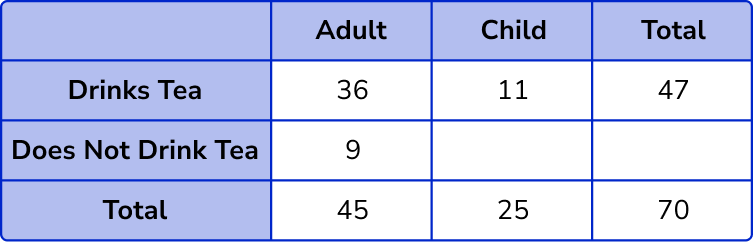
Child and does not drink tea = 25 – 11 = 14 .
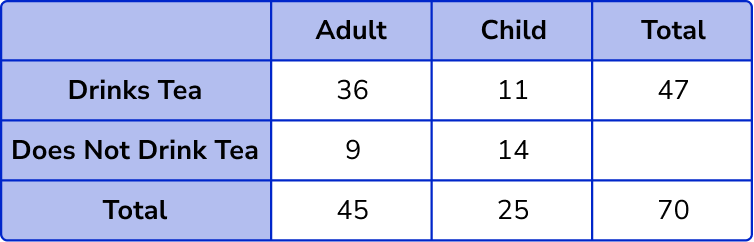
Total number of people who do not drink tea = 9 + 14 = 23 .
4. 100 sportsmen and women were asked about what sport they play. Draw a two way table showing the results below.
- 55 people play football
- 53 people are women
- 24 people play hockey
- 10 men play hockey
- 18 women play rugby
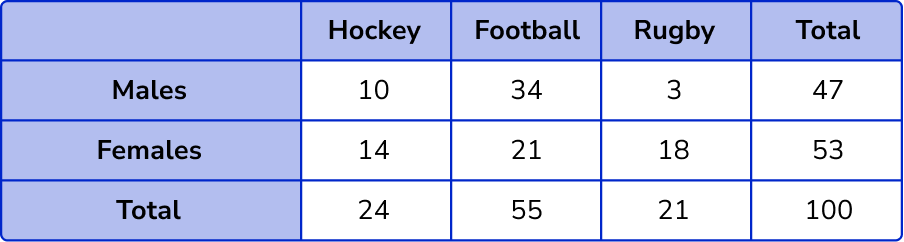


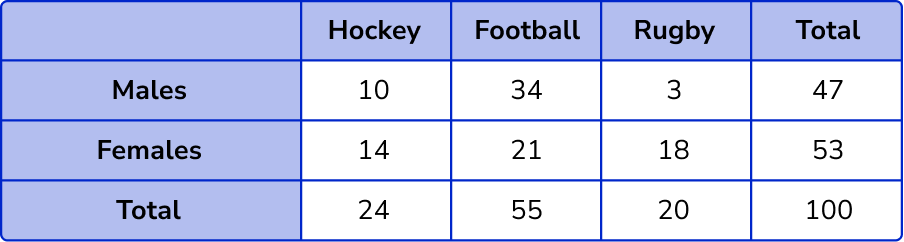
Find the missing values in the table by subtracting or adding.
The information from the question gives us the following incomplete two way table.
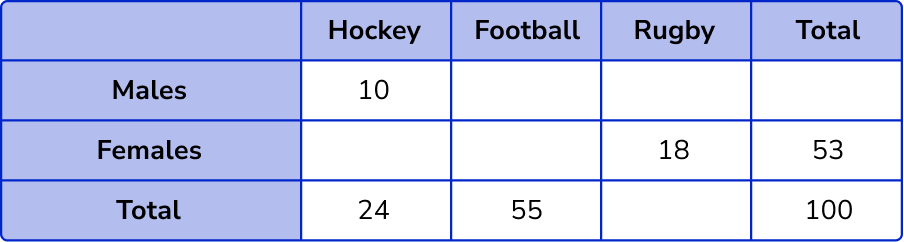
The number of females who play hockey = 24-10 = 14 .
The number of females who play football = 53-(18+14) = 21 .
The number of males who play football = 55-21 = 34 .
The total number of rugby players = 100-(24+55) = 21 .
The number of males who play rugby = 21-18 = 3 .
The total number of males = 10+34+3 = 47 .
5. 40 people were asked if they ate meat or were vegetarian/vegan.
25 women were asked and 10 of them did not eat meat.
13 men ate meat.
Calculate the probability of selecting a male at random that does not eat meat.
The original two way table is
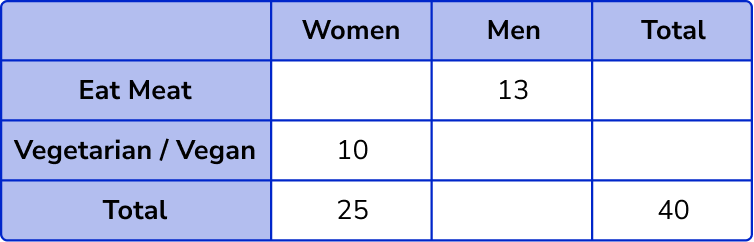
Filling in the other values into the two way table, we have
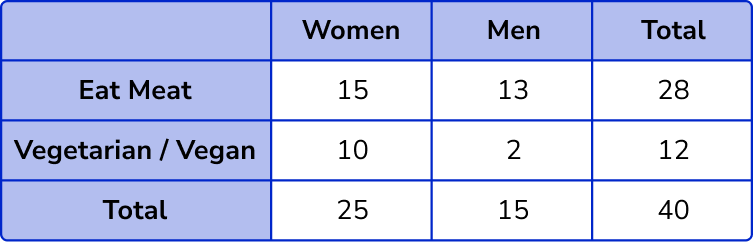
The number of males who do not eat meat is 2.
The total number of people is 40.
P(\text{Male who is vegetarian/vegan}) =\frac{2}{40}
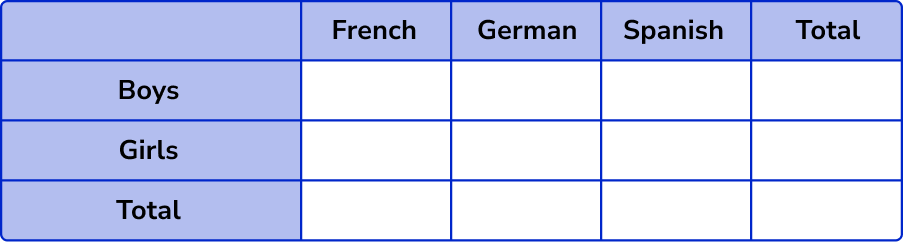
6. 120 students are asked to choose French, German or Spanish.
Altogether 45 students chose German and 55 chose Spanish.
13 boys chose French.
17 girls chose German.
There are 64 boys altogether.
Complete the table and use it to work out the probability that a girl selected studies Spanish.
Calculating the values in the two way table, we have
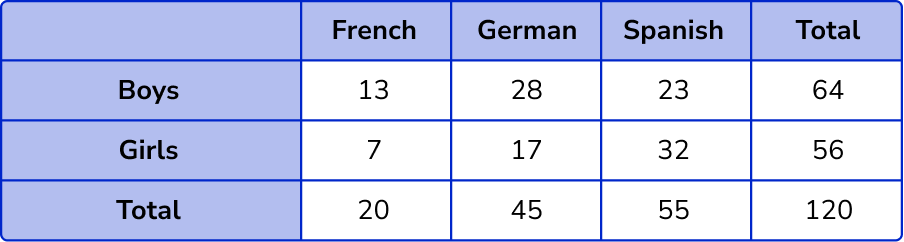
The total number of girls = 56 .
The number of girls who study Spanish = 32 .
P(\text{Spanish, given that they are a girl}) = \frac{32}{56} .
Two way tables GCSE questions
1. Complete the two way table:
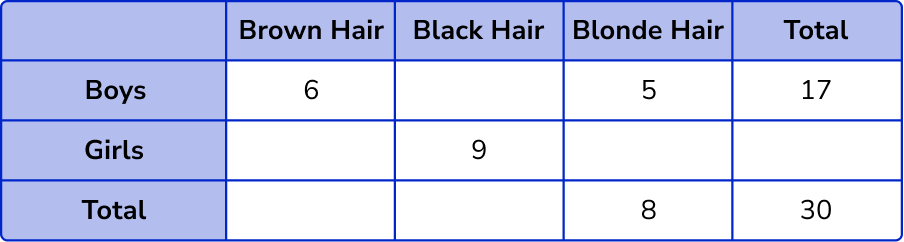
(3 marks)
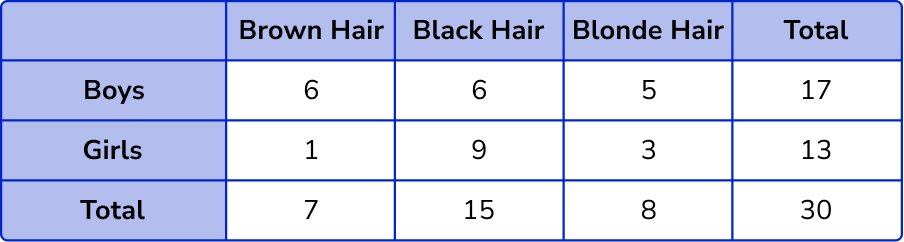
6,1,3,13,7,15
(3)
5 correct
(2)
4 correct
(1)
2. 70 students each choose to study Drama or Music.
32 of the students choose Drama.
17 boys choose Music.
19 girls choose Drama.
(a) Use this information to complete the two way table.
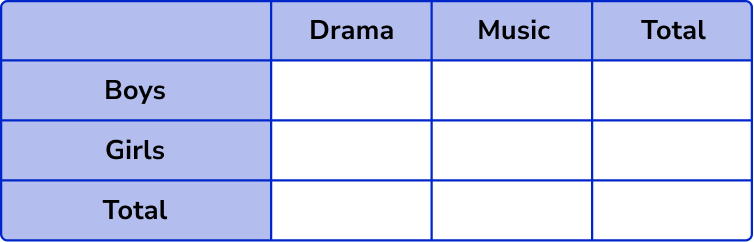
(b) A student is picked at random. Work out the probability that the student is a boy who chooses drama.
(c) A Music student is picked at random. Work out the probability that the student is a girl.
(8 marks)
(a)
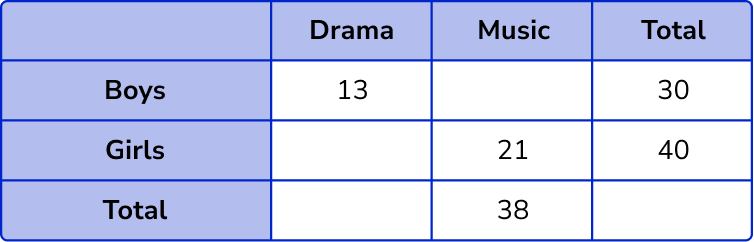
(1)

17, 19, 32, 70
(3)
3 correct
(2)
2 correct
(1)
(b)
13 or 70
(1)
\frac{13}{70}(1)
(c)
17 or 38
(1)
\frac{17}{38}(1)
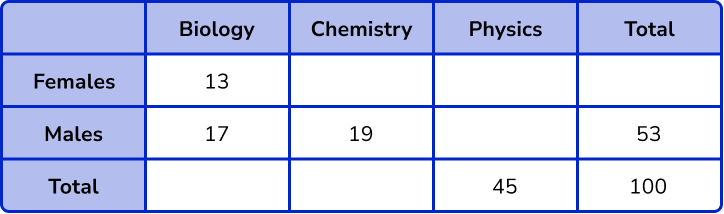
3. 100 students are asked to choose one revision session to attend.
The revision classes are – Biology or Chemistry or Physics.
There are 53 male students.
45 students choose Physics.
13 female students choose Biology.
19 male students choose Chemistry and 17 choose Biology.
(a) Complete the two way table.
(b) How many female students choose Chemistry?
(c) A student is picked at random. Work out the probability that the student is male and choose physics.
(d) A Biology student is picked at random. Work out the probability that the student is Female.
(9 marks)
(a)
(1)
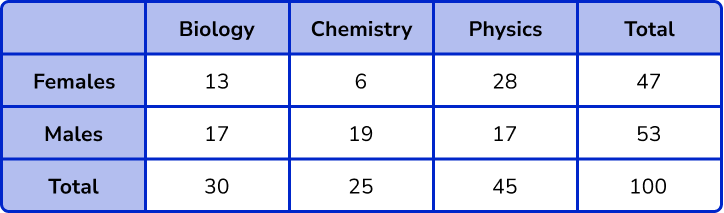
6, 28, 47, 17, 30, 25
(3)
5 correct
(2)
4 correct
(1)
(b)
6 female students choose Chemistry.
(1)
(c)
17 or 100
(1)
\frac{17}{100}(1)
(d)
13 or 30
(1)
\frac{13}{30}(1)
Learning checklist
You have now learned how to:
The next lessons are
Still stuck?
Prepare your KS4 students for maths GCSEs success with Third Space Learning. Weekly online one to one GCSE maths revision lessons delivered by expert maths tutors.

Find out more about our GCSE maths tuition programme.