GCSE Tutoring Programme
Our chosen students improved 1.19 of a grade on average - 0.45 more than those who didn't have the tutoring.
In order to access this I need to be confident with:
Arithmetic 2D shapes Fractions amounts Percentage of an amount Tally chartsThis topic is relevant for:

Pictograph
Here we will learn about pictographs, including constructing, completing, interpreting, and problem solving with pictographs.
You can also download the following free pictograph resources suitable for those following Edexcel, AQA or OCR exam boards:
What is a pictograph?
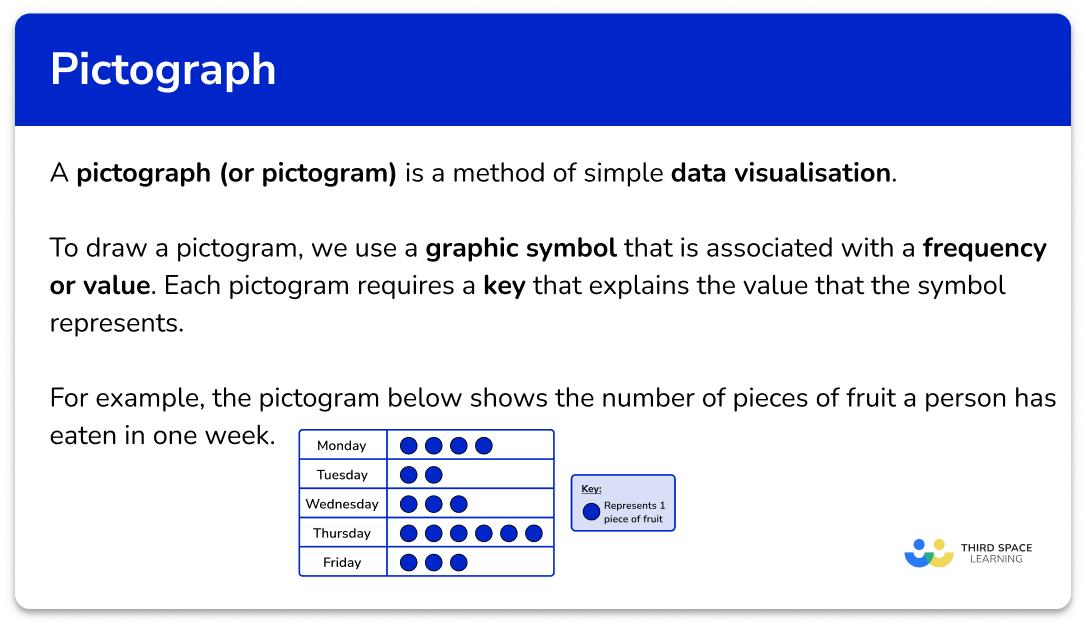
A pictograph is a method of data visualisation.
Data handling is the process of gathering, recording and presenting data so that it is useful to others; pictographs (or pictograms) are infographics used to present data within a data set.
To draw a pictograph, we use a graphic symbol that is associated with a frequency or value. Each pictograph therefore requires a key that explains the value that the symbol represents.
A pictograph design can be constructed using a table with two columns. In the first column is the name of the group or category, and the second column features the graphic symbol.
Below is a pictogram showing the number of pieces of fruit eaten per day over 1 week.
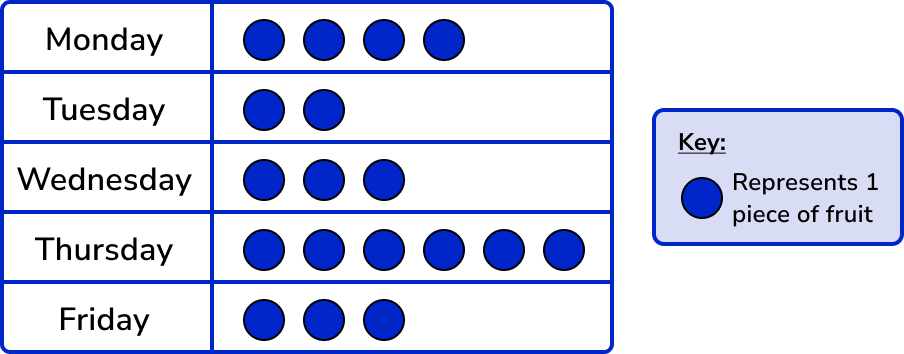
Here, each blue circle represents 1 piece of fruit and so we can see that 4 pieces of fruit were consumed on Monday, 2 pieces of fruit were consumed on Tuesday, etc.
We need to be able to construct and interpret pictographs.
What is a pictograph?
How to construct a pictograph
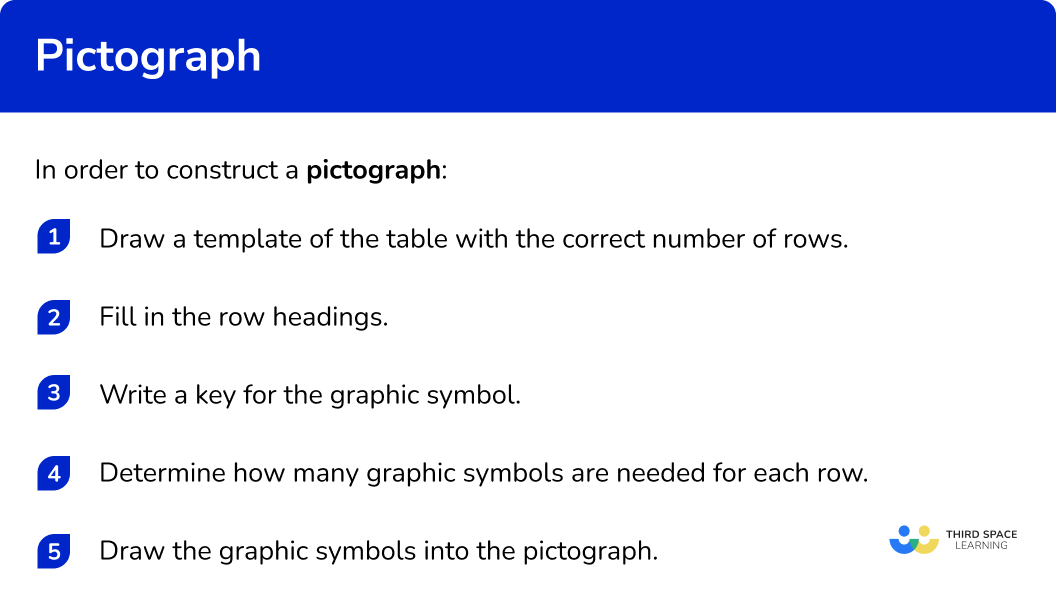
In order to construct a pictograph:
- Draw a template of the table with the correct number of rows.
- Fill in the row headings.
- Write a key for the graphic symbol.
- Determine how many graphic symbols are needed for each row.
- Draw the graphic symbols into the pictograph.
Explain how to construct a pictograph
Pictograph and pictogram worksheet
Get your free pictograph and pictogram worksheet of 20+ questions and answers. Includes reasoning and applied questions.
COMING SOONPictograph and pictogram worksheet
Get your free pictograph and pictogram worksheet of 20+ questions and answers. Includes reasoning and applied questions.
COMING SOONRelated lessons on representing data
Pictograph is part of our series of lessons to support revision on representing data. You may find it helpful to start with the main representing data lesson for a summary of what to expect, or use the step by step guides below for further detail on individual topics. Other lessons in this series include:
Pictographs examples
Example 1: construct a pictograph with graphic symbol equal to 1 unit
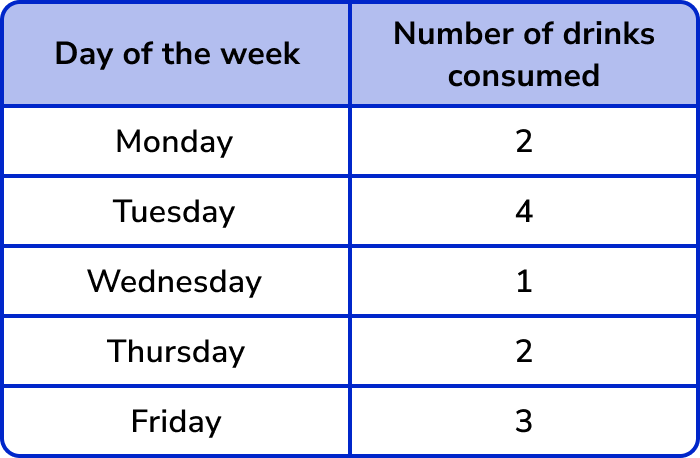
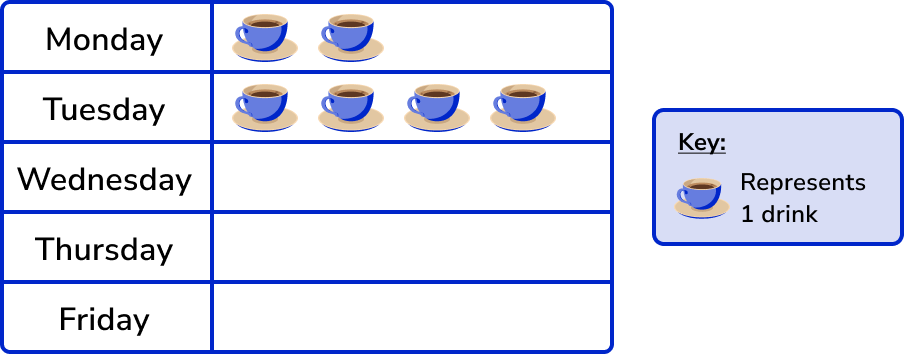
Use the information in the table below to construct a pictogram of the number of drinks consumed per day over 5 days.
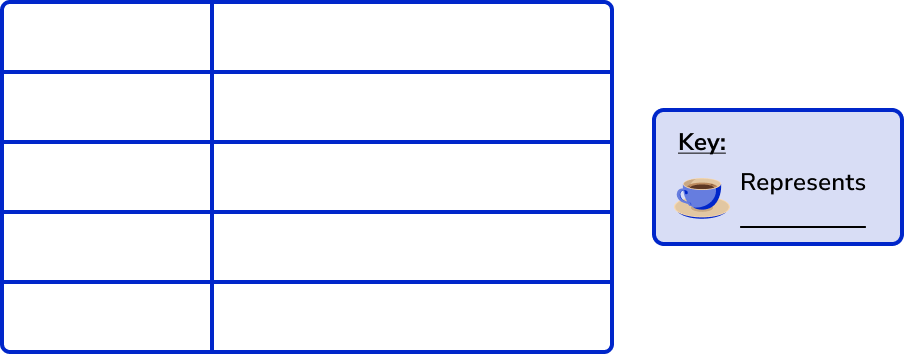
- Draw a template of the table with the correct number of rows.
Below is a template for the pictogram.
Note, we have used a cup as the graphic symbol for this question.
2Fill in the row headings.
The row headings will match the days of the week in the table.
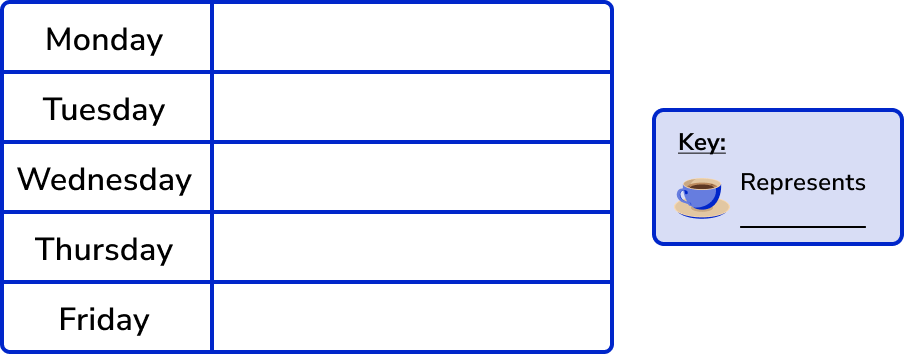
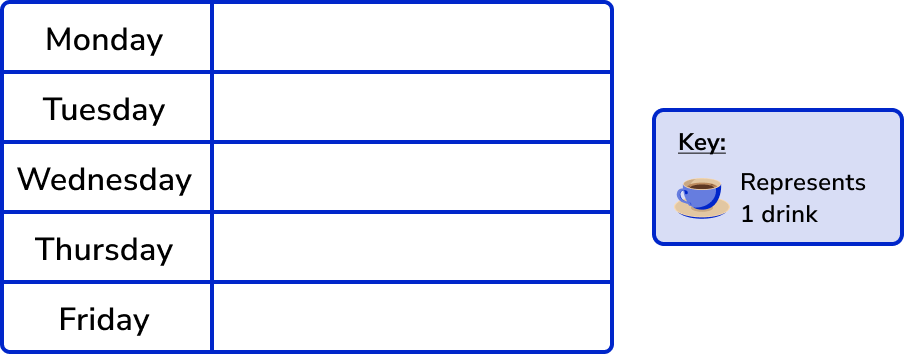
3Write a key for the graphic symbol.
As the number of drinks for each day is a very low number, you can use 1 cup to represent 1 drink.
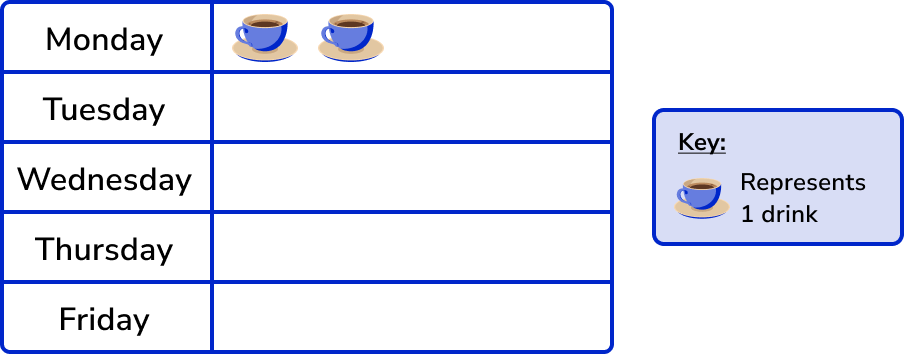
4Determine how many graphic symbols are needed for each row.
As each cup represents 1 drink, the number of cups drawn is equivalent to the frequency for the row.
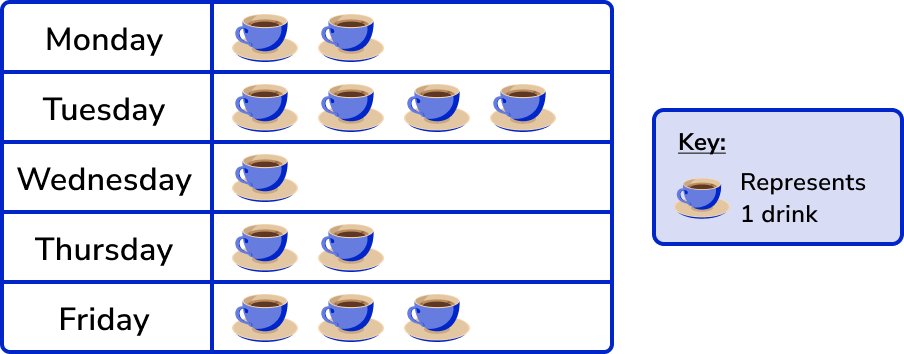
5Draw the graphic symbols into the pictograph.
2 drinks were consumed on Monday and so you need to draw 2 cups in the right hand column for Monday.
4 drinks were consumed on Tuesday and so you need to draw 4 cups in the right hand column for Tuesday.
Continuing this for the other three days, you have the final pictogram.
Example 2: construct a pictograph from a tally chart
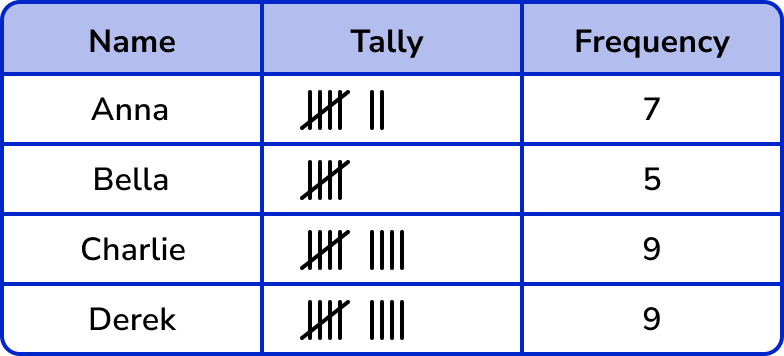
Four students were playing a game of marbles. The number of games won is recorded in the tally chart below.
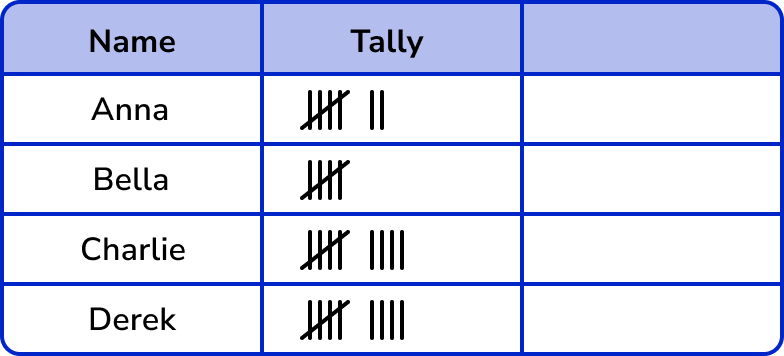
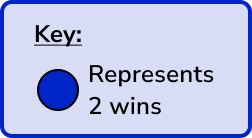
Draw a pictogram of the number of game wins. Use the key provided.
The template including the key has four rows (one for each child).

The row headings are the names of the four children.
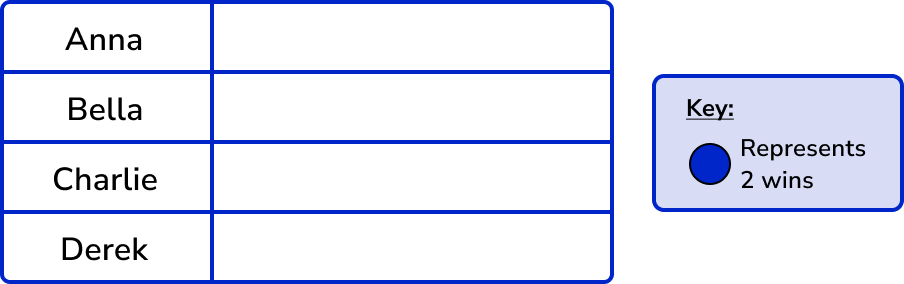
The key is already provided for this question.
Here, 1 circle represents 2 wins.
You need to determine the frequency of wins for each row using the tally chart, and then you can calculate the number of circles.
Completing the tally chart, you have
As a circle represents 2 wins, you need to divide each frequency by 2 to determine the number of circles for each row.
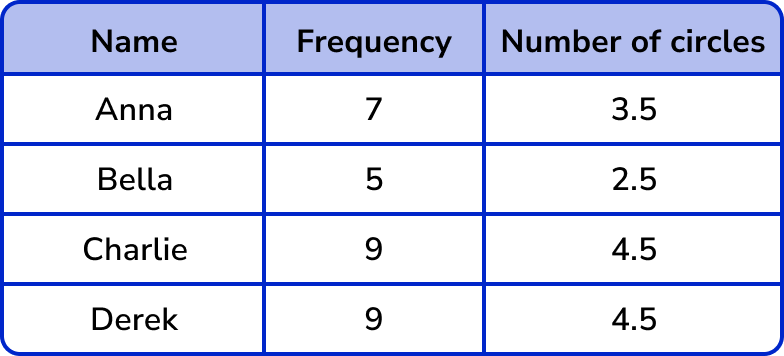
All four people have a decimal value for the number of circles so you need to represent this amount as part of a circle.
0.5 is the same as a half, and half of a circle is a semicircle.

You therefore need to draw,
- 3 full circles and a semicircle for Anna.
- 2 full circles and a semicircle for Bella.
- 4 full circles and a semicircle for Charlie.
- 4 full circles and a semicircle for Derek.
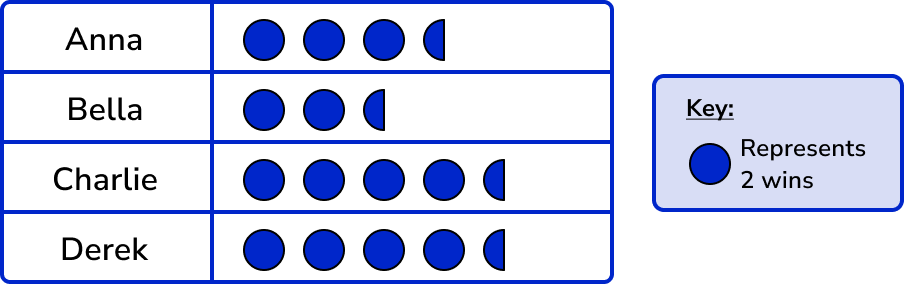
Filling in each row with the correct number of circles (and semicircles) you have the solution.
Example 3: construct a pictograph with graphic symbol equal to a large value
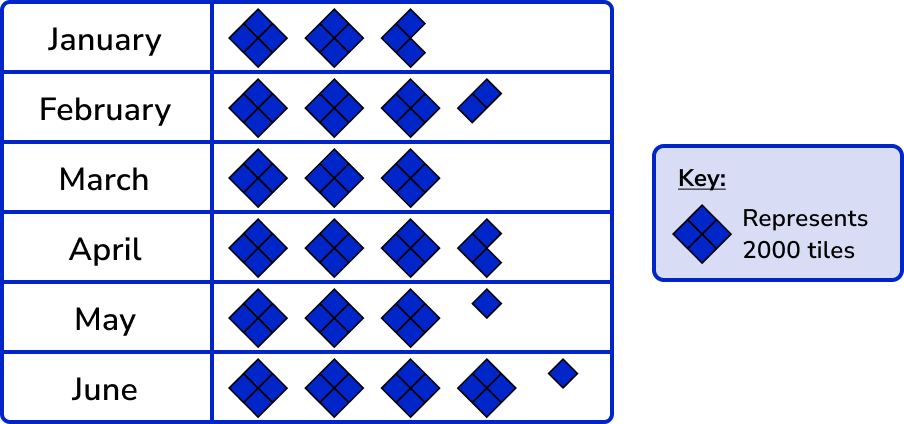
A tile manufacturer is calculating the average number of tiles the factory produces per day over the first 6 months of the year. Below is a table of results.
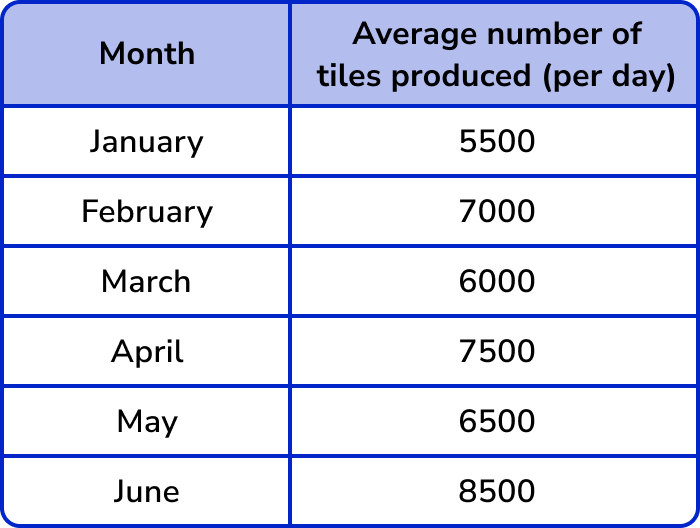
Given that the symbol  represents 2000 tiles, complete the pictogram below. The first row has been done for you.
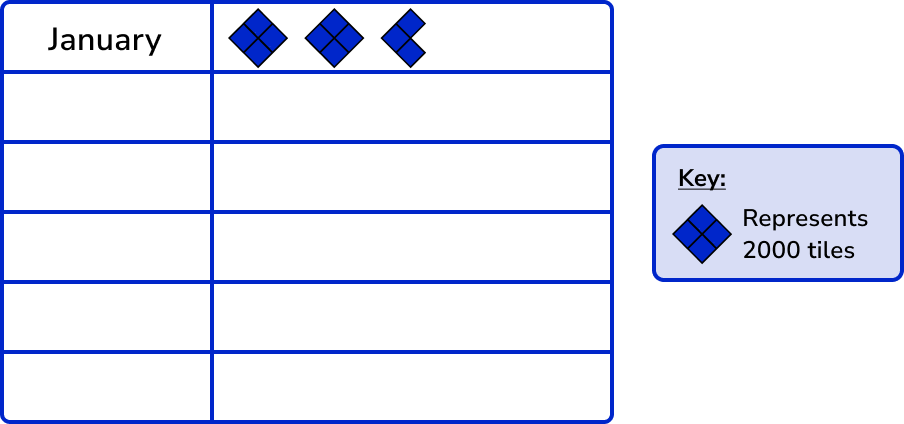
You have already been given a template including the key and so you can move on to the next step.
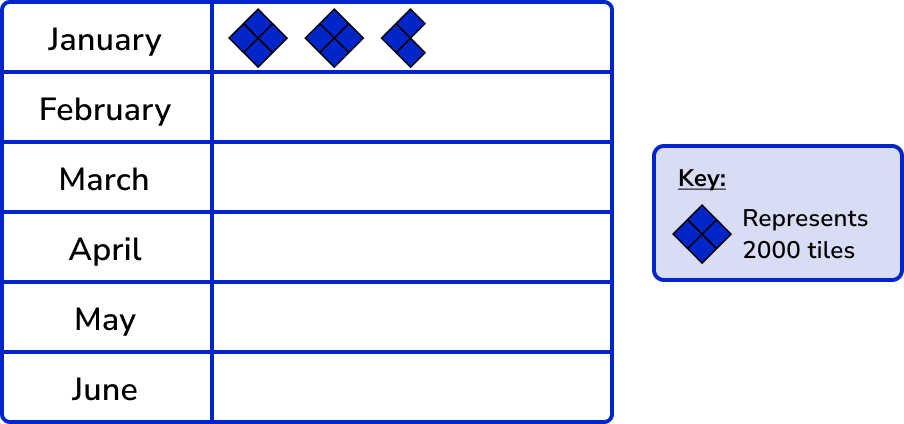
The row headings are the months of the year in the table.
The key is already provided so you can move on to the next step.
As each symbol represents 2000 tiles, you need to divide each frequency by 2000 to get the number of each symbol for the row.
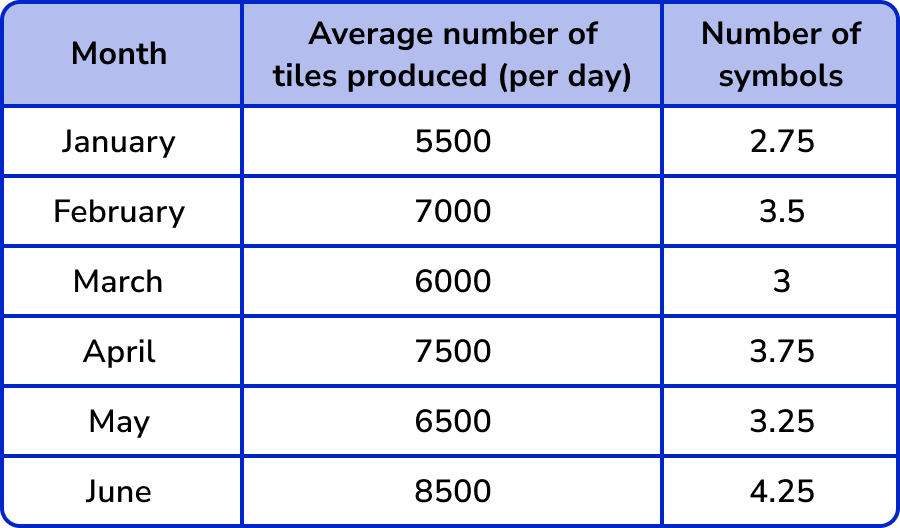
You need to draw 3 full symbols for March.

For May and June, you need to determine what a quarter of the full symbol may look like. As the symbol is made up of 4 squares, one quarter of this symbol can be one small square.

You need to draw 3 full symbols and one quarter of a symbol for May.
You need to draw 4 full symbols and one quarter of a symbol for June.
For February, you need to determine what a half of the full symbol may look like. As the symbol is made up of 4 squares, one half of this symbol would be 2 squares.

You need to draw 3 full symbols and one half of a symbol for February.
January has already been drawn and so three quarters of the symbol looks like this.

Note: The whole symbol represents 2000 tiles and so each square within the symbol would be worth the equivalent of 500 tiles; 2 squares would therefore represent 1000 tiles, and 3 squares would represent 1500 tiles.
Drawing the remaining rows of the pictograph, you have
How to interpret a pictograph
In order to interpret a pictograph:
- Select the row(s) required.
- Carry out any calculation required.
- Write your answer.
Explain how to interpret a pictograph
Example 4: find the range using a pictograph
A fox has had three litters of cubs. The number of cubs in each litter is represented in the pictograph below.
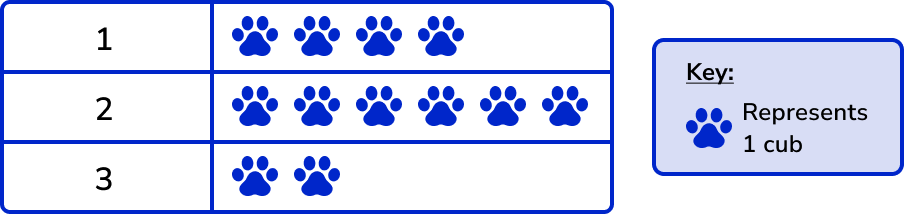
What is the range of the number of cubs in her three litters?
The range is the difference between the highest and the lowest values.
The highest value is the second row (6), and the lowest value is the third row (2) of the pictogram.
6-4=4
The range of the number of cubs in the fox’s litter is 4.
Example 5: calculate frequency using a pictograph
A nursery school records the number of children that attend their after school play group over one week. The pictogram below shows their results.
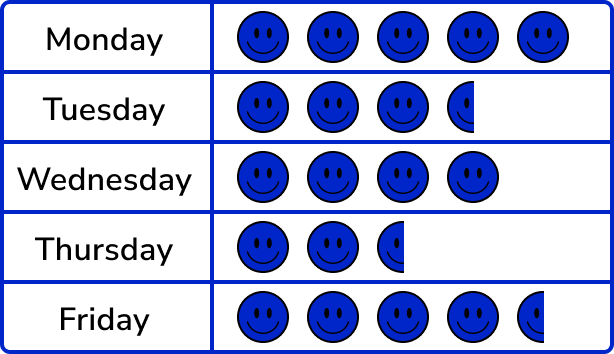
Given that 8 children attended on Wednesday, determine the number of children who attended on Thursday.
The two rows that are important for this question are Wednesday and Thursday.
There is no key and so you need to find the value of one smiley face so that you can find the frequency of children on Thursday.
As 4 smiley faces is equivalent to 8 children, calculating 8 divided by 4 will give you the number of children per smiley face.
8\div{4}=2
A smiley face represents 2 children.
The row for Thursday has 2.5 smiley faces. Half of a smiley face would represent half of the value for a full smiley face and so half a smiley face would represent 1 child.
Similarly you can calculate 2.5\times{2}=5.
5 children attended the after school play group on Thursday.
Example 6: interpreting a pictograph
The pictogram below shows the number of steps a person walked per day to the nearest 500 steps during one week.
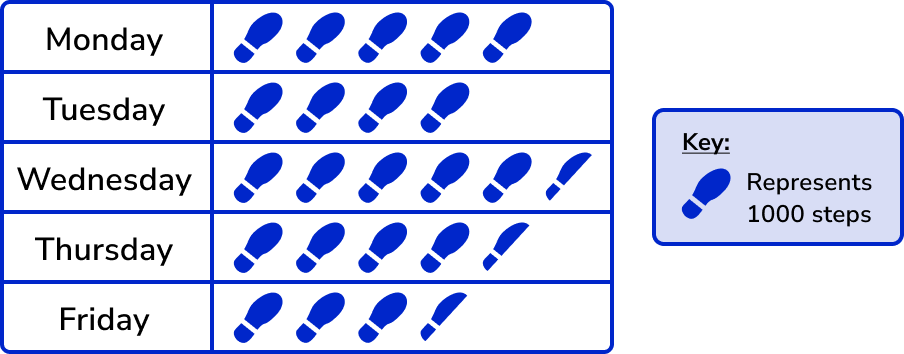
Did the person reach their 22000 step goal for the week?
You need to use all the rows in the pictogram to determine the total frequency.
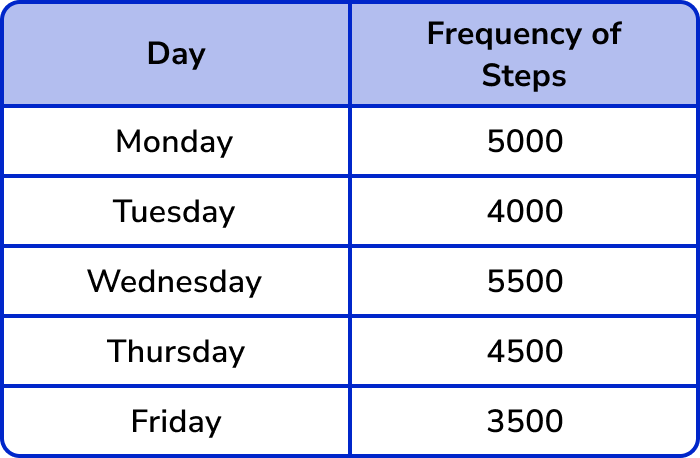
Calculating the total frequency, you have
5000+4000+5500+4500+3500=22500.
Yes. The person walked 22500 steps in the week.
Common misconceptions
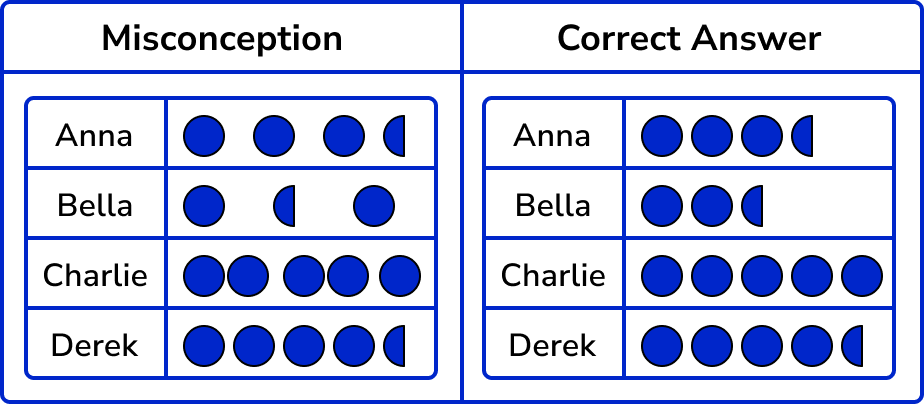
- Left alignment of graphic symbols
The graphic symbols should be aligned to the left of the column and not randomly placed within the space. This is because the pictogram is easier to read when the symbols are in line with each other.
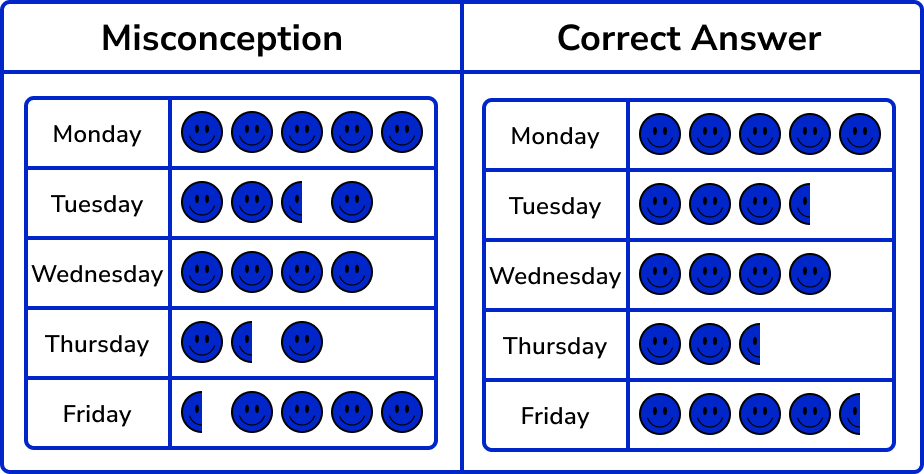
- The fractional symbol does not appear last
Identical copies of the symbol must appear before the smaller unit. For example, the pictogram below would be incorrect as the half smiley faces do not appear as the last image in the row.
Practice pictograph questions
1. The table below shows the age of 5 children.
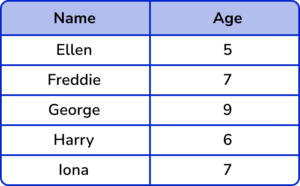
Represent this information in a pictogram. Use the key provided below.
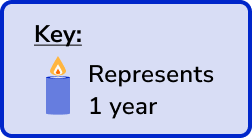
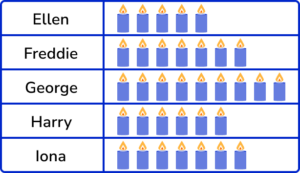

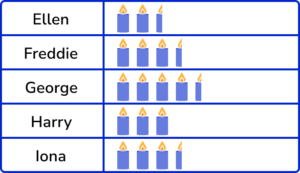

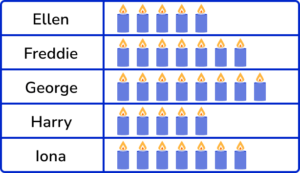
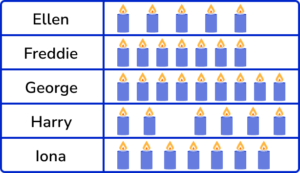
Each candle represents 1 year so the number of candles for each row matches the age of the child. All the symbols are left aligned with the correct number in each row.
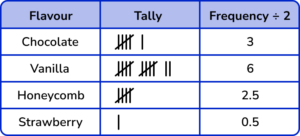
2. The number of different flavours of ice cream sold on one day is shown in the tally chart below.
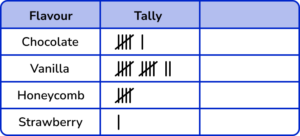
Using the key, ![]() represents 2 ice creams, construct a pictogram to show this data.
represents 2 ice creams, construct a pictogram to show this data.
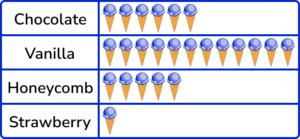
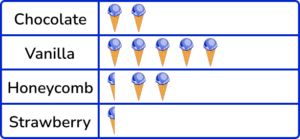
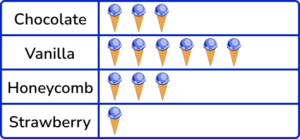
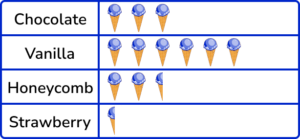
Each image represents 2 ice creams and so we need to divide each frequency by 2 and then draw that number of ice creams in each row.
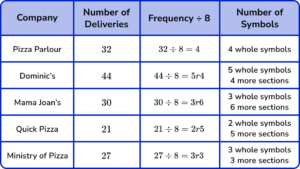
3. A delivery company is looking at how many pizzas they have delivered from 5 different companies during one evening.
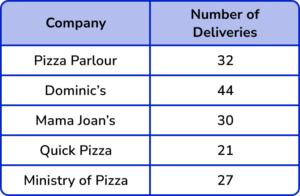
Use the information in the table below to draw a pictogram of this data with the key:  represents 8 deliveries.
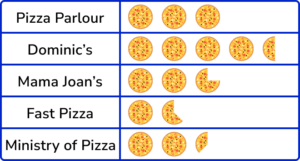

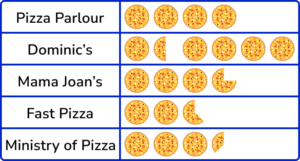
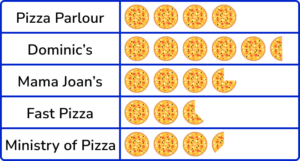
As each symbol represents 8 deliveries, one section of the symbol can represent 1 delivery.
Dividing each frequency by 8, we get the number of whole graphic images and then we can determine how many more sections of the image we need to draw for each row as this is the remainder.
4. Jamil records the number of cans of pop he drinks per day over one week. He displays his results in the pictogram below.
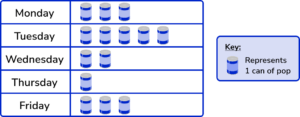
Determine the mode number of cans of pop he drank during the week.
The mode is 3 because the number of cans of pop Jamil drank on Monday and Friday is the same and so this value is the mode. As each symbol represents 1 can of pop, the number of cans of pop is equal to the number of each symbol in the pictogram.
5. The pictogram below shows the number of days of sunshine over 5 weeks.
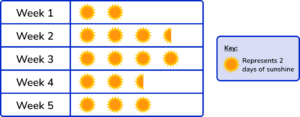
State the error made within this pictogram.
The symbols are not the same in weeks 2 and 4.
The frequencies are not in order from smallest to largest.
The number of days in week 3 is more than 7.
The symbols should be drawn on top of each other like a bar chart.
Week 3 has 4 suns. As each sun is worth 2 days, the number of days in week 3 is 4 \times 2=8 which is not possible.
6. A biologist is researching the number of daisies in a field. Using a quadrat, they count the number of daisies in the sample and then record the sample size in a table. The quadrat does not cover the same area of land twice. The pictogram below shows their results.
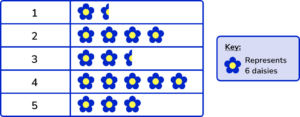
Calculate the mean number of daisies in each sample.
The frequency of daisies in each sample is
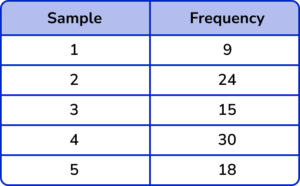
The total number of daisies = 9+24+15+30+18=96.
The mean = \frac{96}{5}=19.2.
We cannot have 0.2 of a daisy and so we round to the nearest whole number, here, 19.
Pictograph GCSE questions
1. The incomplete pictogram below shows the different colours of buttons in a sewing box.
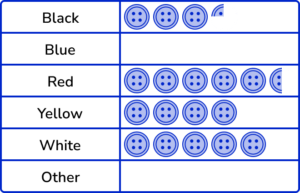
Use the following information to complete the pictogram.
- There are 40 white buttons
- There are the same number of yellow and blue buttons
- There are 204 buttons altogether.
(5 marks)
40 \div 5=8 or one graphic symbol is worth 8 buttons.
(1)
4 full symbols drawn in the Blue row.
(1)
204-(26+32+44+32+40)=30(1)
30 \div 8=3.5(1)
3.5 buttons drawn in the Other row.
(1)
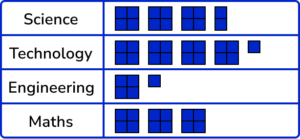
2. Below is an incomplete tally chart showing the favourite STEM subject chosen by 48 students.
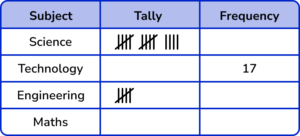
(a) Complete the tally chart.
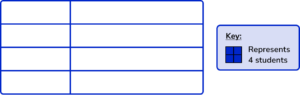
(b) Represent this data in the pictogram below.
(8 marks)
(a)
Science (14) and Engineering (5)
(1)
|||| |||| |||| || drawn for Technology
(1)
Frequency for Maths = 48-36=12
(1)
|||| |||| || drawn for Maths
(1)
(b)
3 full symbols and 2 squares for Science and row labelled.
(1)
4 full symbols and 1 square for Technology and row labelled.
(1)
1 full symbol and 1 square for Engineering and row labelled.
(1)
3 full symbols for Maths and row labelled.
(1)
Final Pictogram:
3. (a) Below is a pictogram showing the average house price for 5 streets in a town.
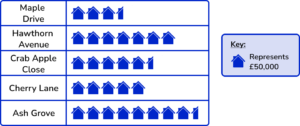
What is the range of house prices for these 5 streets?
(4 marks)
Ash Grove (£425,000)
(1)
Maple Drive (£175,000)
(1)
425000-175000(1)
£250,000(1)
Learning checklist
You have now learned how to:
The next lessons are
Still stuck?
Prepare your KS4 students for maths GCSEs success with Third Space Learning. Weekly online one to one GCSE maths revision lessons delivered by expert maths tutors.

Find out more about our GCSE maths tuition programme.