GCSE Tutoring Programme
Our chosen students improved 1.19 of a grade on average - 0.45 more than those who didn't have the tutoring.
In order to access this I need to be confident with:
Frequency table Grouped frequency table How to find the midpoint Plotting graphsThis topic is relevant for:

Frequency Polygon
Here we will learn about frequency polygons, including what they are and how to construct them.
You can also download the following free frequency polygon resources suitable for those following Edexcel, AQA or OCR exam boards:
What is a frequency polygon?
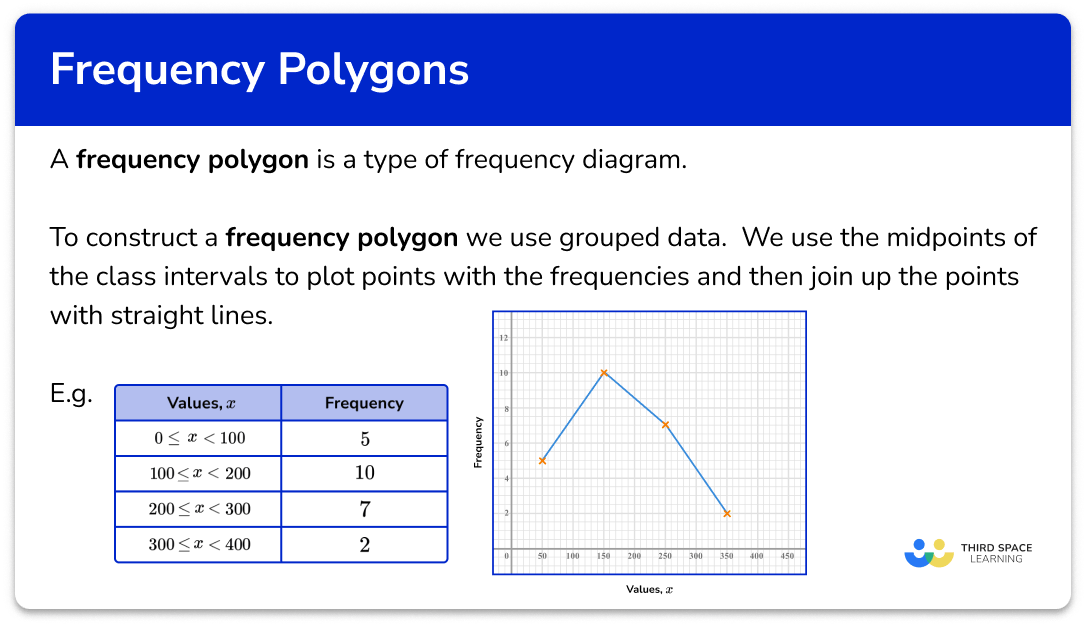
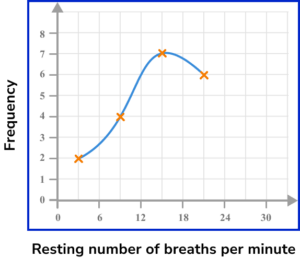
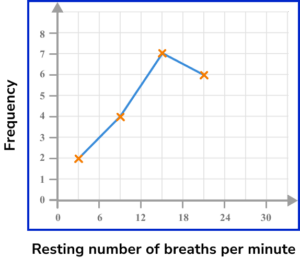
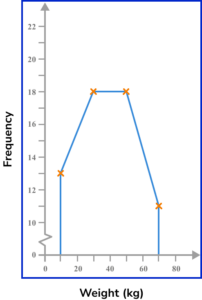
A frequency polygon is a graph that shows the frequencies of grouped data. It is a type of frequency diagram that plots the midpoints of the class intervals against the frequencies and then joins up the points with straight lines.
Frequency polygons are used to display data and show the frequency distribution over a continuous scale.
To construct a frequency polygon we need to know the value for the frequency of each group.
For example,
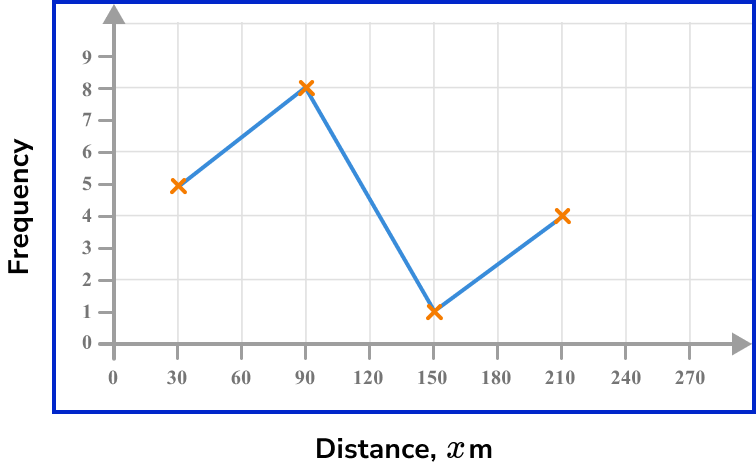
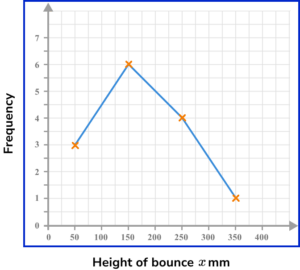
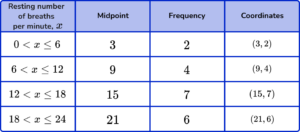
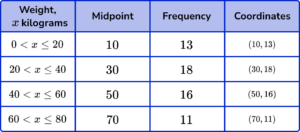
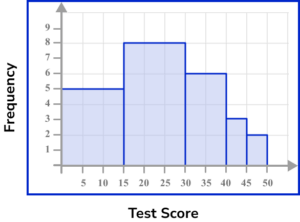
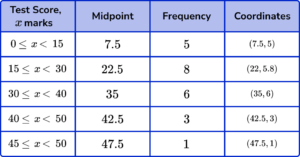
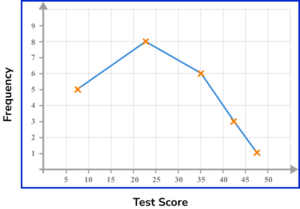
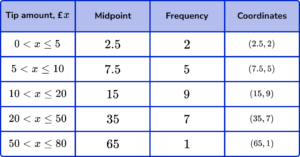
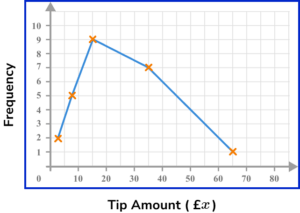
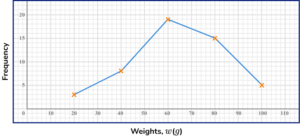
Below is an example of a frequency polygon, with the associated data table.

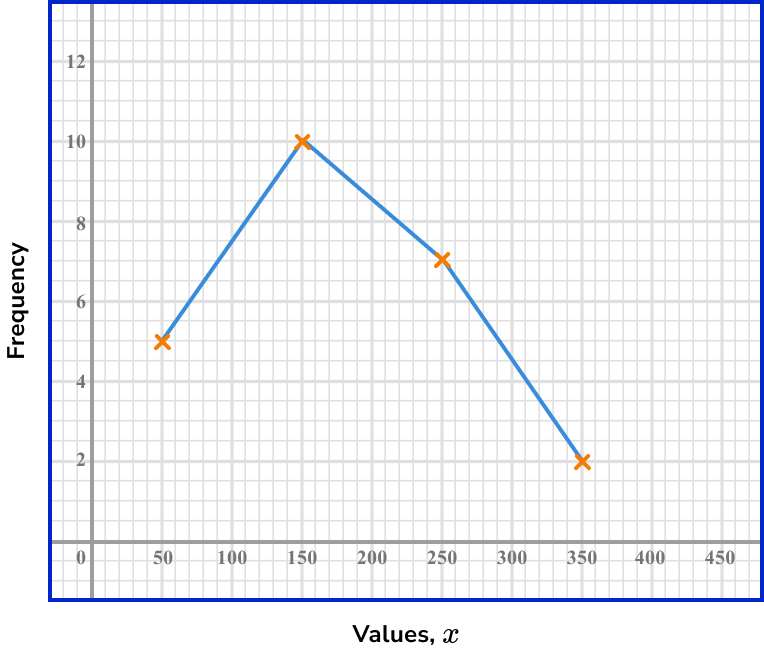
The grouped data is presented as a continuous scale on the horizontal axis.
Step-by-step guide: Frequency diagrams
What is a frequency polygon?
How to draw a frequency polygon
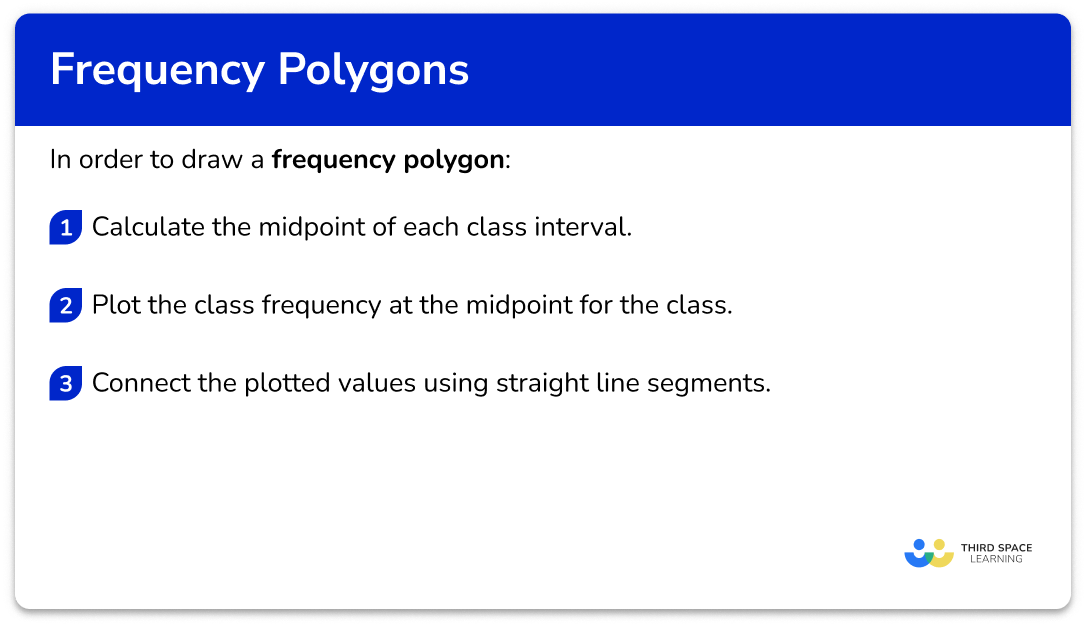
In order to draw a frequency polygon:
- Calculate the midpoint of each class interval.
- Plot the class frequency at the midpoint for the class.
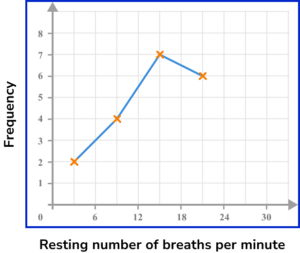
- Connect the plotted values using straight line segments.
Explain how to draw a frequency polygon
Frequency polygons worksheet
Get your free frequency polygons worksheet of 20+ questions and answers. Includes reasoning and applied questions.
DOWNLOAD FREE Frequency polygons worksheet
Get your free frequency polygons worksheet of 20+ questions and answers. Includes reasoning and applied questions.
DOWNLOAD FREERelated lessons on representing data
Frequency polygon is part of our series of lessons to support revision on representing data. You may find it helpful to start with the main representing data lesson for a summary of what to expect, or use the step by step guides below for further detail on individual topics. Other lessons in this series include:
Frequency polygon examples
Example 1: standard problem
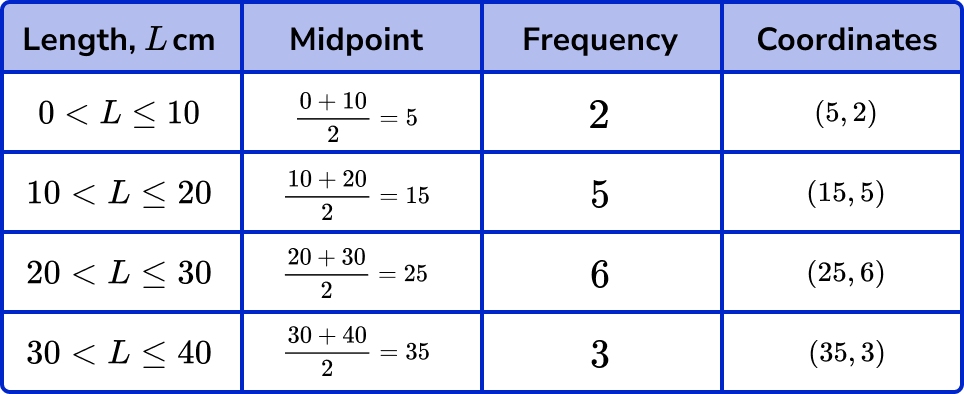
The length L\;cm of 16 carrots were measured and recorded into a grouped frequency table.
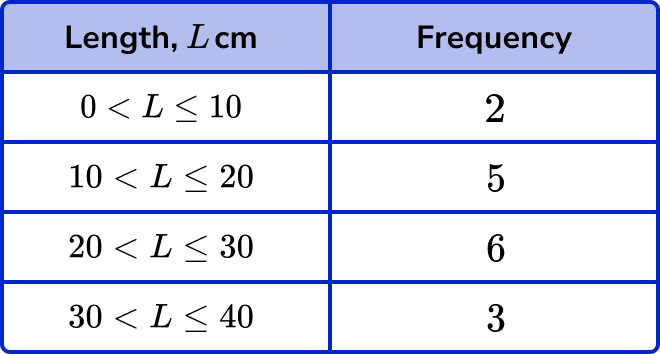
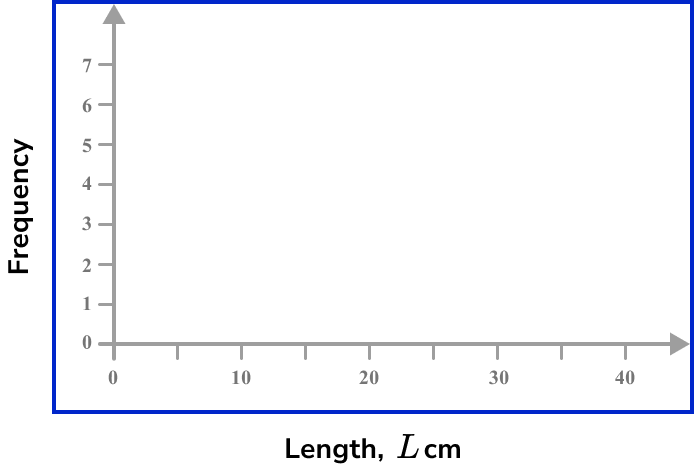
Draw a frequency polygon to represent the grouped data. Use the axes below.
- Calculate the midpoint of each class interval.
The midpoints can be found by adding the lower limit of the class interval to the upper limit of the class interval and dividing by 2.
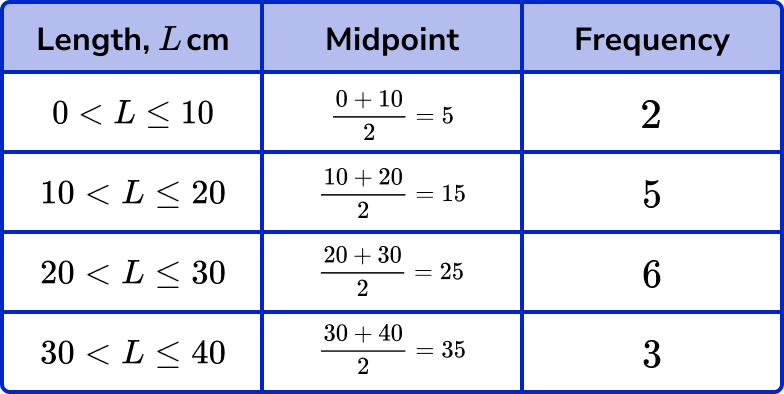
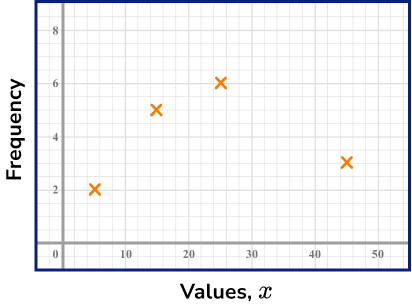
2Plot the class frequency at the midpoint for the class.
The midpoints are the x -coordinate and the frequencies are the y -coordinate.
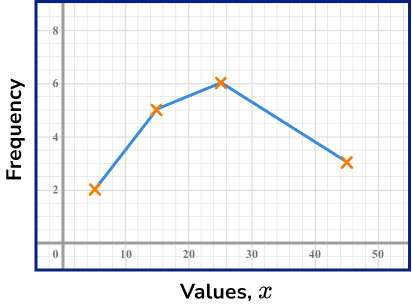
3Connect the plotted values using straight line segments.
Join the first point to the second point with a straight line. Keep joining the points in order with straight lines.
Example 2: large class intervals
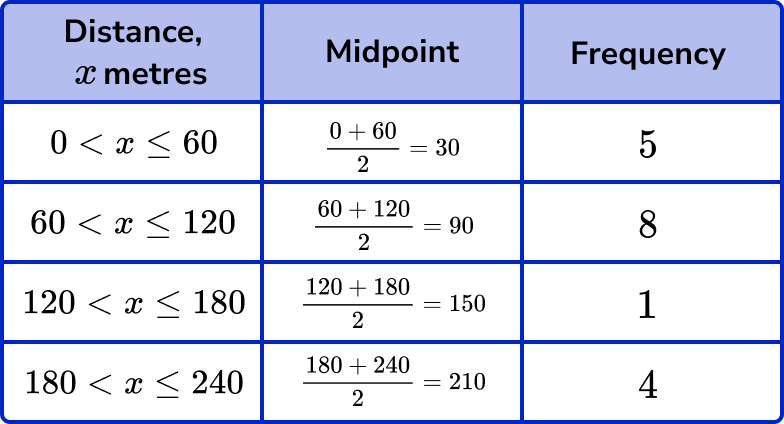
18 students were asked to hop on one leg as far as they can in 3 minutes. The results were grouped into the table below.
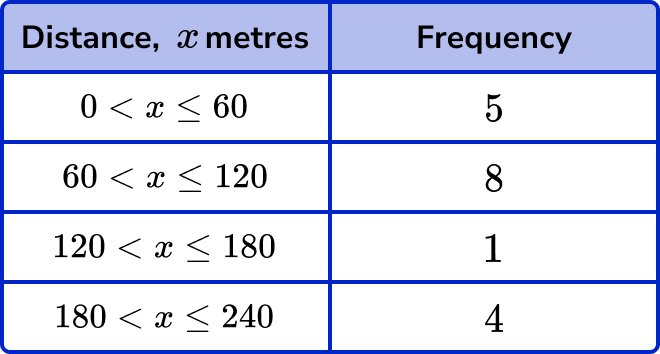
Draw a frequency polygon on the axes provided to represent this data.
The midpoints can be found by adding the lower limit of the class interval to the upper limit of the class interval and dividing by 2 .
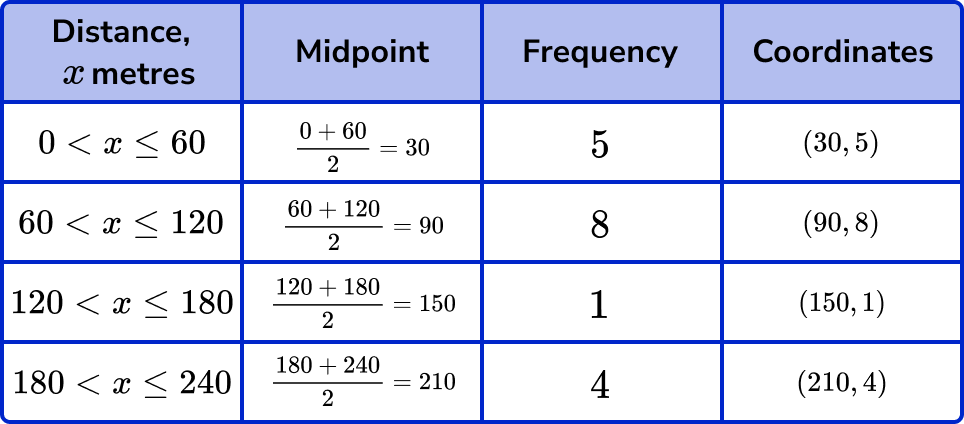
The midpoints are the x -coordinate and the frequencies are the y -coordinate.
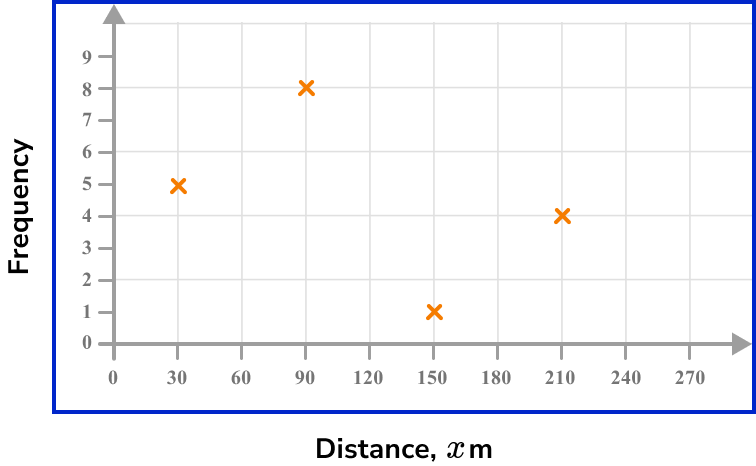
Join the first point to the second point with a straight line. Keep joining the points in order with straight lines.
Example 3: standard problem
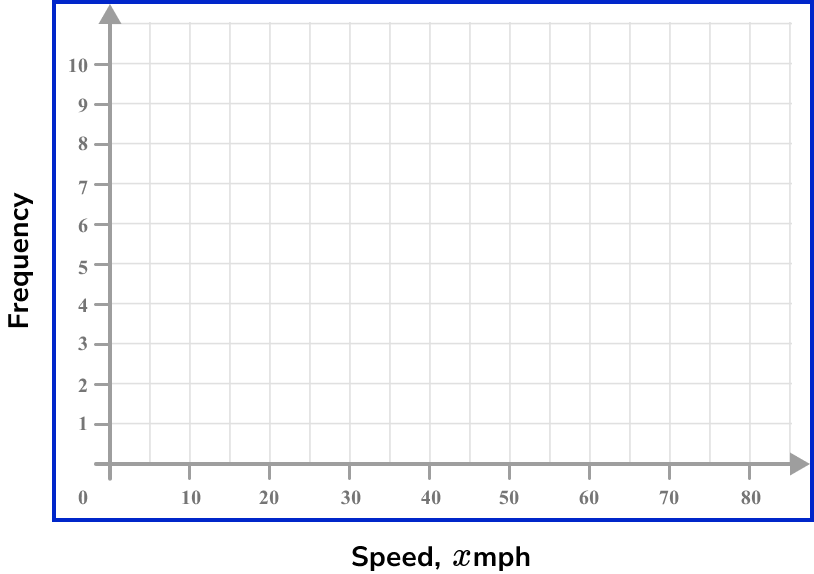
Draw a frequency polygon for the following grouped data on the axes provided showing the average speed of vehicles travelling down a road.
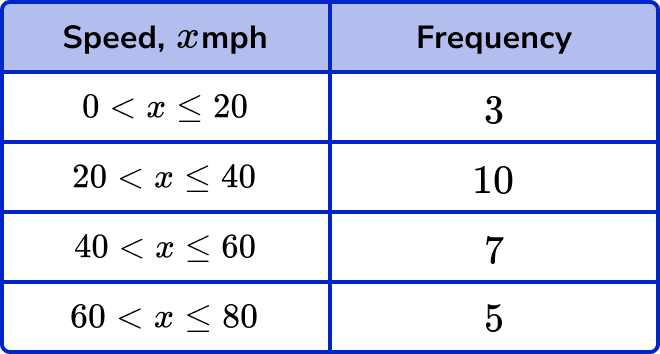
The midpoints can be found by adding the lower limit of the class interval to the upper limit of the class interval and dividing by 2 .
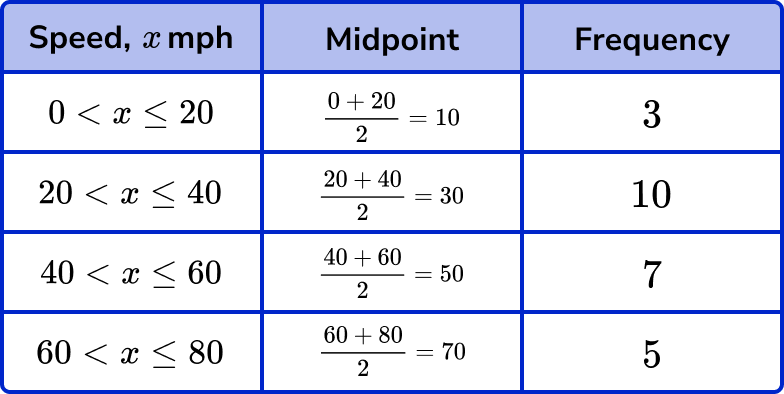
The midpoints are the x -coordinate and the frequencies are the y -coordinate.
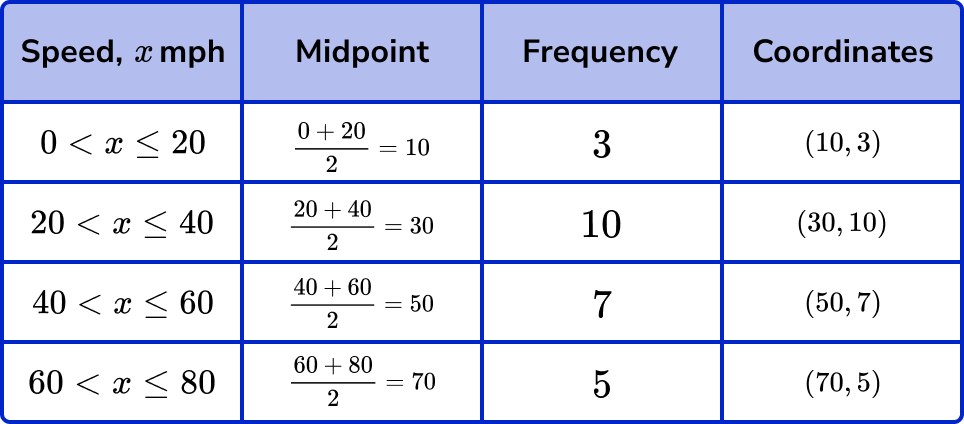
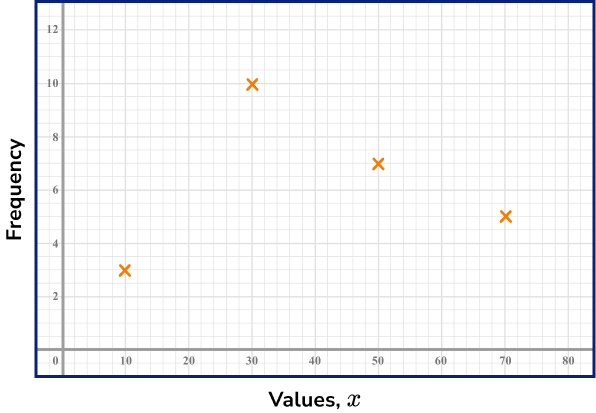
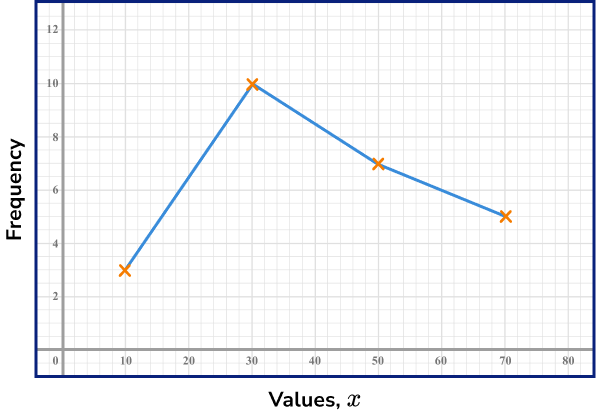
Join the first point to the second point with a straight line. Keep joining the points in order with straight lines.
Example 4: worded problem
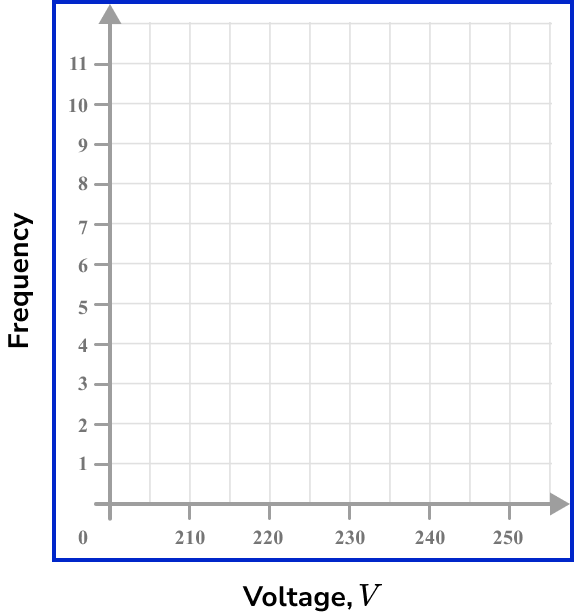
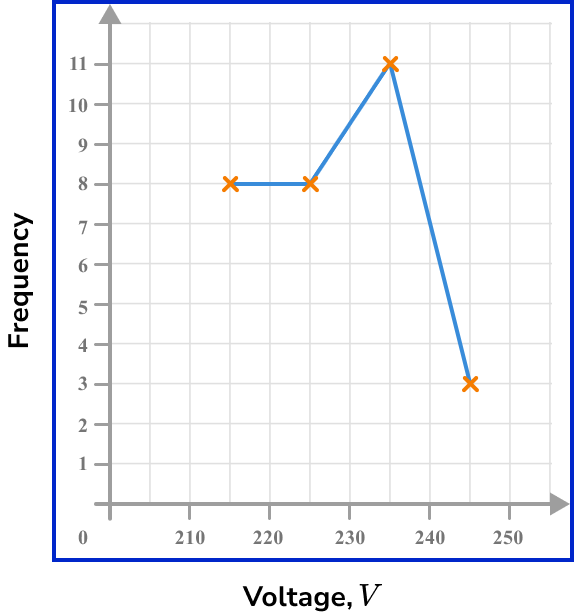
An electrician is measuring the output voltage of plug sockets. He collects the data into groups shown in the table below.
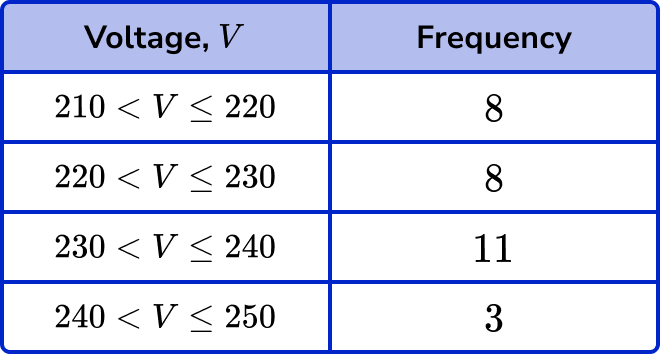
Draw a frequency polygon to represent the data on the set of axes below.
The midpoints can be found by adding the lower limit of the class interval to the upper limit of the class interval and dividing by 2 .
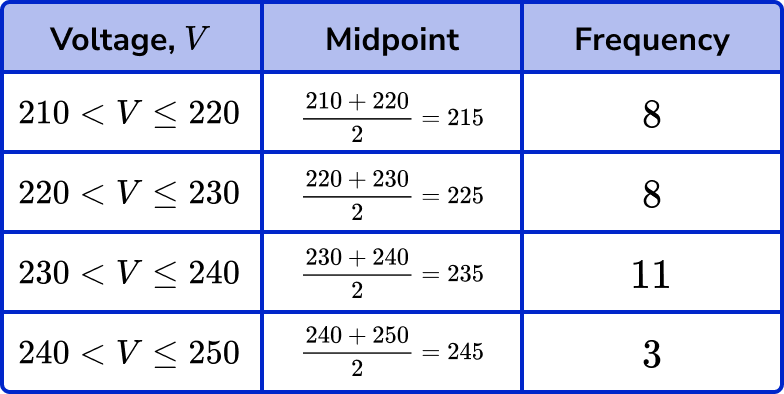
The midpoints are the x -coordinate and the frequencies are the y -coordinate.
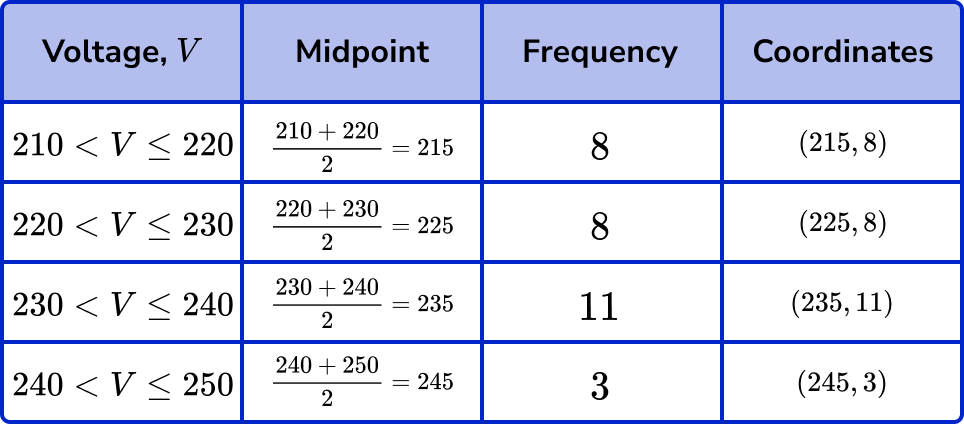
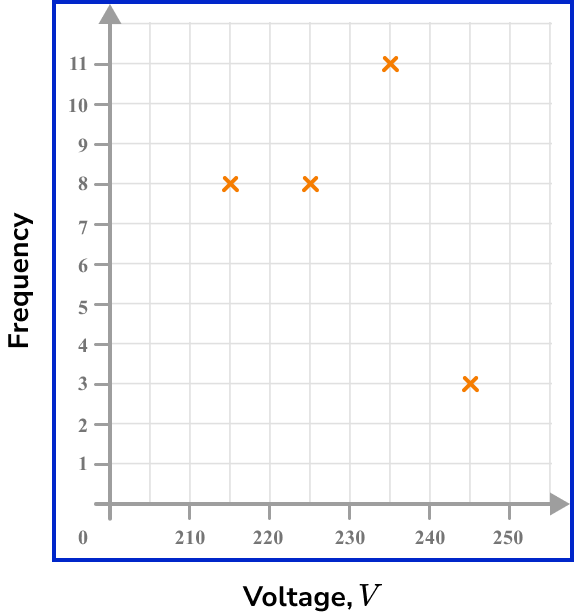
Join the first point to the second point with a straight line. Keep joining the points in order with straight lines.
Example 5: standard problem – 5 rows
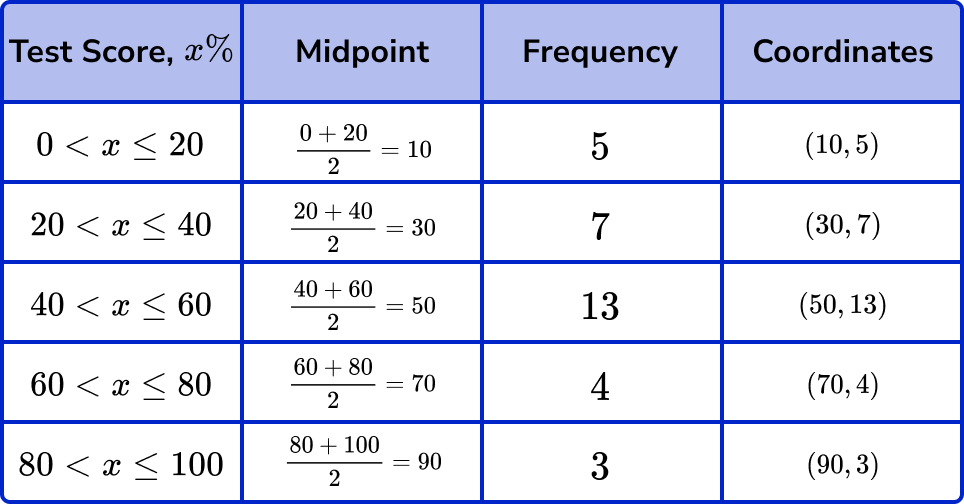
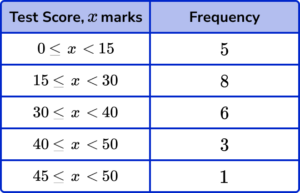
Data for the test score as a percentage is given in the table below.
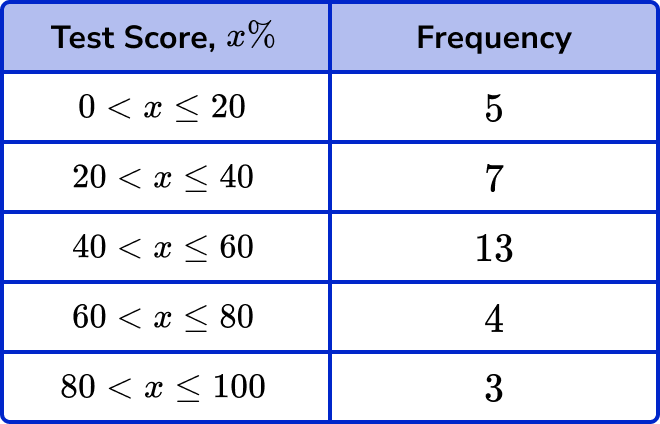
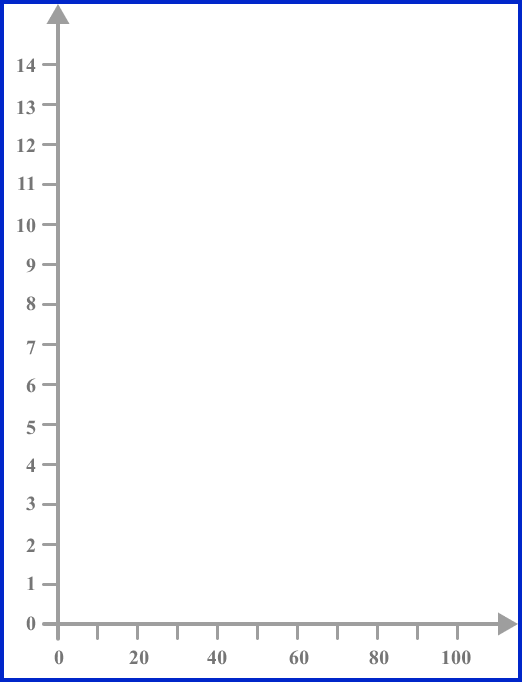
Use the set of axes below to draw a frequency polygon for the data. Label each axis.
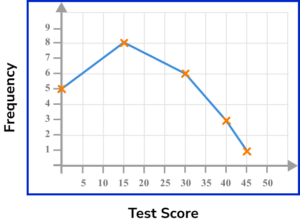
The midpoints can be found by adding the lower limit of the class interval to the upper limit of the class interval and dividing by 2 .
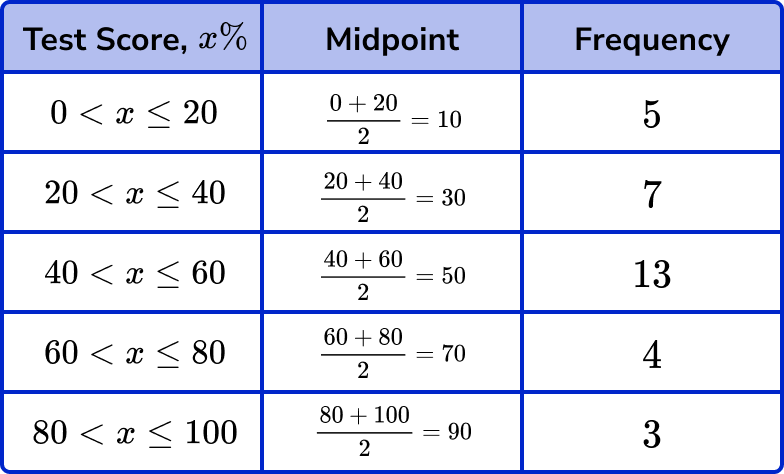
The midpoints are the x -coordinate and the frequencies are the y -coordinate.
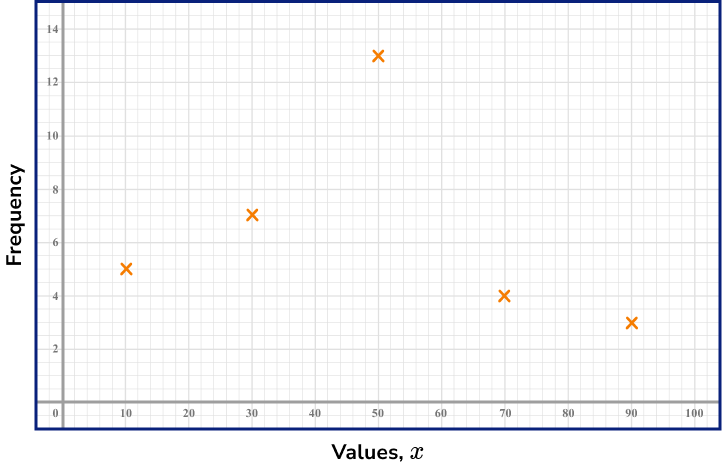
Don’t forget to label the axes titles as well.
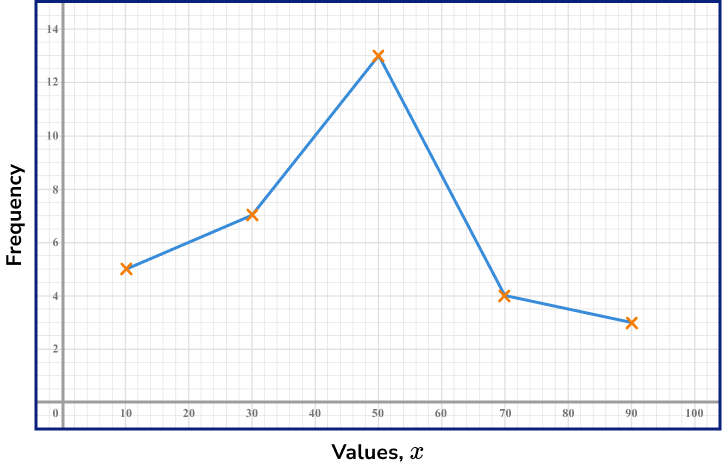
Join the first point to the second point with a straight line. Keep joining the points in order with straight lines.
Example 6: different class intervals
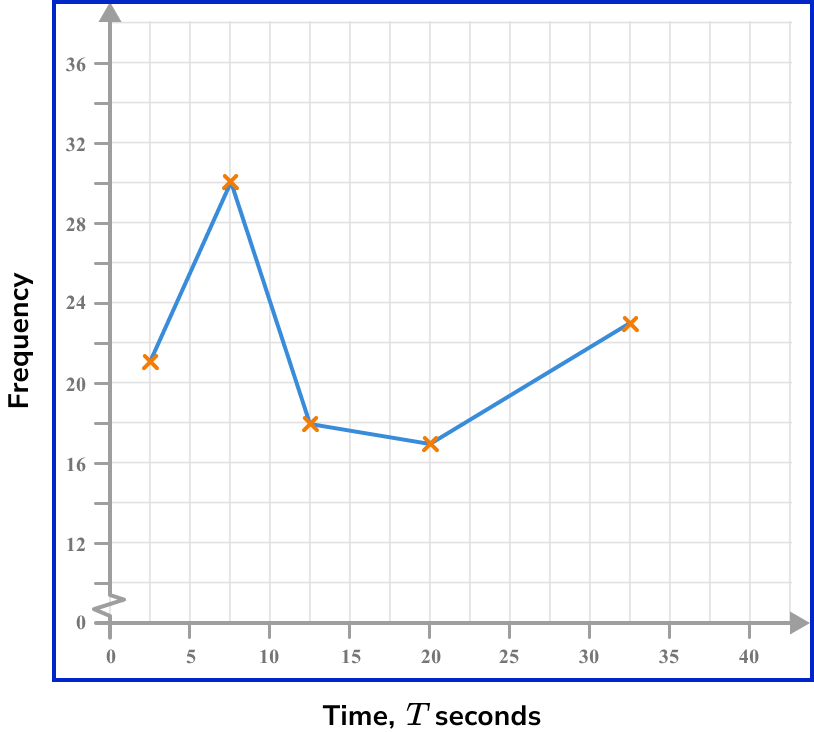
The time T seconds for a raft of penguins to dive into water from a ledge was recorded in a grouped frequency table below. Draw a frequency polygon on the axes below for the following grouped data.
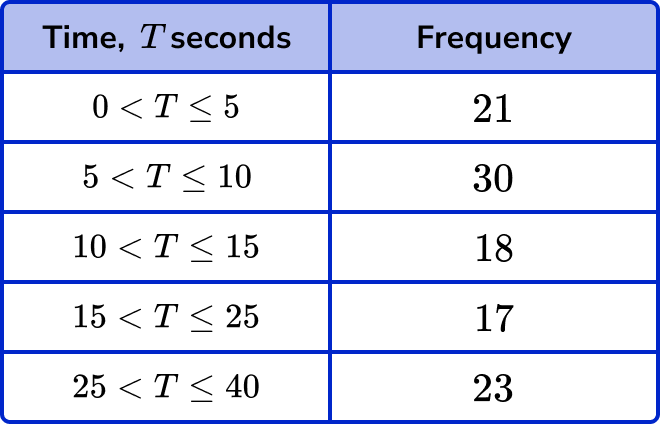
The midpoints can be found by adding the lower limit of the class interval to the upper limit of the class interval and dividing by 2 .
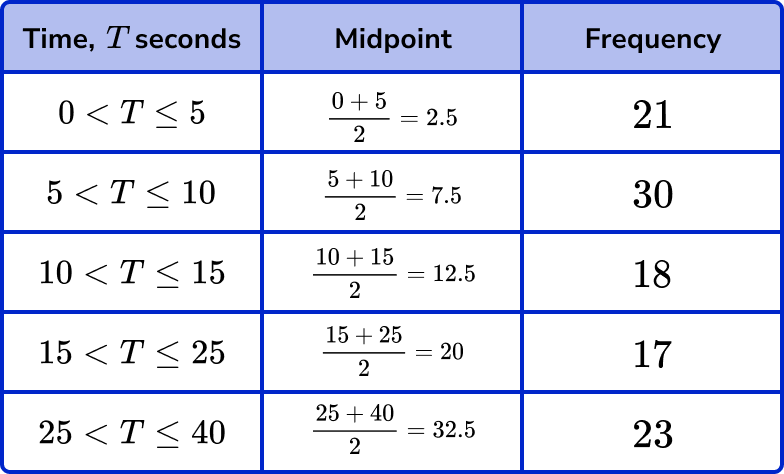
The midpoints are the x -coordinate and the frequencies are the y -coordinate.
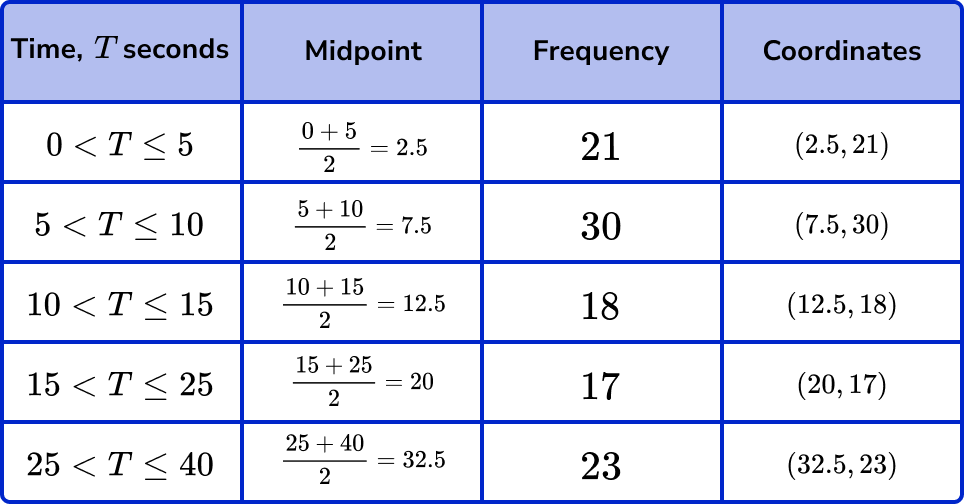
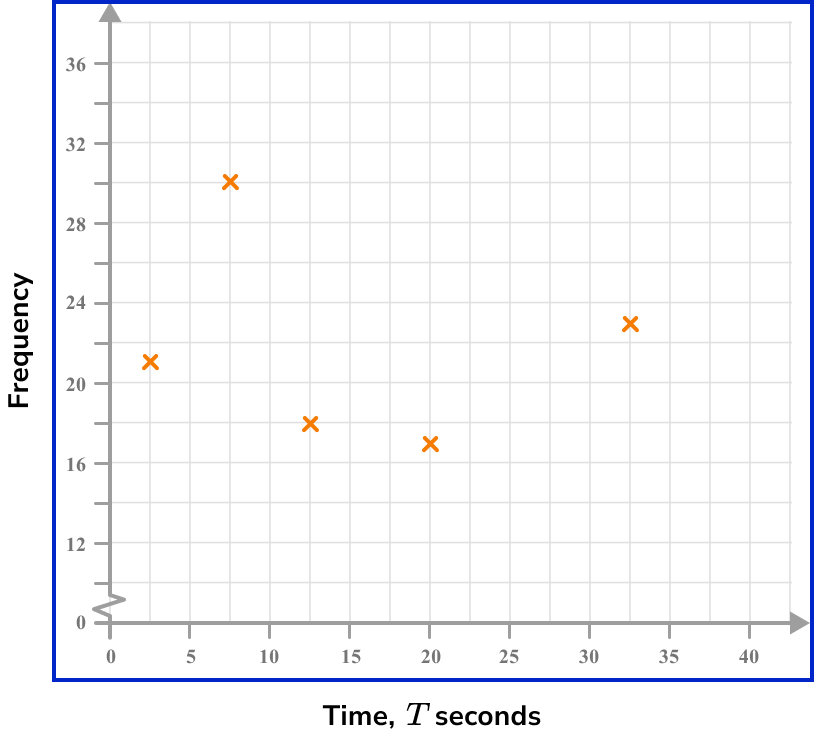
Join the first point to the second point with a straight line. Keep joining the points in order with straight lines.
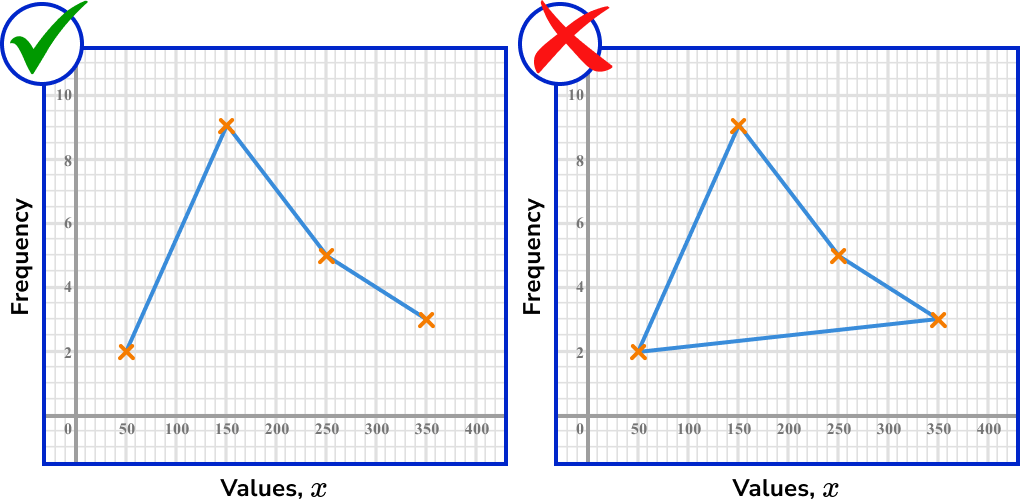
Common misconceptions
- Joining the points
Do not join the last point to the first point.
- Using the endpoints, not the midpoints
The coordinate must be plotted at the centre of each class interval, at the given frequency.
- Frequencies are whole numbers
Since frequencies are a count of how many times an item occurs, they will always be integers. They are not decimals. The midpoint can be a decimal.
- Straight line segments only
The coordinates of a frequency polygon are joined using a straight line segment. Do not connect them using freehand or draw them curved like a cumulative frequency curve; they should be drawn using a ruler!
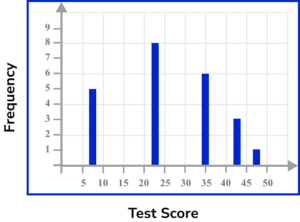
- The graph is not a frequency polygon
A frequency polygon is a specific type of frequency diagram. Do not draw a bar chart or a vertical line diagram – they are not distinctly frequency polygons.
Practice frequency polygon questions
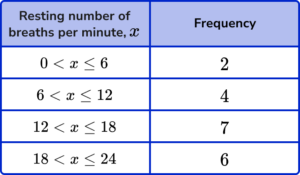
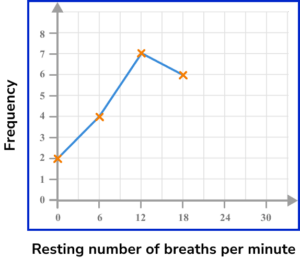
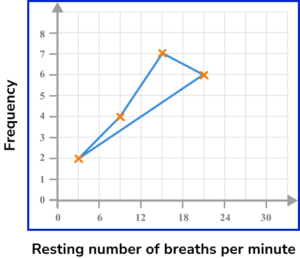
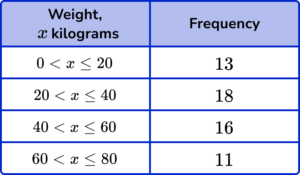
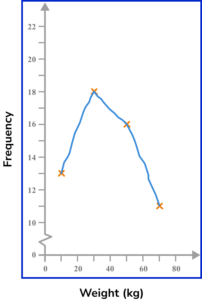
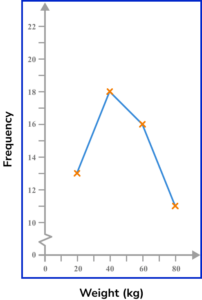
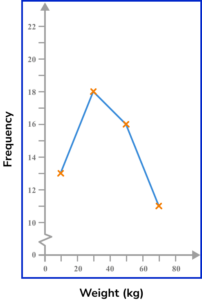
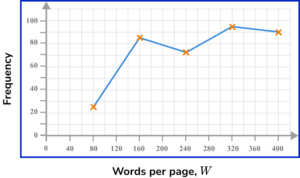
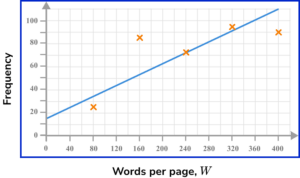
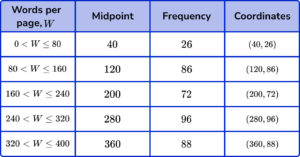
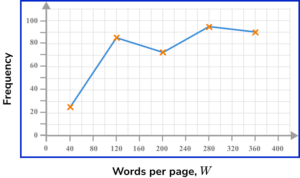
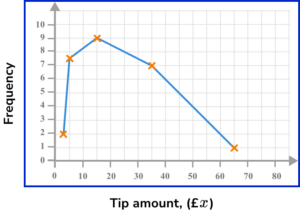
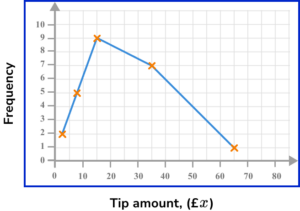
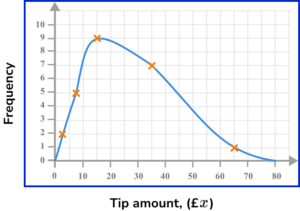
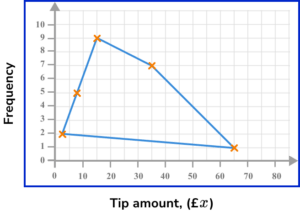
1. Which is the correct frequency polygon for the grouped frequency table?
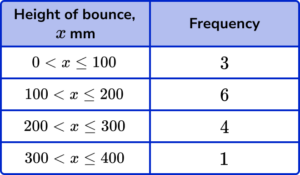
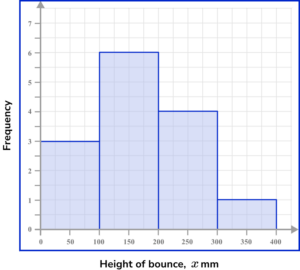

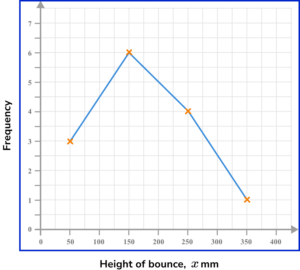

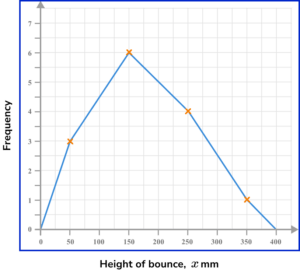
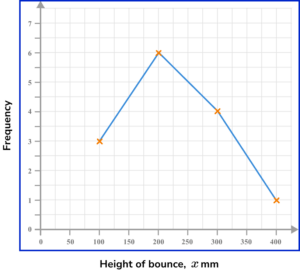
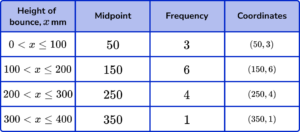
Plotting the coordinates and joining them with straight line segments, we get
2. Which is the correct frequency polygon for the grouped frequency table?
Plotting the coordinates and connecting them using straight line segments, we get
3. Which is the correct frequency polygon for the grouped frequency table?
These coordinates need joining up with straight line segments to achieve the solution.
4. Which is the correct frequency polygon for the grouped frequency table?

These coordinates need joining up with straight line segments to get the solution.
5. Which is the correct frequency polygon for the grouped frequency table?
Each coordinate is to be plotted and connected with a straight line segment to the next coordinate.
6. Which is the correct frequency polygon for the grouped frequency table?
These need joining up with straight line segments to get the solution.
Frequency polygon GCSE questions
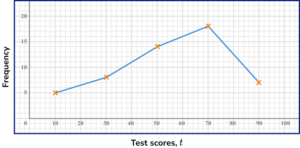
1. The frequency table shows some information about 54 test scores.

On the grid, draw a frequency polygon for the information in the table.
(3 marks)
Midpoints: 10, 30, 50, 70 and 90.
(1)
All coordinates plotted accurately.
(1)
All coordinates connected with a straight line segment.
(1)
2. A farmer weighs 50 potatoes.
The frequency table shows the information.

On the grid, draw a frequency polygon for the information in the table.

(3 marks)
Midpoints: 20, 40, 60, 80 and 100.
(1)
All coordinates plotted accurately.
(1)
All coordinates connected with a straight line segment.
(1)
3. The frequency table shows some information about the heights of 80 plants.
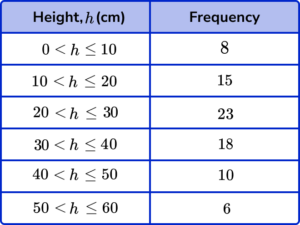
On the grid, draw a frequency polygon for the information in the table.
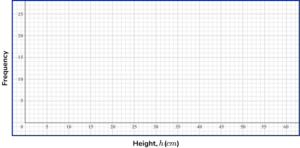
(3 marks)
Midpoints: 5, 15, 25, 35, 45 and 55.
(1)
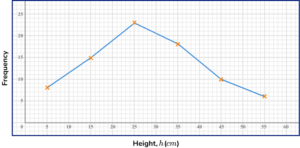
All coordinates plotted accurately.
(1)
All coordinates connected with a straight line segment.
(1)
Learning checklist
You have now learned how to:
The next lessons are
Still stuck?
Prepare your KS4 students for maths GCSEs success with Third Space Learning. Weekly online one to one GCSE maths revision lessons delivered by expert maths tutors.

Find out more about our GCSE maths tuition programme.