
Free Place Value Charts For KS1 And KS2: Printable Charts By Year Group

Ask a class to write 3,472 into a place value chart and you find out quickly who understands the number system and who is copying digits into boxes. A place value chart makes the value of each digit visible, so a pupil can see that the 3 is worth 3,000 rather than reading it as the first digit they happened to write.
That visibility is why place value charts appear in primary maths lessons from Year 1 through to Year 6, and why teachers need printable versions they can hand out on a Monday morning.
In this article, you will find a place value chart for every year group, from tens and ones in Year 1 to hundred thousands and millions in Year 6, along with blank charts your class can fill in themselves.

Free Place Value Charts
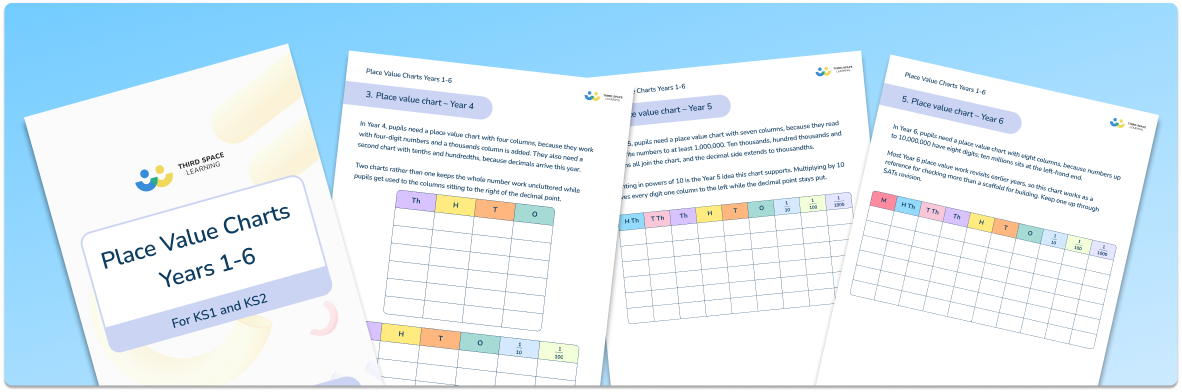
Download these free, printable ready-to-use place value charts for Years 1-6. Each chart explains its columns so that you can see the progression across the school.
Download Free Now!What is a place value chart?
A place value chart is a table that organises digits into columns, where each column represents a different value. Reading from right to left, the place value columns run ones, tens, hundreds, thousands, ten thousands, hundred thousands and millions. Each column is worth 10 × the column to its right.
The place value chart shows the value of each digit based on its position. In 3,472, the 3 sits in the thousands column and represents 3,000, the 4 represents 400, the 7 represents 70 and the 2 represents 2.

How a place value chart works
Write one digit per column and the place value chart does the rest of the work. Because the columns are fixed, the same digit takes a different value depending on where it lands. The 5 in 25 is worth 5, while the 5 in 52 is worth 50.
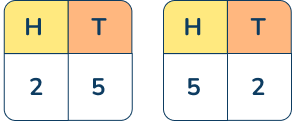
This is what makes a place value chart useful for comparing numbers. Two numbers written into the same chart line up column by column, so pupils can compare digits in the hundreds place before looking at anything else.
What value each column represents
| Column | Value |
| Millions | 1,000,000 |
| Hundred thousands | 100,000 |
| Ten thousands | 10,000 |
| Thousands | 1,000 |
| Hundreds | 100 |
| Tens | 10 |
| Ones | 1 |
Columns to the right of the decimal point continue the same pattern. Tenths are worth 1/10 of one whole, hundredths 1/100, and each step right divides the previous column by 10.
Free printable place value charts
Every place value chart on this page is free to download as a PDF, ready to print for whole class teaching or independent practice.
The pack covers place value charts for year groups 1-6, with completed reference charts and blank versions of each. Print at A4 for independent practice, or at A3 for a working wall.
Types of place value chart
Not every class needs the same chart. The columns you show depend on the numbers your pupils are working with, and showing too many at once makes the chart harder to read.
KS1 place value chart: tens and ones
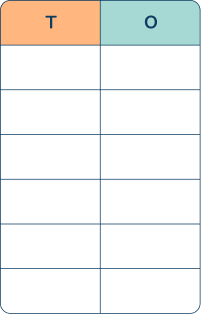
A KS1 place value chart shows two columns, tens and ones. Year 1 and Year 2 pupils work with numbers to 100, so a tens and ones chart covers everything they need without extra columns to ignore.
Pair it with place value counters or base 10 blocks and pupils can build a number physically before writing it down.
KS2 place value chart: hundreds, tens and ones and beyond
From Year 3 as place value teaching at KS2 moves past 100, the chart grows.. A hundreds, tens and ones chart carries Year 3 pupils through numbers to 1,000, and further columns get added each year until Year 6 pupils are reading numbers up to ten million.
Decimal place value chart
A decimal place value chart adds columns to the right of the decimal point for tenths, hundredths and thousandths. Year 4 pupils meet tenths and hundredths, and a decimal place value chart shows them that decimals follow the pattern they already know.
Gattegno place value chart
A Gattegno chart takes a different approach. Each row shows the multiples of one power of ten, so the top row runs 1 to 9, the row below runs 10 to 90, the next 100 to 900, and so on.
Pupils build a number by pointing at one digit in each row. Moving up or down a row multiplies or divides by 10, which makes the relationship between columns something pupils can see and say rather than memorise.
Place value charts by year group
The columns a class needs change each year as the numbers get bigger. These charts follow the place value national curriculum for each year group, so you can hand out the right one without editing anything.
Year 1 place value chart
Year 1 pupils count, read and write numbers to 100 and identify one more and one less. A tens and ones chart gives them two columns and nothing else to think about.
Use it alongside base 10 blocks or a tens frame so pupils build the number before writing it. Ten ones make one ten, and the chart shows where that ten belongs.
Year 2 place value chart
By Year 2 pupils recognise the place value of each digit in a two digit number and compare numbers from 0 to 100. The same tens and ones chart carries them through the year.
Ask pupils to write two numbers into separate charts, then compare the tens column first. This builds the habit of comparing by place rather than by the digits that look biggest.
Year 3 place value chart
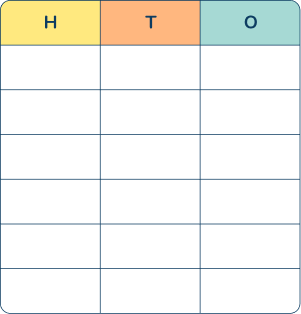
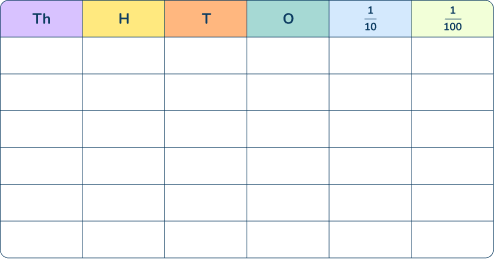
Year 3 introduces the hundreds column. Pupils recognise the place value of each digit in a three digit number and read and write numbers up to 1,000.
A hundreds, tens and ones chart is the one your class will use most this year. Partitioning 472 into 400 + 70 + 2 becomes straightforward once the columns are in front of them.
Year 4 place value chart
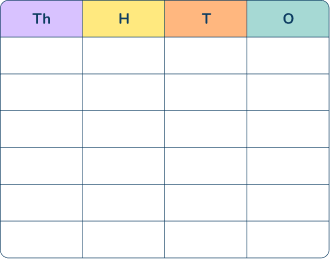
Year 4 pupils work with four digit numbers, so the thousands column joins the chart. They also round to the nearest 10, 100 or 1,000, and rounding is easier to explain with the columns visible.
Tenths and hundredths arrive this year too, which is where a decimal place value chart starts to earn its place.
Year 5 place value chart
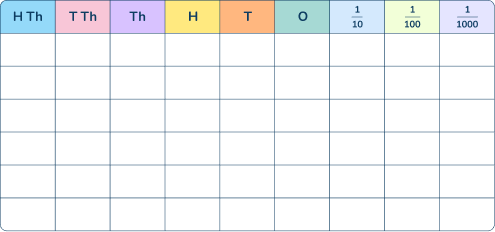
Year 5 takes pupils to at least 1,000,000, so the chart now needs ten thousands and hundred thousands columns. Pupils count forwards and backwards in powers of 10 and round to the nearest 100,000.
Moving a digit one column left multiplies it by 10. Showing this on the chart heads off the common misconception about adding zeros.
Year 6 place value chart
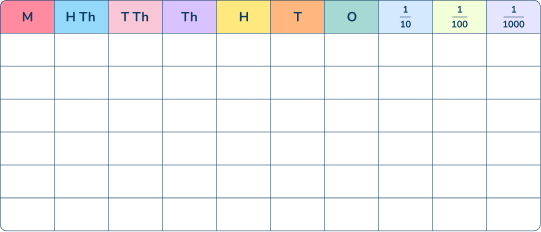
Year 6 pupils read, write, order and compare numbers up to 10,000,000 and determine the value of each digit. The millions column completes the whole number side of the chart.
Most Year 6 place value work is consolidation rather than new content, so the chart becomes a reference tool for checking rather than a scaffold for building. Pupils still working below the millions column need targeted place value intervention, not more chart practice.
Year 7, 8, 9 and GCSE place value chart
Place value does not stop at Year 6. KS3 pupils use it for decimals, measures and integers of any size, and it holds up standard form, rounding and estimation at GCSE. A gap left in primary tends to surface again in KS3 and GCSE place value questions.
Blank place value charts
A blank place value chart gives pupils the columns and nothing else. They label the headings themselves, which turns the chart from something they read into something they have to think about.
Blank charts work well for independent practice and for quick assessment alongside place value worksheets. Ask pupils to label the columns from memory and you learn quickly who has secured the order and who is guessing.
Laminate a set and they last the year. Pupils write on them with a whiteboard pen, rub out and start again.
Place value charts and White Rose Maths
Schools following White Rose Maths meet place value in Autumn Block 1 in every year group from Year 1 to Year 6. The charts here use the same column headings and the same representations, so they sit alongside the scheme without needing adapting.
White Rose sequences place value before addition and subtraction for a reason. Pupils who can say what each digit is worth find columnar methods far less mysterious when they arrive a few weeks later.
Place value charts vs place value grids
The two terms get used interchangeably, and in most classrooms that causes no problems. Where they differ is in what pupils do with them.
A place value chart shows the value of each digit by position. It works as a reference for whole class teaching and for pupils checking their own work.
A place value grid is built for handling numbers. Pupils place counters into the columns, exchange ten ones for one ten, and physically move digits when multiplying or dividing by 10. The grid suits hands on practice with the four operations.
Most classes use both.
How to use a place value chart in class
A chart on the wall does little on its own. These are the three routines that get the most out of one.
Whole class teaching
Display one chart and build numbers together. Call a number, ask pupils which column each digit belongs in, then write it up. Reading the number back in words alongside the chart connects word form to the digits, which supports pupils who can say “four thousand two hundred” but write 40,200.
Independent practice
Give each pupil a chart and a set of numbers to write in. Follow it with a comparing task: two numbers per chart, decide which is larger, and say which column settled it.
Expanded form fits here as well , and it runs on the same thinking as the part whole model pupils met in KS1. Once 3,472 is in the chart, writing 3,000 + 400 + 70 + 2 is a short step.
Using place value counters
Place value counters turn the chart into something pupils can handle. Ten counters in the ones column get exchanged for one counter in the tens, which shows what regrouping actually means.
This works well before columnar addition and subtraction, where pupils who have exchanged counters physically tend to carry and borrow with more confidence.
Common place value misconceptions
Two misconceptions come up in almost every class, and a place value chart addresses both.
Multiplying by 10 moves the digits
Pupils taught to “add a zero” hit trouble the moment decimals arrive, because 4.5 × 10 is not 4.50.
Show it on the chart instead. Multiplying by 10 moves every digit one column to the left, and the zero appears because the ones column is now empty. Pupils who learn the movement handle decimals without relearning anything.
Misaligning digits in a chart
Pupils who write 342 and 42 without aligning the columns often compare the wrong digits. Writing both into a chart forces the alignment, so the hundreds column sits above the hundreds column.
The same habit prevents errors in columnar addition, where one misaligned digit changes the answer by a factor of 10 or more.
Pathing the way for mathematical concepts
Place value underpins almost everything that follows it in primary maths. Columnar addition, rounding, decimals, comparing and ordering all rest on pupils knowing what each digit is worth.
Print the chart for your year group, keep a blank set laminated for independent practice, and pull them out again whenever a new column arrives. They tend to earn their space on the wall.
Place value chart FAQs
Draw one column for each place value, working right to left from ones, tens and hundreds up to the largest value your number needs. Write one digit per column, starting from the right. The chart then shows what each digit is worth by the column it sits in.
Move pupils through concrete, pictorial and abstract representations rather than starting with digits on a page. Base 10 blocks, place value counters and arrow cards let children see what each column is worth. Maths games work well too: roll three dice and make the largest number you can.
Place value means the value of a digit depends on where it sits in a number. In 452, the 4 is worth 400, the 5 is worth 50 and the 2 is worth 2. Each column is worth 10 × the column to its right.
A place value chart is a table that organises digits into columns, where each column represents a power of ten. It shows the value of each digit by position, and pupils use it to read, write, compare and order numbers.
Find which column the digit sits in, then multiply the digit by that column’s value. In 3,472 the 4 sits in the hundreds column, so its value is 4 × 100 = 400. The digit itself never changes, only the column it occupies.
Place value is the value a digit takes from its position in a number. In 25 the 2 is worth 20. In 250 the same 2 is worth 200. In 2,500 it is worth 2,000. The digit stays the same while its value multiplies by 10 with each move left.



![Closing the Disadvantage Gap in Primary Maths: Two Schools, Two Approaches [Webinar]](https://thirdspacelearning.com/wp-content/uploads/2026/06/Screenshot-2026-06-17-at-09.31.13-1024x575.png)