

Place Value Chart: Free Printable Charts For Kindergarten To 5th Grade

Ask a class to write 3,472 into a place value chart and you find out quickly who understands the number system and who is copying digits into boxes. A place value chart makes the value of each digit visible, so a student can see that the 3 is worth 3,000 rather than reading it as the first digit they happened to write.
That visibility is why place value charts turn up in elementary math lessons from kindergarten through 5th grade, and why teachers need printable versions they can hand out on a Monday morning.
In this article you’ll find a place value chart for every grade, from tens and ones in kindergarten to thousandths in 5th grade, along with blank charts your class can fill in themselves.

Place Value Chart Printable
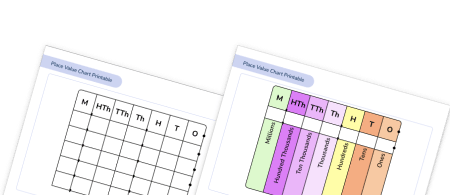
Hand out to all your students to use as a classroom aid or for scaffolding more challenging questions.
Download Free Now!What is a place value chart?
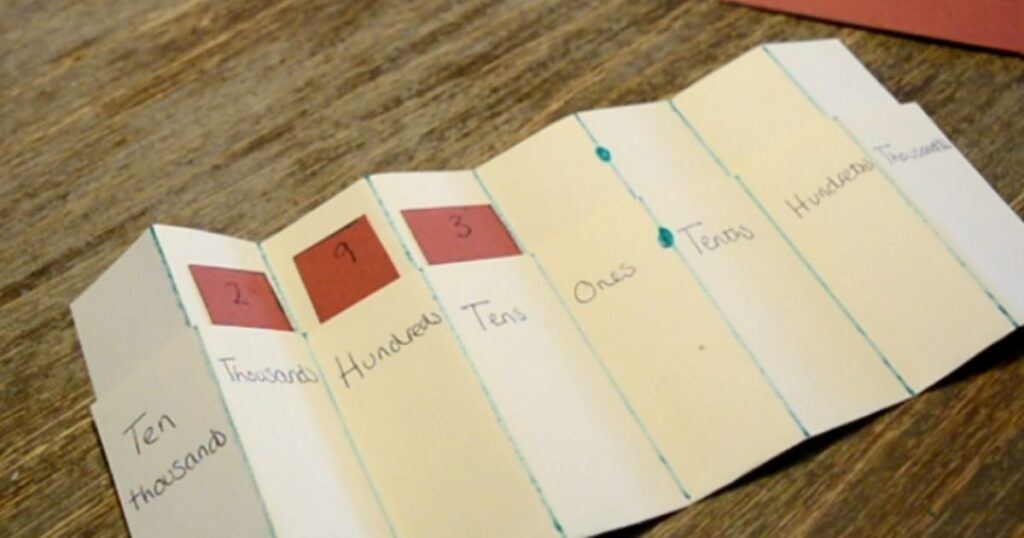
A place value chart is a table that organizes digits into columns, where each column represents a different value. Reading from right to left, the place value columns run ones, tens, hundreds, thousands, ten thousands, hundred thousands and millions. Each column is worth 10 x the column to its right.
Understanding place value starts here. The chart shows what each digit is worth from where it sits, so in 3,472 the 3 is in the thousands place and represents 3,000, the 4 represents 400, the 7 represents 70 and the 2 represents 2.

How a place value chart works
Write one digit per column and the chart does the rest of the work. The columns are fixed, so the same digit takes a different value depending on where it lands. The 5 in 25 is worth 5, while the 5 in 52 is worth 50.
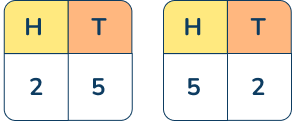
That’s what makes a chart useful for comparing numbers. Two numbers written into the same chart line up column by column, so students can compare the digits in the hundreds place before looking at anything else.
What each column is worth
| Column | Value |
|---|---|
| Millions | 1,000,000 |
| Hundred thousands | 100,000 |
| Ten thousands | 10,000 |
| Thousands | 1,000 |
| Hundreds | 100 |
| Tens | 10 |
| Ones | 1 |
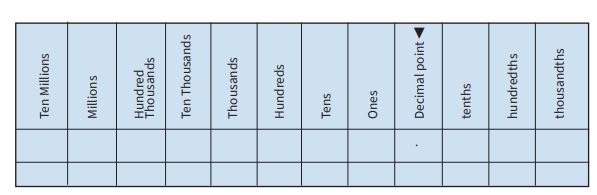
The millions column is as far as an elementary chart usually goes, and most classes meet millions in 4th grade. Columns to the right of the decimal point carry on the same pattern: tenths are worth 1/10 of one whole, hundredths 1/100, and each step right divides the previous column by 10.
US teachers and state standards use the place names when they talk about a digit. Reading left to right on a full elementary chart, that’s the millions place, the hundred thousands place, the ten thousands place, the thousands place, the hundreds place, the tens place and the ones place, then past the decimal point the tenths place, the hundredths place and the thousandths place.
You need both words. “Column” describes the chart, so it’s the word you use when you’re pointing at it. “Place” is where the digit sits, and that’s the word a student needs when they explain their answer. Students who use both can usually tell you what a digit is worth without the chart in front of them.
Free printable place value charts
Every chart on this page is a free PDF with the columns already set, so you can print it and hand it straight to a class. Our printable place value chart prints at letter size for independent practice, or at tabloid for an anchor chart.
What you get in the free place value chart printable:
- A whole number chart running from the ones place up to the millions place
- A decimal chart carrying on to the tenths, hundredths and thousandths place
- Blank versions of both, for labeling from memory
Once a class can fill a chart in, worksheets are the natural next step. Our place value worksheets pair with these charts, and our math resources library has more classroom resources: worksheets, number charts and printable place value charts for every grade. There’s no sign-up, so the PDF downloads when you click.
Why use a place value chart?
A place value chart is the one visual aid that keeps working from kindergarten through 5th grade and past it. The numbers get bigger and the columns get added, but the chart on the wall stays the same.
In class you’ll use it for three things:
- Finding the value of any digit in a number
- Rounding, because students can see the place they’re rounding to
- Multiplying and dividing by 10, 100 and 1,000, where the digits move and the chart shows where they land
Multiplying and dividing is the one most teachers come back to. Students who have watched the digits move across a chart are reasoning about the number system rather than recalling a rule, and that carries over to big numbers and to decimals, and eventually to the millions place.
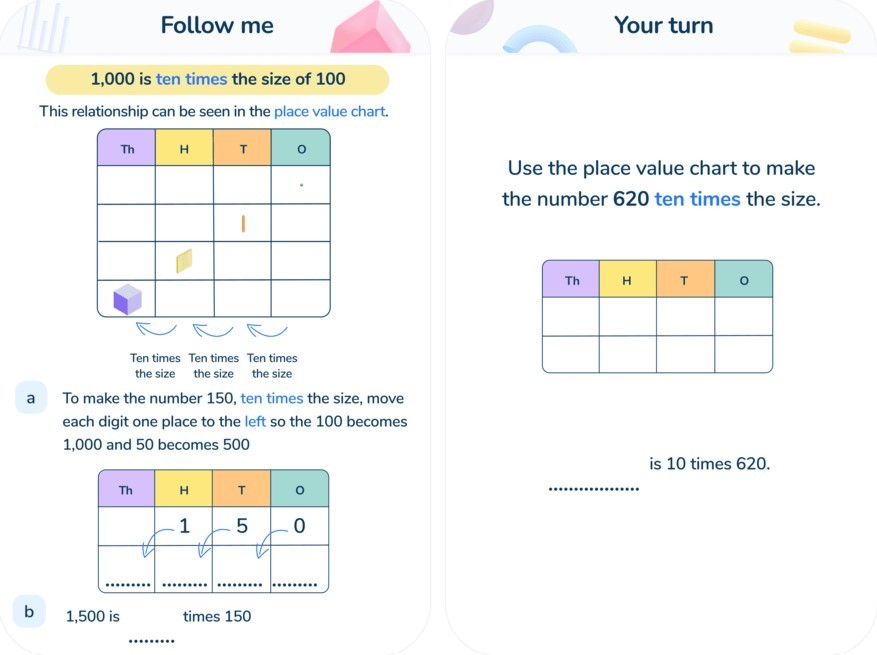
It also builds the understanding that different place values are related to each other: ten of one place makes one of the next, in both directions.
Types of place value chart
Not every class needs the same chart. The columns you show depend on the numbers your students are working with, and showing too many at once makes the chart harder to read. These are the four you’ll actually use when teaching place value.
Early elementary place value chart: tens and ones
An early elementary chart shows two columns, tens and ones. Kindergarten and 1st grade students work with numbers to 100, so two columns cover everything they need without extra places to ignore.
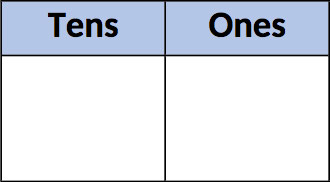
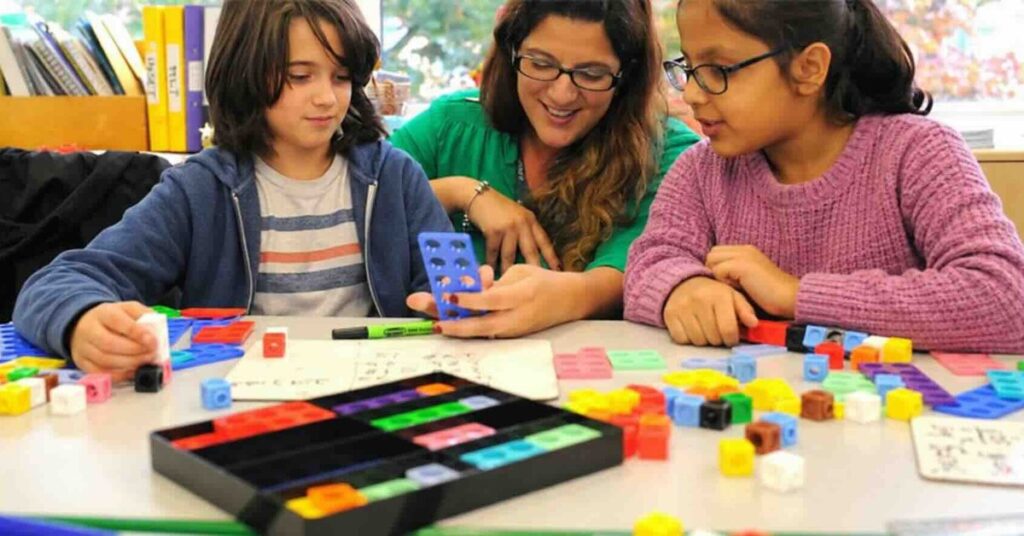
If you pair it with place value counters or base ten blocks, students can build a number physically before they write it down.
Upper elementary place value chart: hundreds, tens and ones and beyond
As place value teaching moves past 100, the chart grows. A hundreds, tens and ones chart carries 2nd grade students through numbers to 1,000. Thousands arrive in 3rd grade, the whole number columns reach 1,000,000 by 4th grade, and in 5th grade the chart extends the other way, to thousandths.
Charts that include decimals
Some charts carry on past the ones column, adding tenths, hundredths and thousandths to the right of the decimal point. 4th grade students meet tenths and hundredths for the first time here. There’s a full section on decimal charts below.
Gattegno place value chart
A Gattegno chart takes a different approach. Each row shows the multiples of one power of ten, so the top row runs 1 to 9, the row below runs 10 to 90, the next 100 to 900, and so on.
Students build a number by pointing at one digit in each row. Moving up or down a row multiplies or divides by 10, which makes the relationship between columns something students can see and say rather than memorize.
Decimal place value chart
A decimal place value chart carries on to the right of the decimal point. It runs tenths, then hundredths, then thousandths, and each one is worth a tenth of the place to its left. Decimal place values work exactly like whole number ones, but plenty of students meet decimal numbers and decide they don’t.
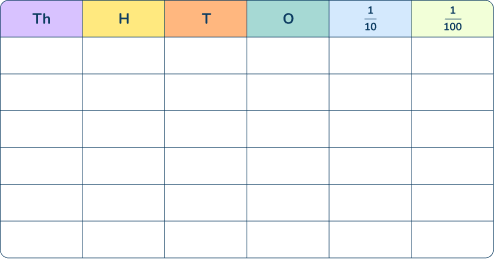
What the decimal columns are worth
| Column | Value | As a decimal |
|---|---|---|
| Ones | 1 | 1 |
| Tenths | 1/10 | 0.1 |
| Hundredths | 1/100 | 0.01 |
| Thousandths | 1/1000 | 0.001 |
The decimal point marks where the whole numbers stop. The chart is built around the ones column, which is what students should be reading from. Students who treat the point as the center of the chart misread everything to the right of it, and it shows up later in every decimal comparison they do.
4th grade students work with tenths and hundredths. Thousandths arrive in 5th grade, alongside the idea that a digit is worth ten times the place to its right and one tenth of the place to its left, in both directions from the decimal point. That’s decimal place value, and the chart is what makes it visible.
Comparing decimals with a chart
Take a straightforward example. Ask a class which is larger, 0.47 or 0.5, and a good number of them will say 0.47 because 47 is bigger than 5. If you write both into the same chart, 5 tenths sits above 4 tenths and the tenths column has already answered it.
Comparing decimals digit by digit from the left only works when the columns line up, which is what the chart does for you.
Writing 0.5 as 0.50 in the chart helps here too. The hundredths column is empty either way, and seeing that empty column is usually what convinces a student the two are the same number.
Multiplying and dividing decimals by 10, 100 and 1,000
Multiplying by 10 moves every digit one column to the left. Dividing by 10 moves every digit one column to the right. The decimal point doesn’t move, and neither does the chart.
This matters because it’s the same movement students already learned with whole numbers. If you teach it as “move the decimal point”, students end up with a second rule that contradicts the first one they learned. On the chart, 4.5 x 10 = 45 is the same piece of thinking as 45 x 10 = 450, so multiplying and dividing decimals doesn’t become a separate topic.
Blank decimal place value charts are worth keeping laminated for this. Students write the number in, move each digit one column then read the answer back. Our printable decimal place value chart is free to download and set up for exactly that.
Place value charts by grade level
The columns a class needs change each year as the numbers get bigger. These charts follow the Common Core place value expectations for each grade, so you can hand out the right one without editing anything.
Kindergarten place value chart
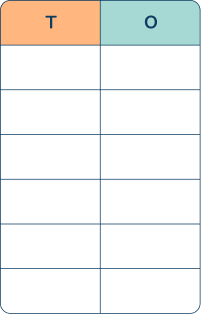
Kindergarten students count to 100 by ones and by tens, and work with the numbers 11 to 19 as a ten and some ones. Two columns give them the tens place and the ones place, and nothing else to think about.
Use it alongside base ten blocks or a ten frame so students build the number before writing it. Ten ones make one ten, and the chart shows where that ten belongs.
1st grade place value chart
By 1st grade students understand that the two digits of a two-digit number are tens and ones, and compare two-digit numbers using the greater than, less than and equal to symbols. The same two-column chart carries them through the year.
Ask students to write two numbers into separate charts, then compare the tens column first. That builds the habit of comparing by place rather than by the digits that look biggest.
2nd grade place value chart
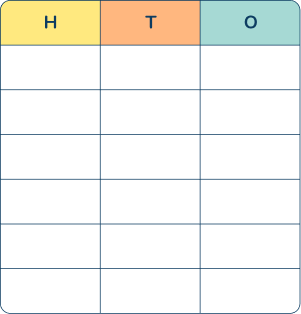
2nd grade introduces the hundreds column. Students understand that the three digits of a three-digit number are hundreds, tens and ones, and read, write and compare numbers to 1,000. A number like 706 is the one to use here, because the zero is doing real work.
A hundreds, tens and ones chart is the one your class will use most this year. Decomposing 472 into 400 + 70 + 2 becomes straightforward once the columns are in front of them.
3rd grade place value chart
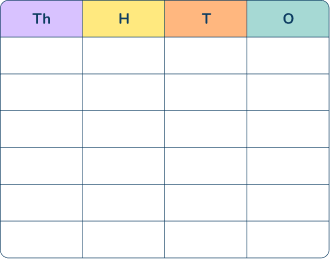
3rd grade students round to the nearest 10 and 100, and multiply one-digit numbers by multiples of 10. Both are easier to explain with the columns visible: 3 x 40 is 3 x 4 tens, and the chart shows where those tens land.
The thousands column joins the chart here, which is usually the first time a class needs more than three columns at once.
4th grade place value chart
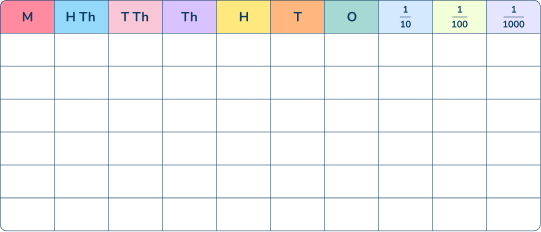
4th grade works with whole numbers up to 1,000,000, so the chart now needs ten thousands and hundred thousands columns. Students recognize that a digit in one place is worth ten times the same digit one place to its right, and round to any place. Tenths and hundredths arrive this year too, which is when a decimal chart starts to be worth printing.
Moving a digit one column left multiplies it by 10. Showing that on the chart heads off the common misconception about adding zeros.
5th grade place value chart
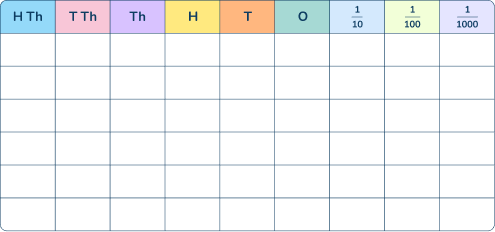
5th grade is where the chart extends to the right, past the tenths place and on to thousandths. Students read, write and compare decimals to thousandths, and explain the patterns in the zeros when they multiply or divide by a power of 10. It’s the hardest concept in the elementary sequence, and the chart is the clearest way through it: students can see the tenths place filling before the hundredths does, and write the expanded form straight off it.
By 5th grade students are using the chart to reason about numbers: a digit is ten times the place to its right and one tenth of the place to its left, in both directions from the decimal point. Students who are still unsure what the hundreds place is worth need targeted place value intervention before more chart practice will help.
Middle school place value chart
Place value doesn’t stop at 5th grade. Middle school students lean on it for operations with decimals, for negative numbers on both sides of zero, and for scientific notation in 8th grade. A gap left in elementary school tends to resurface the first time a student is asked to write 0.00047 in scientific notation.
Blank place value charts
A blank chart gives students the columns and nothing else. They label the headings themselves, which turns the chart from something they read into something they have to think about.
Blank charts work well for independent practice and for quick assessment alongside place value worksheets. Ask students to label the columns from memory and you can see straight away who has the order secure.
Laminate a set and they’ll last the year. Students write on them with a dry-erase marker, erase and start again. Blown up, the same blanks make good anchor charts for big numbers, and a wall chart that already runs to large numbers saves redrawing one every time the class moves up a place.
Place value charts and the Common Core standards
Place value has its own Common Core domain, Number and Operations in Base Ten, and it runs from kindergarten through 5th grade without a break. The charts here use the column headings and representations that domain expects, so they sit alongside whichever curriculum your district has adopted.
Base Ten sits before addition and subtraction in the sequence for a reason, and teaching it in that order is the difference between a method that makes sense and one that has to be memorized. Students who can say what each digit is worth find carrying and regrouping far less mysterious when they arrive.
Place value charts vs place value grids
The two terms get used interchangeably, and in most classrooms that causes no problems. Where they differ is in what students do with them.
A place value chart shows the value of each digit by its position. It works as a reference for whole class teaching and for students checking their own work.
A place value grid is built for handling numbers. Students place counters into the columns, regroup ten ones for one ten, and physically move digits when multiplying or dividing by 10. The grid suits hands-on practice with the four operations, and most classes end up using both.
How to use a place value chart in class
A chart on the wall does little on its own. These are the three routines that get the most out of one.
Whole class teaching
Display one chart and build numbers together. Call a number, ask students which column each digit belongs in, then write it up. Reading the number back in words alongside the chart connects word form to the digits, which supports students who can say “four thousand two hundred” but write 40,200.
Independent practice
Give each student a chart and a set of numbers to write in. The value is in writing the numbers into the columns, so don’t rush students to the answer. Follow it with a comparing task: two numbers per chart, decide which is larger, and say which column settled it.
It’s worth five minutes at the start of a lesson to have students build a number from a clue instead of copying one off the board. Read out something like “I am a three-digit number, my tens digit is one less than my hundreds digit”, and let the class build it in the columns. Building numbers this way gives you more than writing numbers from dictation does, and it needs no extra practice material.
Expanded form fits here as well, and it runs on the same thinking as the part-whole model students met in kindergarten and 1st grade. Once 3,472 is in the chart, writing 3,000 + 400 + 70 + 2 is a short step. If you ask for expanded form alongside the chart for a few weeks, students stop treating it as a separate exercise, and most will read it straight off the chart without being asked.
Using place value counters
Place value counters turn the chart into something students can handle. Ten counters in the ones column get regrouped as one counter in the tens, which shows what regrouping actually means.
This works well before the standard algorithm for addition and subtraction, where students who have regrouped counters physically tend to carry and regroup with more confidence. Regrouping in subtraction is the harder of the two, and the counters are worth leaving out for it.

Meet Skye, the spoken AI math tutor making math success possible for every student.
Built by teachers and math experts, Skye uses the same pedagogy, curriculum and lesson structure as our traditional tutoring.
But, with more flexibility and a low cost, schools can scale online math tutoring to support every student who needs it.
Find out moreCommon place value misconceptions
Two misconceptions come up in almost every class, and a place value chart addresses both.
Multiplying by 10 moves the digits
Students taught to “add a zero” hit trouble the moment decimals arrive, because 4.5 x 10 isn’t 4.50.
Show it on the chart instead. Multiplying by 10 moves every digit one column to the left, and the zero appears because the ones column is now empty. Students who learn the movement handle decimals without relearning anything.
Misaligning digits in a chart
Students who write 342 and 42 without aligning the columns often compare the wrong digits. Writing both into a chart forces the alignment, so the hundreds column sits above the hundreds column.
The same habit prevents errors in the standard algorithm for addition, where one misaligned digit changes the answer by a factor of 10 or more.
Where place value goes next
Place value underpins almost everything that follows it in elementary math. The standard algorithm for addition, rounding, decimals, comparing and ordering all rest on students knowing what each digit is worth.
Print the chart for your grade level, keep a blank set laminated for independent practice, and pull them out again whenever a new column arrives.
Place value chart FAQs
Draw one column for each place value, working right to left from ones, tens and hundreds up to the largest value your number needs. Write one digit per column, starting from the right. The chart then shows what each digit is worth by the column it sits in.
Move students through concrete, representational and abstract representations rather than starting with digits on a page. Base ten blocks, place value counters and place value cards let students see what each column is worth. Math games work well too: roll three dice and make the largest number you can.
Place value means the value of a digit depends on where it sits in a number. In 452, the 4 is worth 400, the 5 is worth 50 and the 2 is worth 2. Each column is worth 10 x the column to its right.
A place value chart is a table that organizes digits into columns, where each column represents a power of ten. It shows the value of each digit by its position, and students use it to read, write, compare and order numbers.
Find which column the digit sits in, then multiply the digit by that column’s value. In 3,472 the 4 sits in the hundreds column, so its value is 4 x 100 = 400. The digit itself never changes, only the column it occupies.
Place value is the value a digit takes from its position in a number, and writing it out that way is called expanded form. In 25 the 2 is worth 20. In 250 the same 2 is worth 200. In 2,500 it’s worth 2,000. The digit stays the same while its value multiplies by 10 with each move left.
Do you have students who need extra support in math?
Skye – our AI math tutor built by experienced teachers – provides students with personalized one-on-one, spoken instruction that helps them master concepts, close skill gaps, and gain confidence.
Since 2013, we’ve delivered 2,295,000 math tutoring sessions to 196,000 students, guiding them toward higher math achievement.
Discover how our AI math tutoring can boost student success, or see how our math programs can support your school’s goals:
– 3rd grade tutoring
– 4th grade tutoring
– 5th grade tutoring
– 6th grade tutoring
– 7th grade tutoring
– 8th grade tutoring