Get Ahead In Foundation GCSE Maths With This Comprehensive Question & Topic Analysis Of Edexcel GCSE Maths Papers [2025 Update]
This article provides a detailed topic and question level analysis of the Foundation Edexcel GCSE Maths papers since 2017 for school leaders and maths teachers leading or teaching Edexcel GCSE Maths.
It may take some digesting so please bookmark and share with colleagues for when you need to refer back.
This article focuses on the Edexcel maths past papers, not AQA or OCR exam boards or IGCSE maths. It’s also just GCSE maths, not Edexcel A-level maths.
GCSE MATHS 2026: STAY UP TO DATE
Join our email list to stay up to date with the latest news, revision lists and resources for GCSE maths 2026. We’re analysing each paper during the course of the 2026 GCSEs in order to identify the key topic areas to focus on for your revision.
GCSE dates 2026
GCSE results (2026 when available)
Get ahead on revision with the GCSE maths papers analysis from 2026:
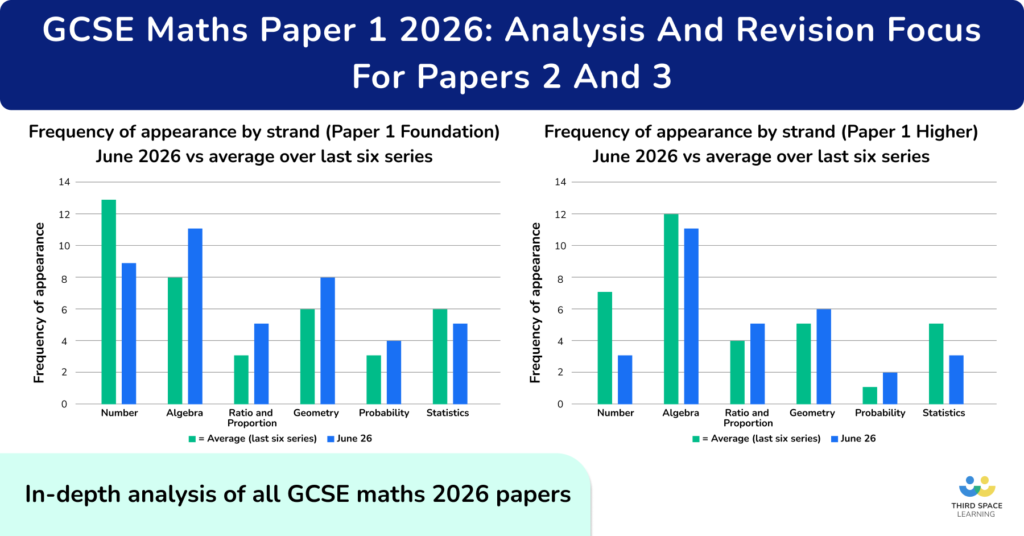
Analysis of GCSE Maths Paper 1 2026
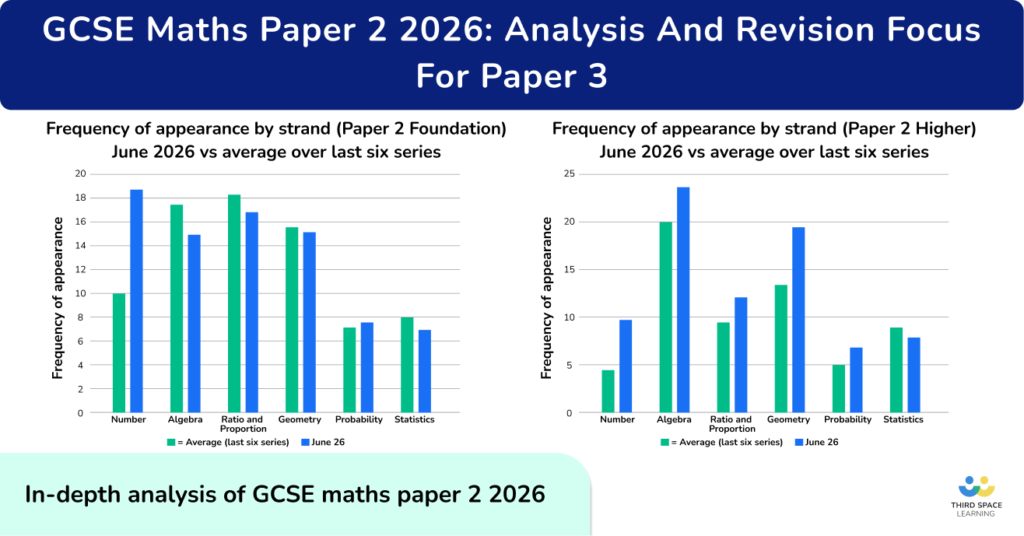
Analysis of GCSE Maths Paper 2 2026
GCSE Maths Paper Analysis and Summary 2025
GCSE Maths Teacher Survey Results 2026

Edexcel Maths Foundation & Higher Papers: Set 5 (2026)
Download these 6 ready-made GCSE practice papers for high-quality exam preparation. The 3 Foundation and 3 Higher tier papers feature unique questions closely matched to Edexcel GCSE maths style and format, written by current and former examiners. Answers and mark schemes included.
Download Free Now!Edexcel maths past paper findings
Later, I’ll go into detail about how this research was conducted. But if you’re short on time, here are my key takeaways from this 2017-2024 Foundation Edexcel past paper analysis. You can read more about each strand later in the article, including:
- Tips for which topics to focus on in the first few questions;
- Crossover questions;
- Frequently appearing topics;
- What I would focus on teaching for each strand.
Number and proportion
- Work on context-rich problem-solving with basic arithmetic, fractions, and percentages.
- Common real-life contexts include bank accounts, utility bills, wage increases, recipes, and best-buys.
- Place value, standard form, indices, rounding and estimation, factors, multiples, HCF, LCM and product of primes tend to be assessed in more of a procedural manner and could be ‘easy wins’.
Algebra
- Algebra at Foundation is usually examined procedurally. However, students find the topics themselves more challenging, so these are not necessarily ‘easier’ marks.
- Spend time ensuring students can apply standard algebraic methods accurately.
- Consider spending less time on simultaneous equations, solving quadratic formulas, and equations, in favour of more time on graphs, sequences, and functions.
Ratio and proportion
- This strand includes lots of context-rich problem-solving involving ratio and proportional reasoning.
- Ratio is frequently embedded in questions in other topics, such as shape or angle problems.
- Include more work on time, particularly misconceptions around fractions of an hour, and calculator use for time problems.
Geometry
- Include plenty of context-based problem-solving on perimeter, area, volume, and surface area, and ensure students can flexibly apply these skills to 2D and 3D shapes and other problems.
- Allow sufficient time for scale drawing work and bearings, linking this to other topics.
Probability
- Procedural marks are up for grabs in probability, including using probability scales, writing simple probabilities, and completing or reading information from tree diagrams.
- An increased focus on ‘newer’ topics, such as Venn diagrams, sets, listing outcomes and frequency trees.
- Ensure students can apply fraction and ratio skills to unfamiliar contexts for mutually exclusive events or relative frequency.
Statistics
- Include plenty of practice presenting data, particularly looking at the pros and cons of different types of graphs, and spotting errors in given graphs and charts.
- Estimating the mean and average calculations from frequency tables both come up fairly frequently.
- Data collection and sampling are assessed less frequently.

Free GCSE maths revision resources for schools
As part of the Third Space Learning offer to schools, the personalised online GCSE maths tutoring can be supplemented by hundreds of free GCSE maths revision resources from the secondary maths resources library including:
– GCSE maths past papers
– GCSE maths predicted papers
– GCSE maths worksheets
– GCSE maths questions
– GCSE maths topic list
Background to this research
I started looking in detail at these papers in 2021, when I used the full set of six Edexcel maths GCSE Foundation papers from June 2017 to November 2019.
Even then I noticed the set of papers available raised a few interesting and surprising statistics. For example, approximately two-fifths of the ‘Geometry’ marks were for perimeter, area, and volume, and many of these involved problem-solving in non-standard contexts.
As a mathematician, I wanted to investigate this further – an anomaly or a pattern? As it turns out, the amount was slightly anomalous, but the assessment of perimeter, area and volume mainly as non-procedural questions was a pattern across all papers.
Since writing that article, we’ve had a few more sets of papers and I’ve had more time to refine my analysis process. The refreshed article has been fully expanded and now covers:
- Which strands or topics are the heaviest hitters at the Foundation level?
- Which topics appear most in the first five questions in Edexcel Foundation papers?
- Which topics appear most the crossover questions at GCSE?
- Which topics are more likely on Maths Paper 1?
Unlimited GCSE maths tutoring with Skye, the voice-based AI maths tutor.
Built on the same principles, pedagogy and curriculum as our traditional tutoring but with more flexibility, reach and lower cost.
Help your GCSE students achieve their target grade with Skye’s one to one maths tutoring.
Watch Skye in actionEdexcel maths past papers methodology
Categorising by topic
When I began my analysis work in 2021, I applied a broad approach to categorise each question, using only topic and sub-topic. For example, Statistics / Charts and Graphs.
Since then, I have added several more papers and further detail to my data set, allowing for a more in-depth look at how different GCSE maths topics are examined.
The categorisations are based on the GCSE specification (Edexcel), and align closely with Third Space Learning’s topic categories:
Classifying some of the multi-mark, deeper problem-solving questions presented a challenge, so I picked a main topic for each question and classified it under that heading, rather than try and assign marks for topics within questions.
For example, June 2019 1F Q18 required candidates to use skills for four operations, decimal calculation and area. However, as the question is inaccessible without some knowledge of the area of a rectangle, I classified this as ‘perimeter and area’.
Some topics also appear in more than one strand. For example, in Edexcel’s GCSE specification, fractions and percentages appear in both Number and Ratio, Proportion and Rates of Change.
In my categorisations, fraction and percentage calculations (i.e. fraction arithmetic, fractions and percentages as operators) are assigned to Number, whereas percentage change is assigned to Ratio and Proportion.
Proportional reasoning only covers standard proportion and ratio-type problems, for example recipes, conversions and splitting into ratios. However, many ratio problems include fractions, percentages or both.

Third Space Learning’s GCSE AI maths tutoring covers the entire GCSE mathematics curriculum. Our programmes use diagnostic testing to assess where the gaps in knowledge lie and then use this information to tailor the course specifically to the needs of each student. Students work through individualised lessons with Skye, the AI maths tutor, to practice the areas of maths they need more support on. This helps them to develop mathematical fluency and increase their confidence going into the GCSE maths exam.
Categorising by complexity
To simplify the analysis process, I decided to classify the high-mark problem-solving questions by their main topic; this does lose a little bit of detail but makes it easier to look for trends across a larger data set.
I also wanted an idea of the difficulty or complexity of each question. I decided to base this broadly on the GCSE assessment objectives:
- AO1 – using and applying standard techniques (50%);
- AO2 – reasoning, interpreting and communicating mathematically (25%);
- AO3 – solving problems in mathematics and other contexts (25%).
It should be noted that this is a very rough basis, as longer or multi-step questions often award marks for more than one assessment objective. My complexity classifications can be stated as follows:
- C1 – standard procedural problems, often worth one or two marks.
- C2 – problems asking candidates to explain their reasoning, interpret information from tables, diagrams or other contexts, or ‘show that’ type questions.
- C3 – non-standard multi-step problems, often requiring the application of skills from a variety of topics, worth three, four, or more marks.
This is also not a ‘difficulty’ measure – it should be noted that ‘higher grade’ topics, such as simultaneous equations or estimating the mean, are often examined as standard procedural.
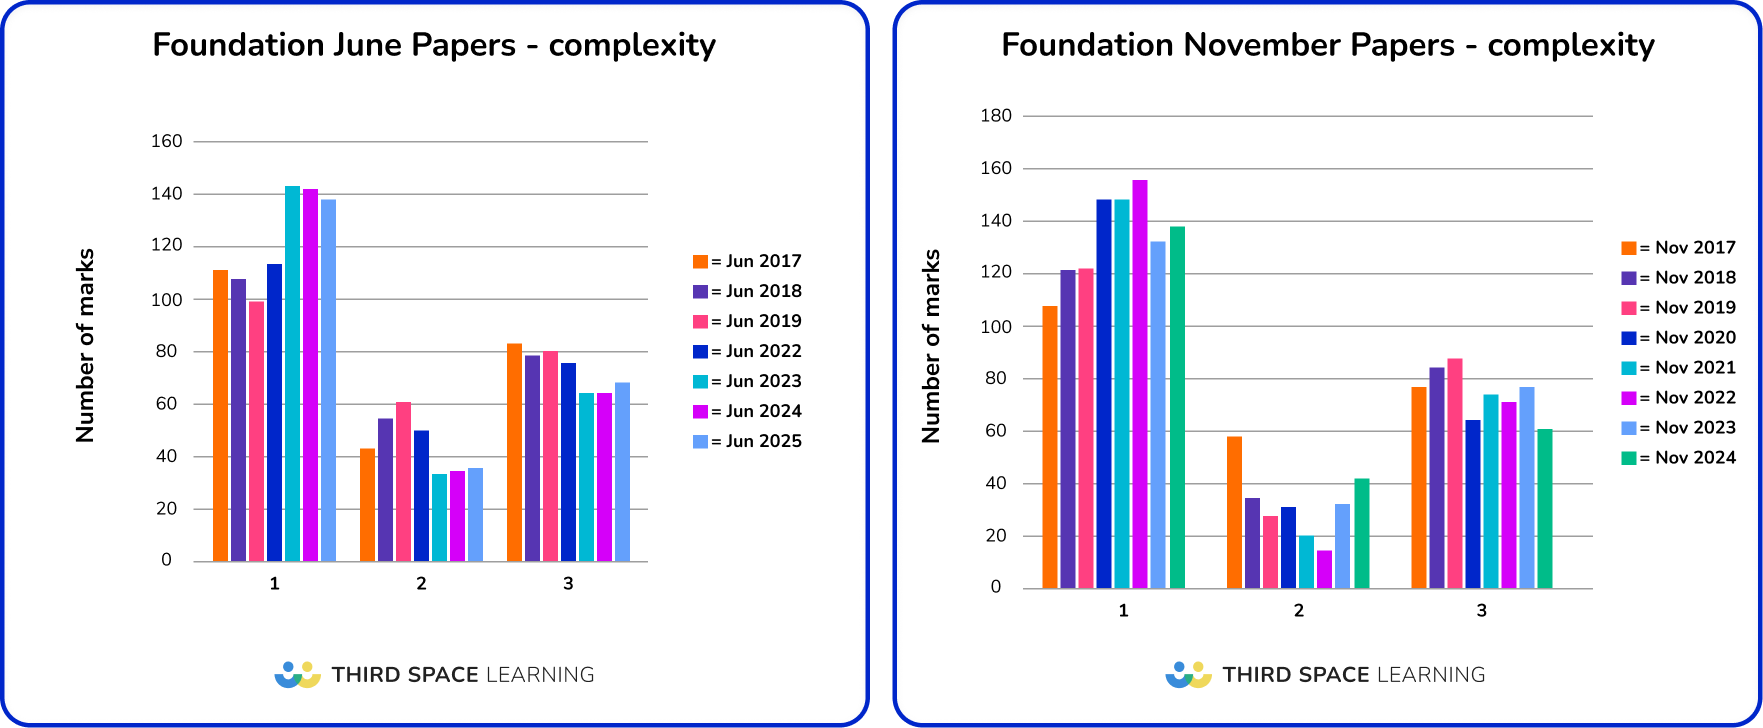
The earlier series before June 2020 have roughly a third of the marks on the mark scheme allocated to C3 problems, with a higher ratio of C1 to C2 questions on the November series.
Post-2020 papers trend towards a slightly higher ratio of C1 to C3 questions; this difference is particularly noticeable on the June 2023 exam papers and continued in 2024.
Interestingly, the last two series, November 2023 and June 2024, had a slightly higher ratio of C2 to C3 questions than some previous series.
How to use this analysis to help students gain the most marks
Later, I’ll go into a full analysis of each strand and topic. But before I do, here’s an overview of the best topics to focus on to help students gain the most marks.
One of the best ways to maximise the marks students gain is to make sure students gain as many marks as possible on the one mark and two mark questions. These are very often procedural, with a right or wrong answer. These topics also frequently appear in higher-mark questions too.
In many cases, such as the first ten questions on the Foundation paper, one- and two-mark questions are the easiest marks for students to pick up. Many of the procedural topics in this section are also embedded further in the paper. For example, converting a fraction to a decimal may appear as a one-marker in the first five questions, and again embedded in a question involving ratio and proportion later on.
The lists in this section are not exhaustive, but we’ve narrowed down the most frequently appearing accessible topics which should allow your students to start each paper confidently.
Top one mark question topics
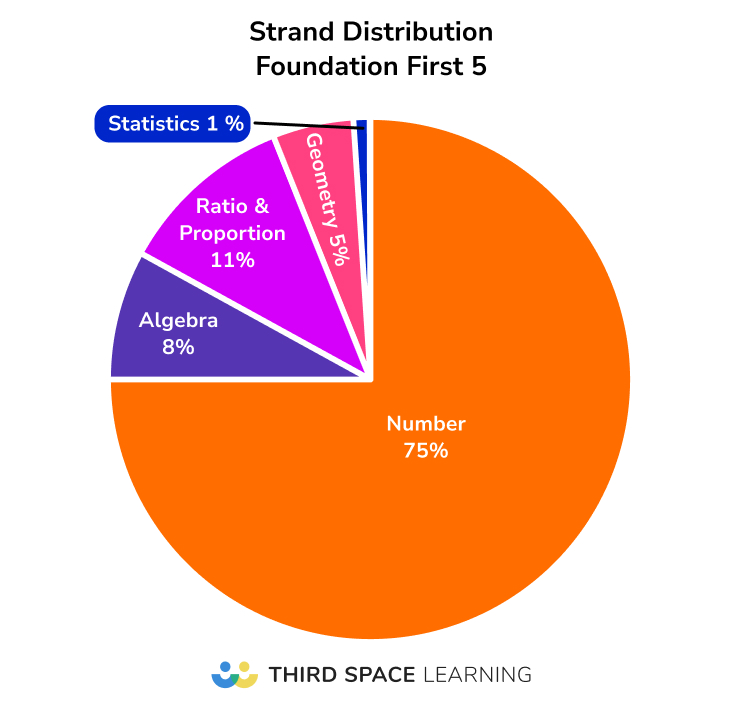
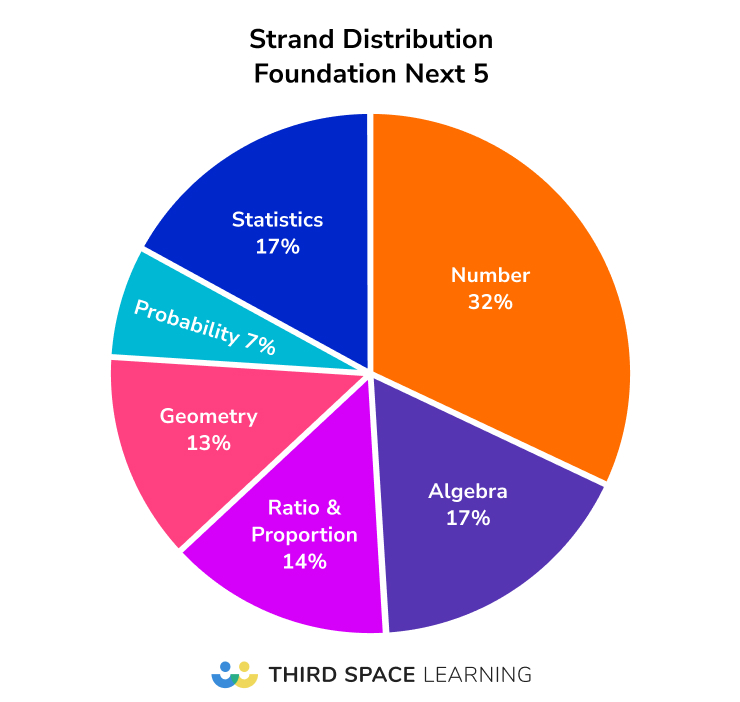
When looking at one-markers, the obvious place to start is with the first five questions on the exam paper. Questions at the start of the Edexcel Foundation GCSE are designed to ease students into the exam and usually have clear right or wrong answers.
You’ll notice a heavy focus on Number, which comprises 75% of the first five questions.
Frequently occurring topics in Questions 1-5:
- Metric unit conversions
- Place value calculations
- Rounding to integers
- Ordering integers, fractions and decimals
- Factors and multiples
- Convert between FDP
- Find fractions of amounts
- Algebraic notation/simplify (easier)
- Order of operations
- Calculator use
- Square and cube numbers and their roots
Gradually, the paper increases in difficulty, but there are still plenty of accessible procedural marks available.
There are more part-questions in Q6-10, but many of these parts are still single-mark right or wrong answers. Ensure students aren’t making careless errors here.
Frequently occurring topics in Questions 6-10:
- Use coordinates in four quadrants
- Probability scale
- Naming 2D shapes, parts of circles, types of angles
- Bar charts and pictograms
- Simple averages and range
- Time-series graph
- Using algebraic notation, simplifying etc
- Find terms in a linear sequence
- One-step linear equations
- Angles at a point, on a line, vertically opposite
- Function machines
- Horizontal and vertical lines
- Find the probability of a single event
- Name 3D shapes
- Use the order of operations
- Ratio and fraction links
- Name types of angle (acute, obtuse, reflex)
- Interpret graph in context
- Measuring angles and lines
Patterns of note:
- Q6-10 have a wider mix of topics, more reflective of the general proportions of the paper;
- There is a greater proportion of Statistics in Q6-10 compared to the whole paper;
- Most lower-grade Foundation topics appear somewhere in here on one series or another;
- Many lower-grade skills are still fundamental for students to master for later applications even if they don’t appear very frequently in this section of the paper;
- Few common topics or types of questions crop up between questions 6 and 10 on most papers.
Number and Ratio & Proportion account for nearly 60% of the marks in the first ten questions on the paper. Students must be confident in answering these types of questions.
Within the most frequently occurring topics, there are a few further notable points. First, let’s look in more detail at the most frequently occurring topic, money calculations:
- Money calculations appear on average, almost twice per series;
- This topic accounts for nearly 15% of the total number of marks across all topics on all papers, the next closest is bar charts at 6%;
- The majority of these questions are C3 and worth 3 or 4 marks.
Statistics content in these questions is relatively high, with:
- Bar charts or pictograms (or occasionally both) on most series;
- Simple average and range calculations, such as median or mode from a short list of data;
- Time series graphs.
Also of note is the relatively high frequency of time calculation appearances, particularly as this topic can sometimes get overlooked or assumed that students “should” be able to do. On average, there are approximately 13 marks per paper distributed over Q6-10. By the time pupils reach Q10, they can gain nearly a quarter of the marks on some less challenging content.
Top two mark question topics
Two-mark questions require students to do more work to find the answer. The expectation is that students must apply some mathematical method or process, which they will receive credit for. However, this is usually a one- or two-step process, meaning these questions can still be accessible provided students understand the subject content.
Topics in this table are divided by strand and then listed in order of frequency of appearance, highest to lowest. All topics in this table have three or more appearances as two-mark questions.
Frequently occurring topics in the crossover questions
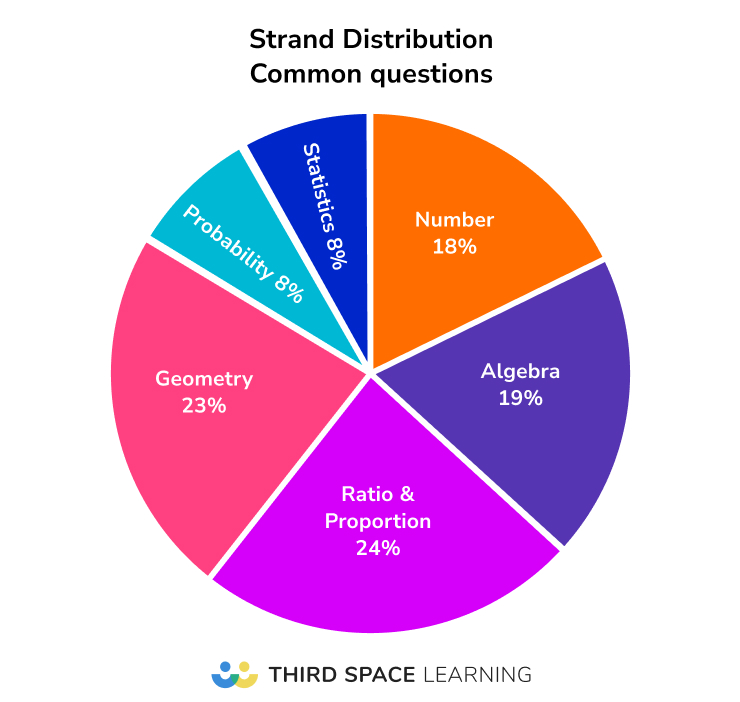
This section focuses on the crossover questions on both tiers. These are the final few questions of the Foundation papers, and the first few questions of the Higher papers. However, there is often an “extra” question or two at the end of the crossover content on Foundation that doesn’t appear on Higher.
On average, we’re looking at around 20-25 questions per series, split over three papers. A typical Foundation paper contains approximately 8 common questions often split into parts, carrying nearly a third of the overall marks per paper.
Towards the end of the paper, we see questions typically worth more marks, it’s crucial that students aiming for grades 4-5 can access these. This section contains some suggestions for doing this.
As the changes made for the 2018 summer series onwards also affected the crossover content, I have omitted the June and November 2017 series from the data set.
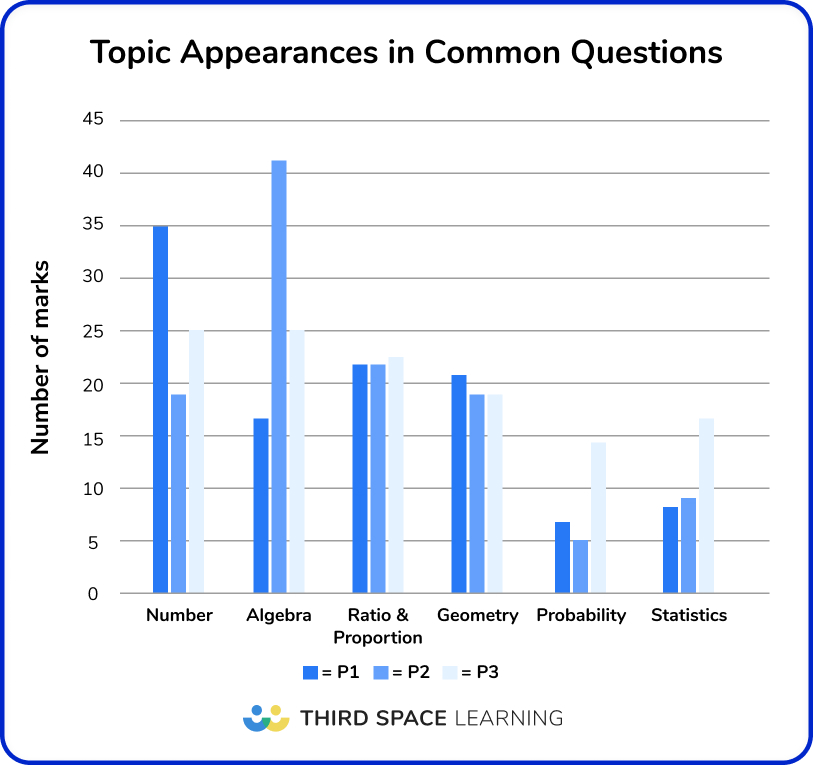
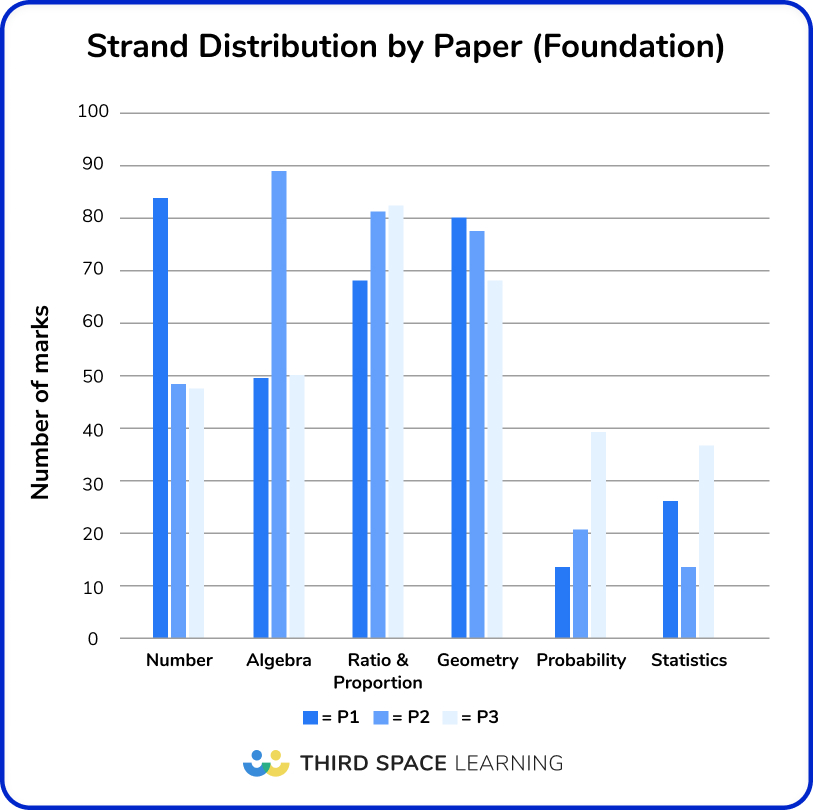
On this graph, part questions are counted as separate appearances to account for different topics assessed in different parts of questions.
Key points
- There is a higher proportion of Number content on Paper 1 (non-calculator) – this follows the pattern for the rest of the papers at both tiers, i.e. Number is assessed more frequently on the non-calculator paper.
- Compared to the rest of the average Foundation paper, there is proportionally more algebra and slightly more of other non-Number strands in the crossover questions – this reflects higher-level topics being assessed towards the end of the paper.
- There is more Probability and Statistics on Paper 3 than on the other two papers – this is probably a curiosity rather than by deliberate design, as the content on calculator Papers 2 and 3 should be functionally identical.
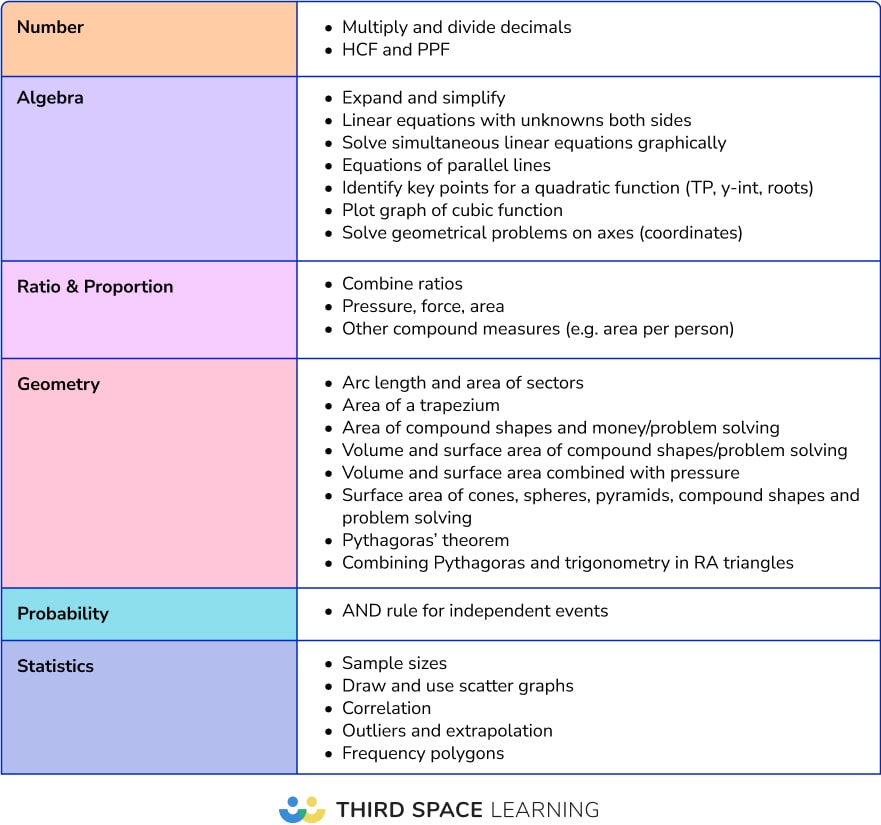
Frequently occurring topics
As expected, some topics appear more frequently than others in crossover questions. Although this shouldn’t be used to narrow down taught content, it indicates where to focus revision when time is tight.
This table contains topics with four or more appearances in crossover questions from June 2018 onwards, split by strand and ordered from most to least frequent.
Topics that attract the most marks
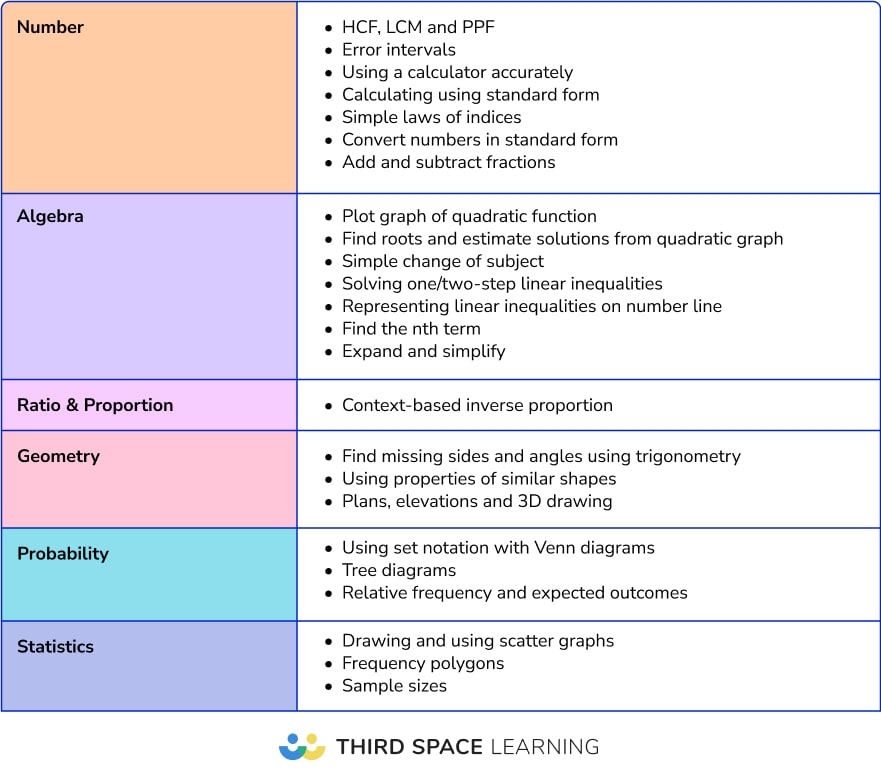
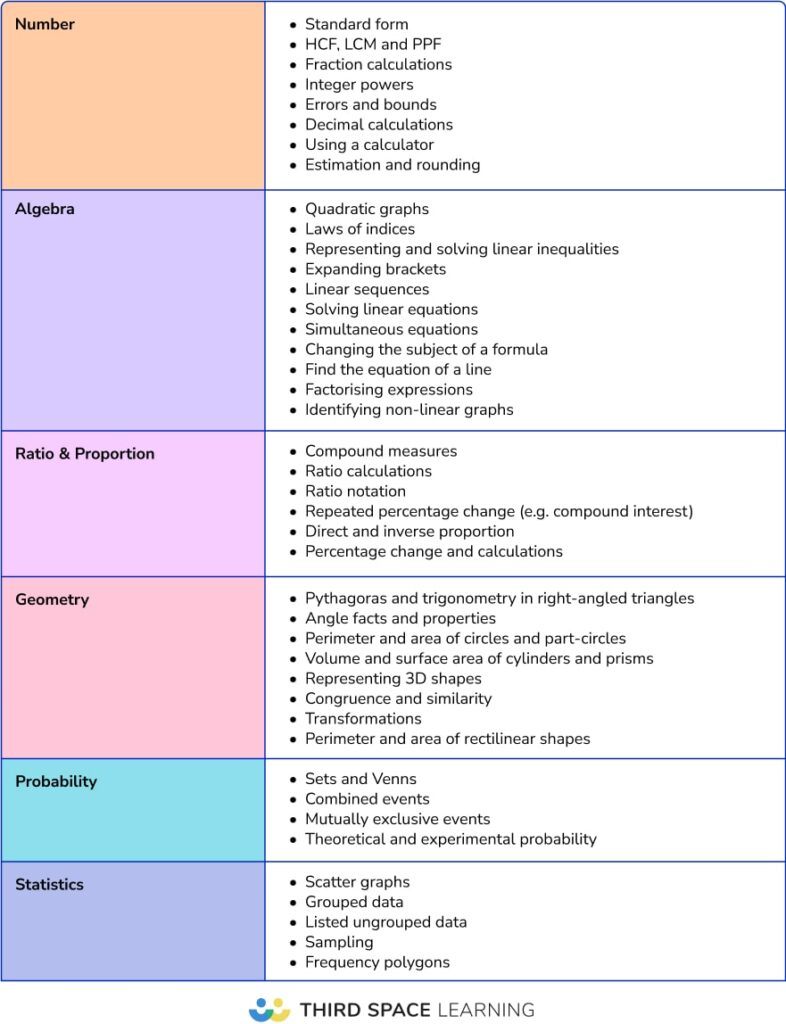
There is considerable crossover between the topics in this list and the one above; expect topics which appear more often to come out with a higher average mark. Here is the list of twenty common question topics worth the most marks:
- Speed, distance, time
- Ratio and FDP problem solving
- Compound interest and depreciation
- Angles in polygons
- Plot graph of quadratic function
- Venn diagrams
- Convert numbers in standard form
- Simple laws of indices
- Find missing sides and angles using trigonometry
- Problem solving using perimeter and area
- Multiply and divide decimals
- LCM
- Combine ratios
- Find roots and estimate solutions from quadratic graph
- Percentage increase and decrease
- Adding and subtracting fractions
- Multiply and divide fractions
- Find percentages of amounts
- Error intervals
- Draw and use scatter graphs
Topics that have only appeared as crossover questions
Some topics have only appeared in crossover questions on the Foundation papers and haven’t been assessed at a lower level in the Foundation only questions on the paper.
This only looks at categorisation by the main topic, or the initial knowledge needed to gain any marks on the question.
Paper 1 foundation topics
At GCSE, Paper 1 is a non-calculator paper, whereas Papers 2 and 3 allow calculator use. This impacts which topics are more likely to appear on Paper 1, or Papers 2 and 3.
Broadly speaking:
- Paper 1 is significantly more arithmetic intensive, featuring topics like written calculation methods, fraction arithmetic and so on.
- There are slightly fewer questions on Ratio and Proportion and Geometry on Paper 1.
- Topics which don’t require a calculator such as transformations, drawing and interpreting charts and graphs, constructions and loci, plans and elevations are more likely to appear on Papers 2 or 3, because there’s less room for them on Paper 1.
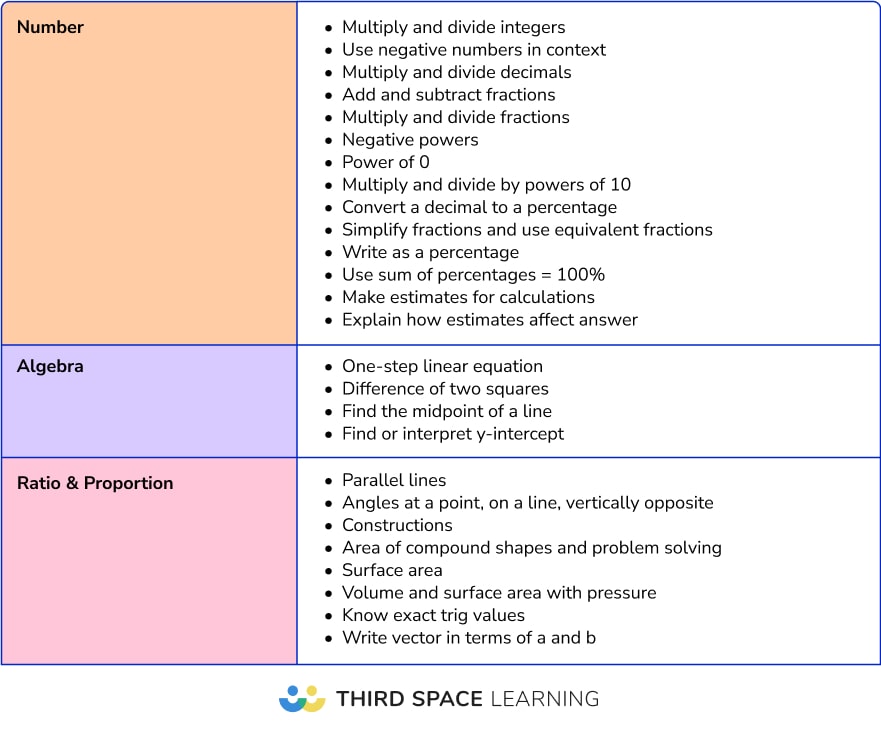
Topics with a high proportion of appearances on Paper 1
Some topics are more likely than others to come up on the non-calculator paper. This table lists topics which have 80% or more of their appearances on Paper 1. Note that some of these topics such as the difference of two squares do not appear often at the Foundation level.
Underlined entries indicate particularly popular non-calculator topics (defined as those which have appeared in more than half of all series so far).
Edexcel maths past paper analysis by strand and topic
Despite some minor variations, pre and post-pandemic exam series have interestingly similar patterns around the types of questions set and the complexity distribution for each topic, with some potential implications for exam preparation.
Data is split into six strands:
- Number;
- Algebra;
- Ratio and proportion;
- Geometry;
- Probability;
- Statistics.
Before we get into the strand-by-strand analysis, here are patterns across the strands and papers as a whole.
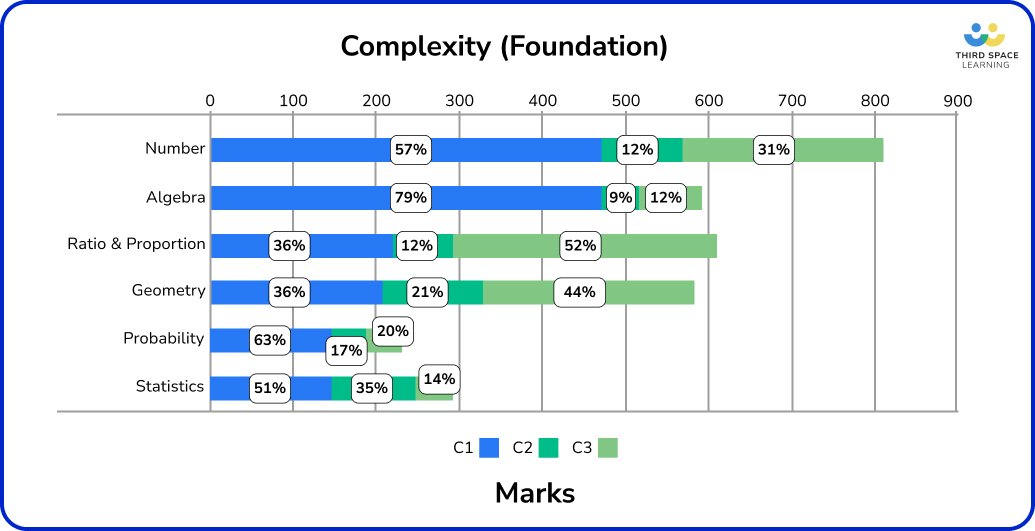
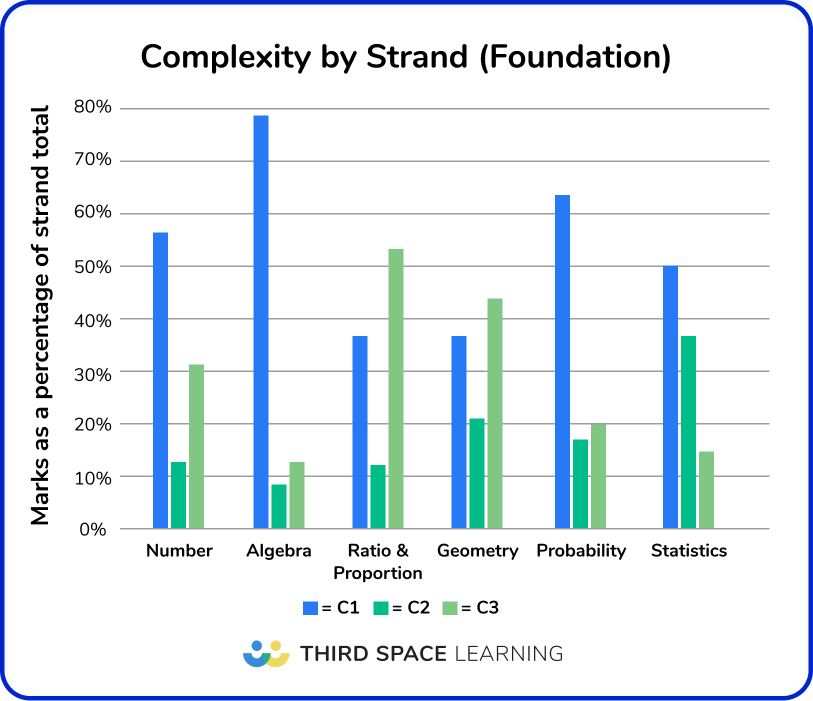
Particularly of note:
- There is a higher proportion of C3 non-standard, context-based problems within Geometry and Ratio and Proportion;
- There is a higher proportion of C1 procedural problems in the Algebra, Probability, and Statistics strands, with nearly all Algebra content (~80%) assessed in non-complex questions;
- The highest proportion of C2 questions involving reasoning or interpretation from charts or diagrams occurs within Statistics.
This has implications when preparing Foundation groups for sitting exams, particularly when working on more complex or unfamiliar problems that students struggle with most. When time is short, we can identify strands where these problems are more likely to occur (Geometry, Ratio
Foundation – Number
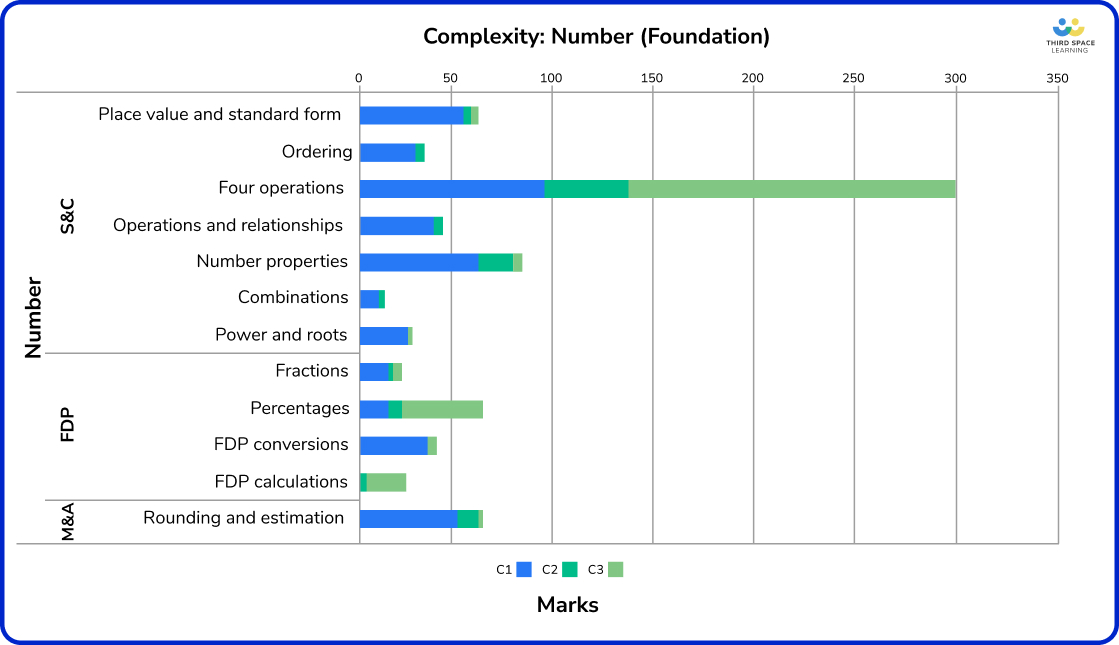
First to note when looking at number skills at the Foundation level is the large proportion of marks available for four operations calculations, with 54% of these marks for C3 questions.
This topic includes integer and fraction calculations, which are more generally procedural, but also include calculations from contexts. At Foundation, working confidently with arithmetic and using this in unfamiliar problems is key.
Elsewhere, Number, Fractions, Percentages and FDP calculations also attract significant C3 marks. Percentages in particular contain 64% of the marks overall for problem-solving questions.
On the other hand, there are plenty of C1 marks up for grabs in the following topics:
- Place value and standard form (92%)
- Ordering (89%)
- Operations and relationships (91%)
- Powers and roots (94%)
- FDP conversions (91%)
- Rounding and estimation (76%)
Rounding and estimation is 20% C2. Mostly asking candidates to explain the effects of rounding or estimation on answers, whether an approximation will result in an over or under-estimate, and so on. Negative numbers also tend to be assessed as C2.
18% of number properties is C2; there are a few questions asking candidates to give examples or counterexamples for a given statement, such as June 2018 P1 Q11, a two-part question asking for examples to show that two statements about (a) factors of even numbers and (b) digits in odd numbers are incorrect.
What would I teach based on this data analysis?
- Context-rich problem solving with basic arithmetic, fractions, and decimals.
- Real-life contexts, including bank accounts, utility bills, wage increases, recipes and best-buys.
- Content to assure automaticity in basic number facts including identifying factors, multiples, primes, FDP equivalence and working interchangeably with these.
- Procedural work on place value, standard form, ordering, operations and relationships, powers and roots, FDP conversions, and rounding and estimation.
Foundation – Algebra
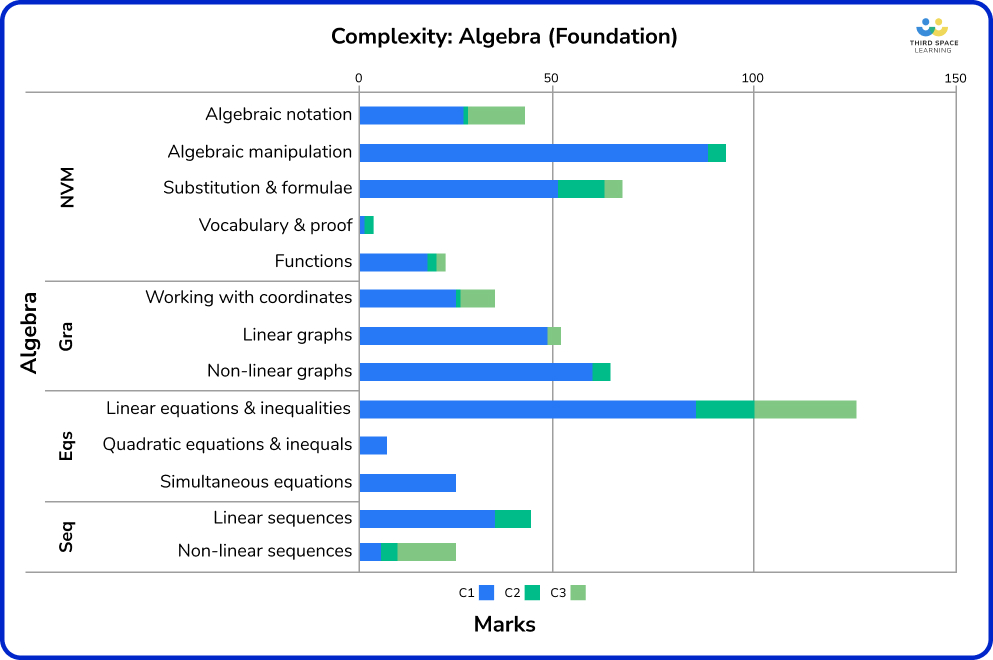
Algebra is a stark contrast to Number in terms of complexity. There are a lot of topics here that rarely, if ever, go beyond standard procedural C1 marks, and some topics do not attract C2 marks either. For example, changing the subject of a formula is generally assessed procedurally at Foundation.
Algebraic manipulation, perhaps because it is the algebra toolkit of simplifying, expanding, factorising and so on, is 96% C1 marks, with no C3. A lot of the harder topics have a higher proportion of C1 marks as well:
- Simultaneous equations (100%)
- Quadratic equations (100%) although they rarely appear on Foundation
- Functions (75%)
- Linear graphs, including gradients (94%)
- Non-linear graphs (95%)
In substitution and formulae there is slightly more of a balance: 74% C1, 16% C2, 10% C3. This is one of the main areas within the Foundation series, where candidates are asked to solve problems using algebra, such as looking at context-based formulae such as temperature or a formula for working out costs. The C2 marks in this topic include translating a worded context into an algebraic formula.
The 21% of C3 marks on linear equations were mostly for forming and solving equations from context, such as in combination with shape and angle problems.
Along with substitution and formulae, sequences attract one of the highest proportions of C2 marks (linear sequences 30%, non-linear sequences 21%). This is due to questions asking candidates to show that n is or is not a term in the sequence or to critique a false statement about a sequence.
What would I teach based on this data analysis?
- Content to ensure procedural fluency with basic algebra (simplifying, expanding, factorising, laws of indices).
- Solving linear equations and inequalities, including applying these to geometrical contexts.
- Applying mathematical formulae to a variety of real-life and unfamiliar contexts.
- Sequences, functions and graphs, with a focus on procedural ‘easy wins’ in straight line graph work and sequences.
- Less time solving quadratic equations, cubic and reciprocal graphs, parallel lines and quadratic and geometric sequences.
Foundation – Ratio and Proportion
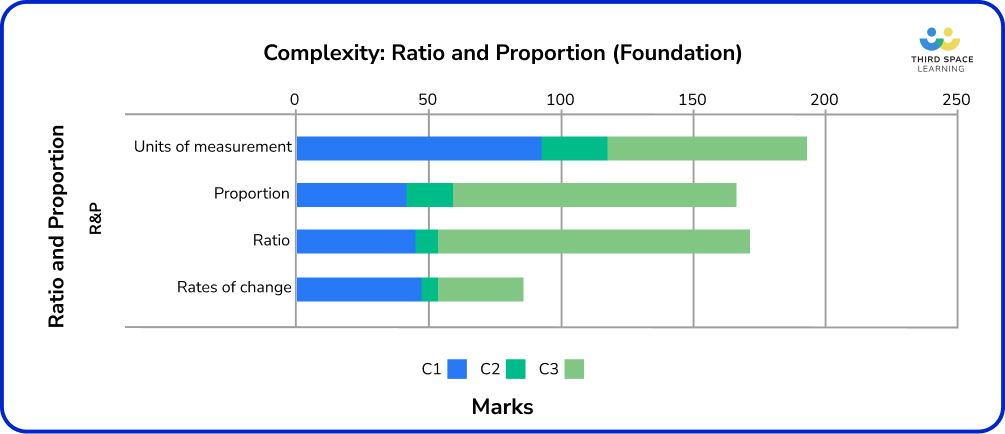
Similarly to Number, many Ratio and Proportion questions were classified as C3 problem-solving. This was particularly evident within work on proportion concerning recipes, best buys, direct and inverse proportion, and ratio concerning splitting into a ratio, combining ratios, and solving problems using FDP and ratio.
Of the 37% of the C3 marks within units of measurement, quite a few were allocated to four or five-mark questions. This was partly accounted for by compound measures, which do a lot of heavy lifting at Foundation and have appeared in almost all series so far. Nearly half of the marks for compound measures came from C3 questions, meaning that the ability to problem-solve within this topic is crucial.
Topics that are more likely to be assessed procedurally include:
- Distance and speed-time graphs;
- Standard measures (i.e. unit conversions);
- Proportion graphs;
- Reverse percentages;
- Simple and compound interest.
What would I teach based on this data analysis?
- Context-rich problems requiring students to work flexibly with fractions, percentages and ratios.
- Splitting into a ratio and combining ratios, particularly in context.
- ‘Number-puzzle’ problems where students are asked to work out a missing amount when the other proportions are given as a mixture of fractions, percentages, and ratios (e.g. June 2018 P1 Q14).
- Place a greater focus on time, particularly misconceptions around fractions of an hour, and the use of a calculator for time problems.
Foundation – Geometry
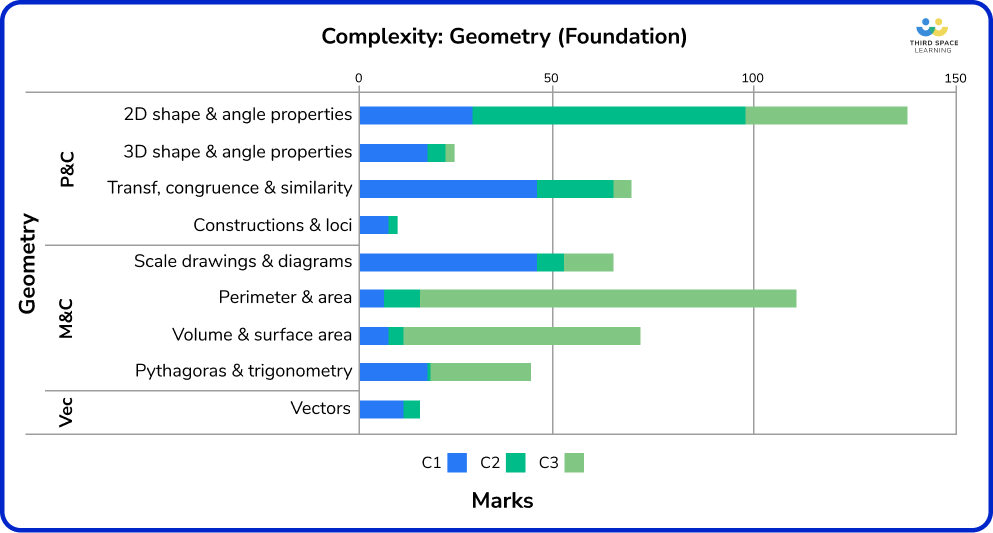
Geometry was the strand that surprised me the most when completing this analysis, particularly the huge amount of C3 marks within:
- Perimeter and area (84%);
- Volume and surface area (83%).
Also surprising as one of the more challenging topics on Foundation was the relatively high proportion (51%) of C3 marks for Pythagoras’ theorem and trigonometry. Interestingly, often it is assessed in unfamiliar contexts or in combination with other topics.
All but one of these more complex questions have appeared in November series, and these topics have historically been assessed more procedurally in June papers.
As mentioned, perimeter, area and volume were very context-heavy, with some series having all questions assigned as C3. These included real-life contexts such as calculating a circular lawn area and fencing for a farmer’s field, and there was also some crossover with fractions work, such as showing that a certain fraction of a shape was shaded. Many 2D shapes involved in area work were standard: squares, rectangles, triangles and circles, with less on compound shapes.
We have content relating to the farmer’s field question, and crossover with fractions work, in our GCSE lesson dedicated to perimeter and area application.
Free GCSE maths revision resources
Download resources from the extensive library of free secondary maths resources. Worksheets, formula sheets and GCSE maths topic lists for AQA, Edexcel and OCR are all created by teacher for schools like yours.
Specifically designed for GCSE maths revision, the GCSE maths past papers, GCSE maths worksheets and GCSE maths questions, will help to familiarise students with the type of materials covered in the exam and how questions are marked.
Transformations, congruent shapes, and similar shapes feel the same as on previous specification papers; a mixture of ‘do this transformation’ and ‘describe this transformation’, with perhaps a little more work on congruence and similarity beyond just knowing the meanings of the words (see Nov 19 P1 Q29 for example). So far, all enlargements have been C1. Similarly, most vectors content is C1, with limited problem-solving in this area.
2D shape and angle properties attracted the highest proportions of C2 marks (47%), purely because many of the questions in these topics contain the statement: ‘give reasons for your answer’. Interestingly, a few C3 marks involved solving problems with the interior and exterior angles in polygons (see Nov 19 P3 Q29 and Nov 18 P1 Q28 for examples).
It’s worth noting that the low proportion of work at Foundation level on constructions and loci, this topic has only appeared three times across ten series.
What would I teach based on this data analysis?
- Problem-solving and context-based problems in units on perimeter, area and volume.
- Ensure that students can flexibly apply these skills to other problems, such as in the tennis court scale drawing problem mentioned above.
- Spend more time on scale drawing work and bearings, linking this to other topics.
Foundation – Probability
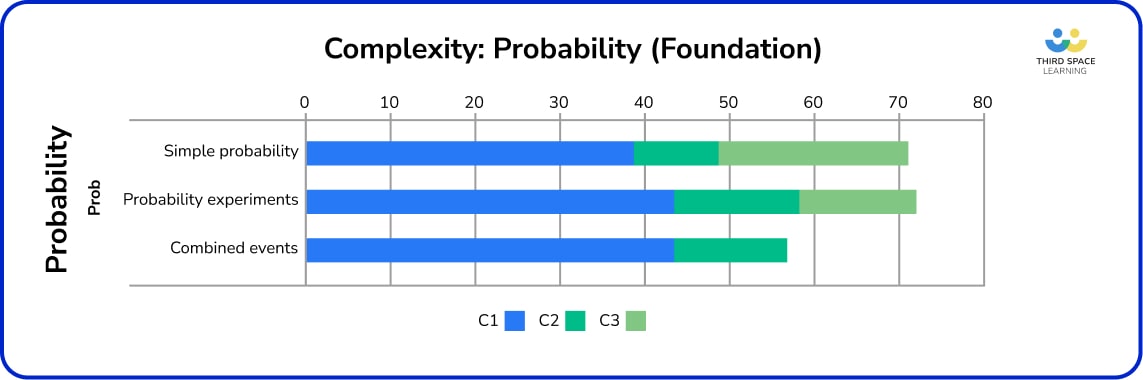
Over eleven series of papers, the ‘new spec content’ (i.e. that was added in 2015), as opposed to ‘old spec content’, is strongly represented in the probability strand. Earlier on in the life of the specification, frequency trees appeared much more frequently than tree diagrams, although this balance appears to have been redressed in more recent series. It is still not unusual to see frequency trees and tree diagrams on the same series, and, in one instance, on the same paper.
Sets and Venns carried nearly 20% of the total probability marks, with completing a Venn diagram and using this to find a probability featuring very highly.
Mutually exclusive events were most likely to be examined at C3 (52%), usually with an application of ratio or more complex fractions work (see Nov 19 P3 Q16 for a good example of this). The rest of the probability content had a high proportion of C1 marks.
What would I teach based on this data analysis?
- Ensure procedural fluency in using probability scales, writing simple probabilities, and completing or reading information from tree diagrams
- Increase focus on the ‘newer’ topics, as these seem to be examined frequently at the moment
- Particularly adapt the teaching of tree diagrams to include plenty of work on frequency trees
- Give students ample experience in applying their fraction and ratio skills to unfamiliar contexts for mutually exclusive events
Foundation – Statistics
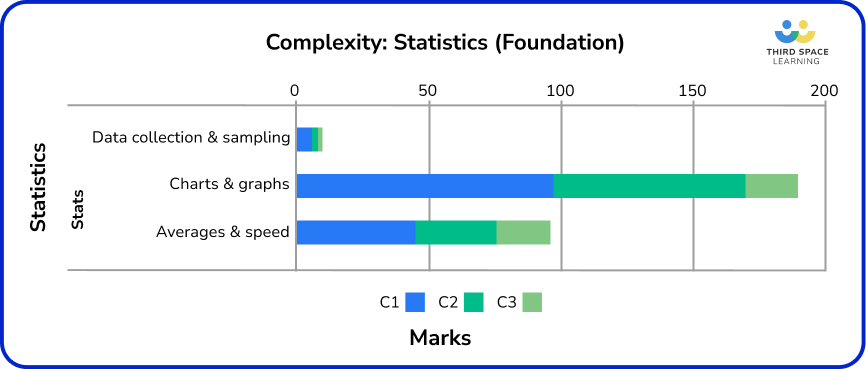
The vast majority of statistics content is C1 and C2. In the two major topics, charts and graphs had 9% of the marks allocated to C3 content. In averages and spread, this proportion of C3 marks was 24%.
Furthermore, 63% of the statistics marks were for charts and graphs. 39% of work on charts and graphs is C2, meaning that candidates are almost as likely to be asked to analyse, read information from, or critique a graph or chart as they are to draw one. Pictograms feature quite highly, alongside pie charts, with slightly fewer bar charts.
In processing data, in addition to some easier C1 or C2 questions asking candidates to find an average or range from a small ungrouped set of data, estimation of the mean for grouped data comes up fairly frequently. Data collection and sampling are not examined in quite a few of the series.
What would I teach based on this data analysis?
- Presenting data, particularly the pros and cons of different graph types and spotting errors in given graphs and charts.
Final thoughts from this analysis of Foundation Edexcel maths papers
Writing this guide has been very interesting from a personal perspective. Even as an experienced maths teacher, it has caused me to re-evaluate some ideas I had about exam preparation for the new GCSE, and to think carefully about the time weightings given to certain topics once maths revision begins.
From the Sample Assessment Materials and the messaging from exam boards, it was clear that one of the goals for the 2015 maths GCSE was to increase the demand for problem-solving and ask more questions requiring connections between topics.
The publication of Ofsted’s mathematics subject report, Coordinating Mathematical Success, in July 2023, emphasised the importance of teaching problem-solving skills.
Part of this needs to be allowed for in a scheme of work. For example, when teaching mutually exclusive events, give students plenty of problems requiring an understanding of Fractions, Decimals, Percentages and Ratios. This cannot be a quick fix at the end.
Concerning final exam preparation, there are a few things to consider. A significant amount of Algebra, Statistics, and Probability is procedural C1 content, this suggests there is less value in spending a lot of vital exam preparation time on rich problems for these topics.
Furthermore, consider the frequency at which topics like quadratic equations or factorising quadratics appear on Foundation papers. For borderline grade 4/5 candidates, we may be better off spending more time on problem-solving using proportional reasoning or shape, returning to the low-frequency procedural topics in the final weeks.
Students need plenty of practice on number skills, so these are not limiting their ability to access context-based problems, and time and opportunity to work with number and proportion skills in a variety of contexts.
They also need time on context-based shape work, particularly perimeter, area, and volume, and 2D shape and angle properties. This could be achieved by using all of the papers analysed above as practice papers, mock exams or elements of a worksheet, both in the classroom and at home.
Free GCSE maths revision resources for schools
As part of the Third Space Learning offer to schools, the personalised online GCSE maths tutoring can be supplemented by hundreds of free GCSE maths revision resources from the secondary maths resources library including:
– GCSE maths past papers
– GCSE maths predicted papers
– GCSE maths worksheets
– GCSE maths questions
– GCSE maths topic list
Finally, it’s important to assess all of this according to your specific setting and students. For some, a grade 3 represents an outstanding achievement, and a careful selection of topics to focus on may help a student to achieve this.
Other students may have ‘dropped down’ to Foundation at the last minute, so might need some rapid intervention to boost number and proportional reasoning problem-solving skills, particularly C3 questions, as GCSE maths revision in a Higher tier group may not have targeted these areas.

DO YOU HAVE STUDENTS WHO NEED MORE SUPPORT IN MATHS?
Skye – our AI maths tutor built by teachers – gives students personalised one-to-one lessons that address learning gaps and build confidence.
Since 2013 we’ve taught over 2 million hours of maths lessons to more than 170,000 students to help them become fluent, able mathematicians.
Explore our AI maths tutoring or find out how our GCSE maths tutoring programmes could support students in your school.