GCSE Tutoring Programme
Our chosen students improved 1.19 of a grade on average - 0.45 more than those who didn't have the tutoring.
In order to access this I need to be confident with:
Straight line graphs Gradient of a line Interpreting a velocity-time graphThis topic is relevant for:

Rate Of Change
Here you will learn about the rate of change including calculating the instantaneous rate of change and the average rate of change. We will also be applying knowledge of rate of change to velocity-time graphs.
You can also download the following free rate of change resources suitable for those following Edexcel, AQA or OCR exam boards:
What is the rate of change?
The rate of change is what degree one variable changes in relation to another.
For example,
A common ‘rate of change’ is speed. Speed is the rate at which an object’s distance changes in relation to the time taken.
Step-by-step guide: Speed distance time
See also: Distance time graph
Gradient of a line
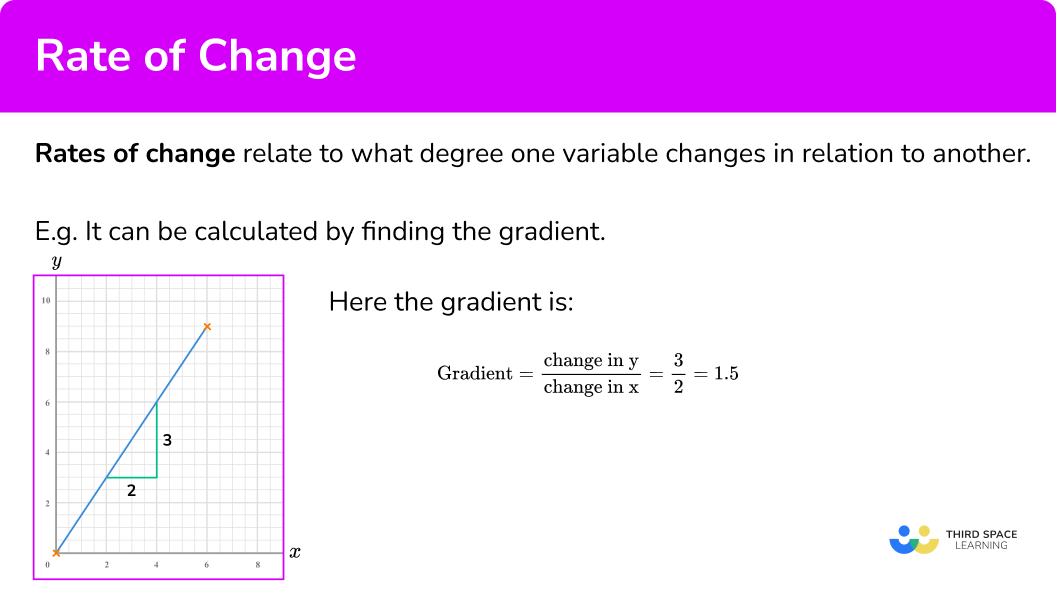
If we plot a graph showing how the variables relate to each other, the rate of change is calculated by finding the gradient of the line.
For example,
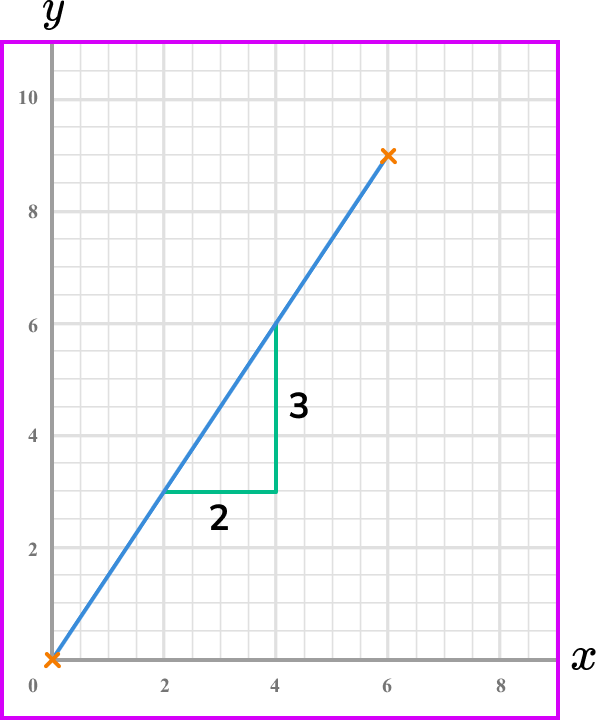
Here the gradient is
\text{Gradient}=\frac{\text{change in y}}{\text{change in x}}=\frac{3}{2}=1.5 .
Rates of change can be both positive (increases) and negative (decreases).
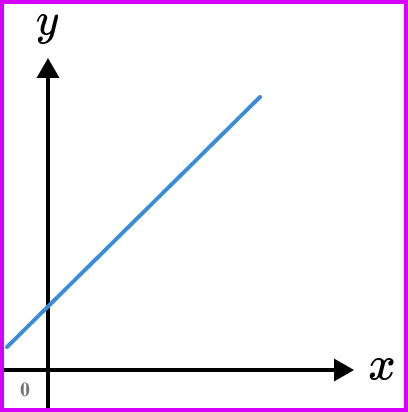
Positive rate of change
When two variables both increase in relation to each other.
Example shown by the graph below.
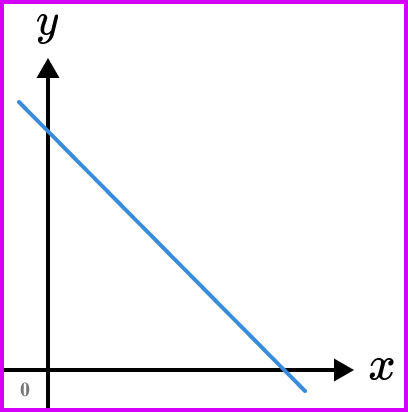
Negative rate of change
When one variable increases the other decreases.
Example shown by the graph below.
Zero rate of change
When the input variables increase the output remains constant.
Example shown by the graph below.

What is the rate of change?
Other key terms
There are several other key terms that are useful to know.
Independent variable
The ‘input’ value of the function, usually denoted by x.
For example,
In the linear function y= 2x +3 , \ x is the independent variable.
Dependent variable
The ‘output’ value of the function, usually denoted by y. It is called the dependent because it depends on the value inputted into the function (e.g x ).
For example,
In the linear function y= 2x +3 , \ y is the dependent variable.
Instantaneous rate of change
The rate of change at a specific point. It is found by calculating the gradient of a curve/line at a particular point.
Tangent line
A line that just touches a curve at a single point, it matches the curve’s gradient at that point.
Average rate of change
The rate of change between two points where the rate of change is not constant.
It is found by calculating the gradient of a chord between two points.
How to calculate the rate of change from a graph
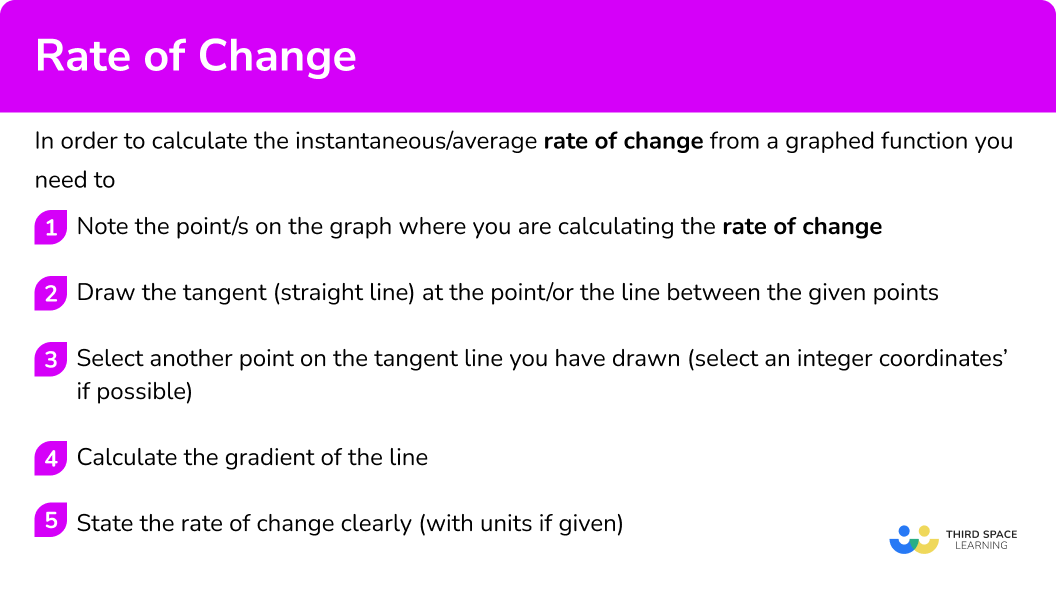
In order to calculate the instantaneous/average rate of change from a graphed function:
- Note the point/s on the graph where you are calculating the rate of change.
- Draw the tangent (straight line) at the point/or the line between the given points.
- Select another point on the tangent line you have drawn (select integer coordinates’ if possible).
- Calculate the gradient of the line.
- State the rate of change clearly (with units if given).
Explain how to calculate the rate of change from a graph
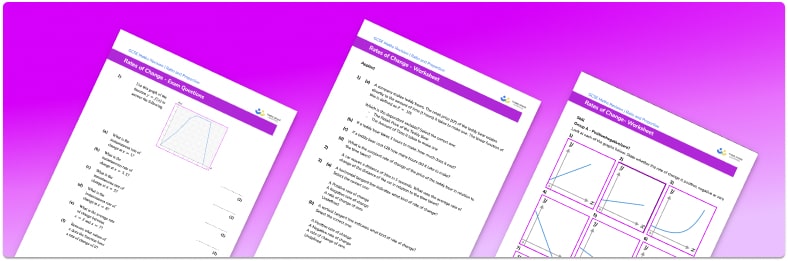
Rate of change worksheet
Get your free rate of change worksheet of 20+ questions and answers. Includes reasoning and applied questions.
DOWNLOAD FREE Rate of change worksheet
Get your free rate of change worksheet of 20+ questions and answers. Includes reasoning and applied questions.
DOWNLOAD FREERate of change examples
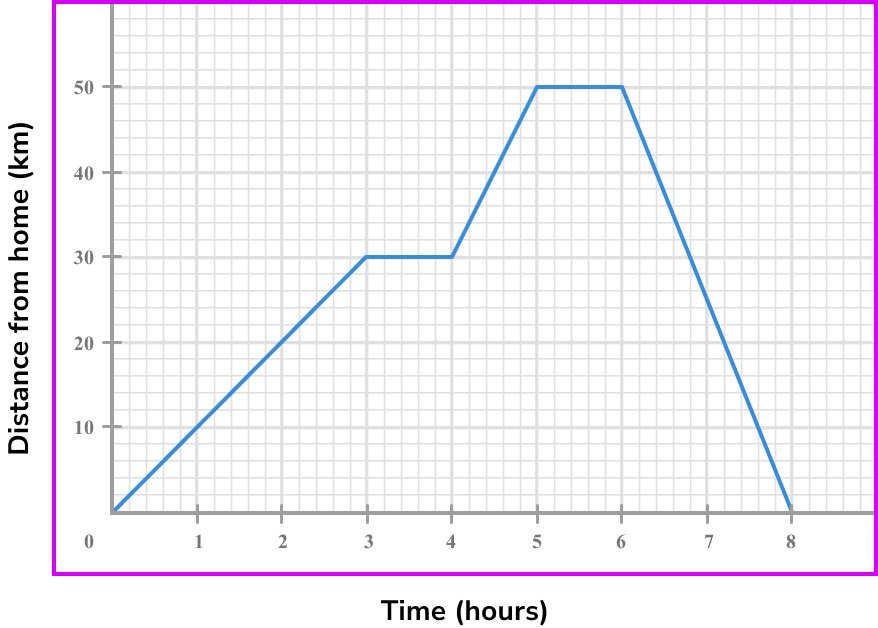
Example 1: calculating the rate of change at a point on a distance-time graph
Below is a distance-time graph of a journey. What is the speed at 2 \ hours?
- Note the point/s on the graph where you are calculating the rate of change.
We find 2 on the horizontal axis, and go up to the graph.
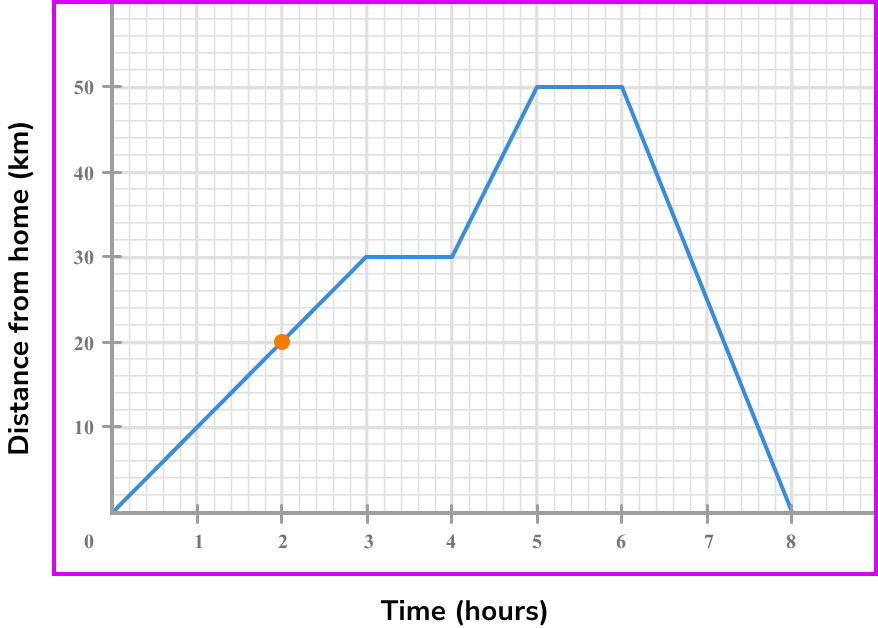
2Draw the tangent (straight line) at the point/or the line between the given points.
To find the speed we need to calculate the gradient of the line segment. As the line is straight we don not need a tangent but instead we can use the whole of the line segment to find the gradient.
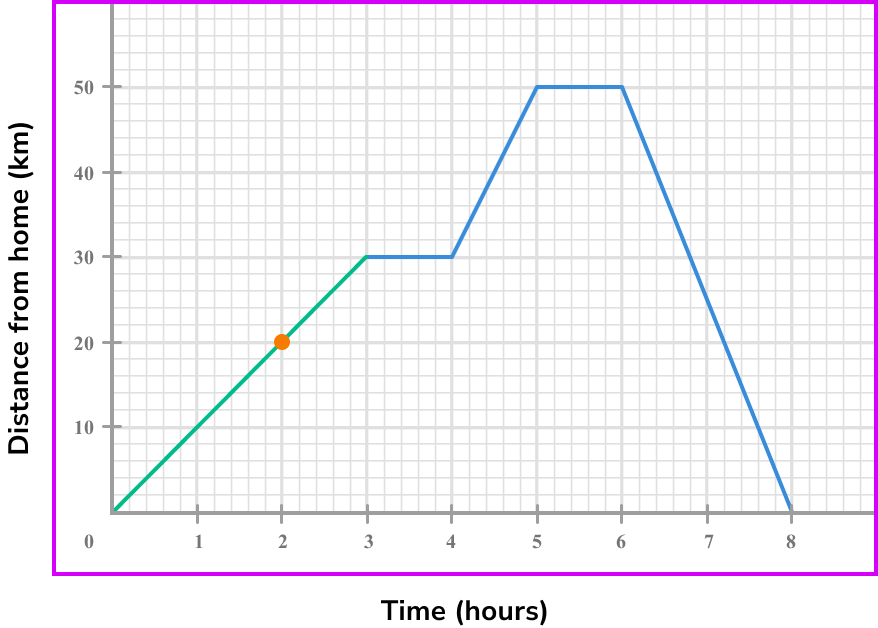
3Select another point on the tangent line you have drawn (select integer coordinates’ if possible).
We can use the points (0,0) and (3,30).

4Calculate the gradient of the line.
Coordinate one, (0,0) .
Coordinate two, (3,30) .
\text {Gradient }=\frac{\text{change in y}}{\text{change in x}}=\frac{y_{2}-y_{1}}{x_{2}-x_{1}}=\frac{30-0}{3-0}=\frac{30}{1}=10
5State the rate of change clearly (with units if given).
The speed at 2 \ hours is 10 \ km \ per \ hour.
Example 2: calculating the rate of change at a point on a distance-time graph
Below is a distance-time graph of a journey. What is the speed at 7 \ hours?
We find 7 on the horizontal axis, and go up to the graph.
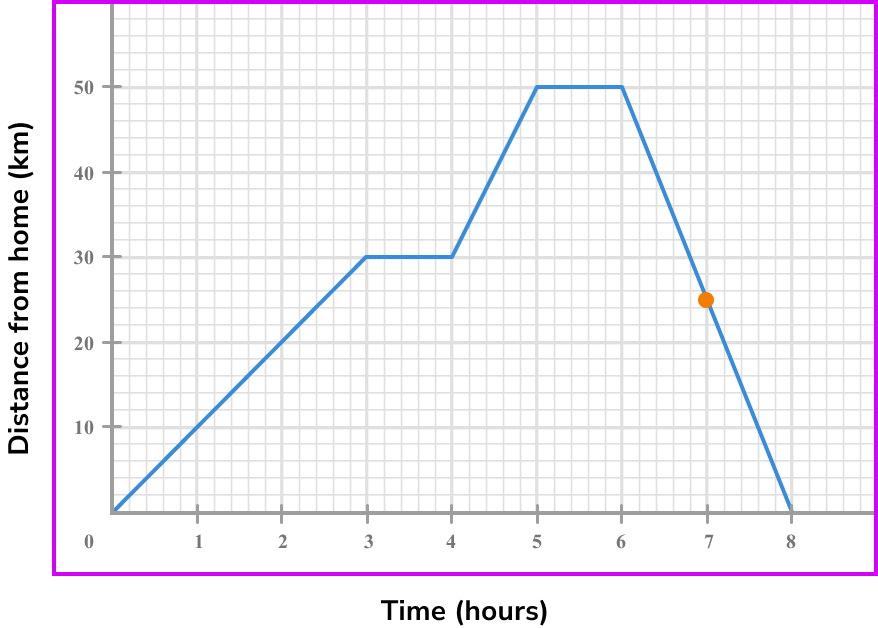
To find the speed we need to calculate the gradient of the line segment. We can use the whole of the line segment instead of a tangent.
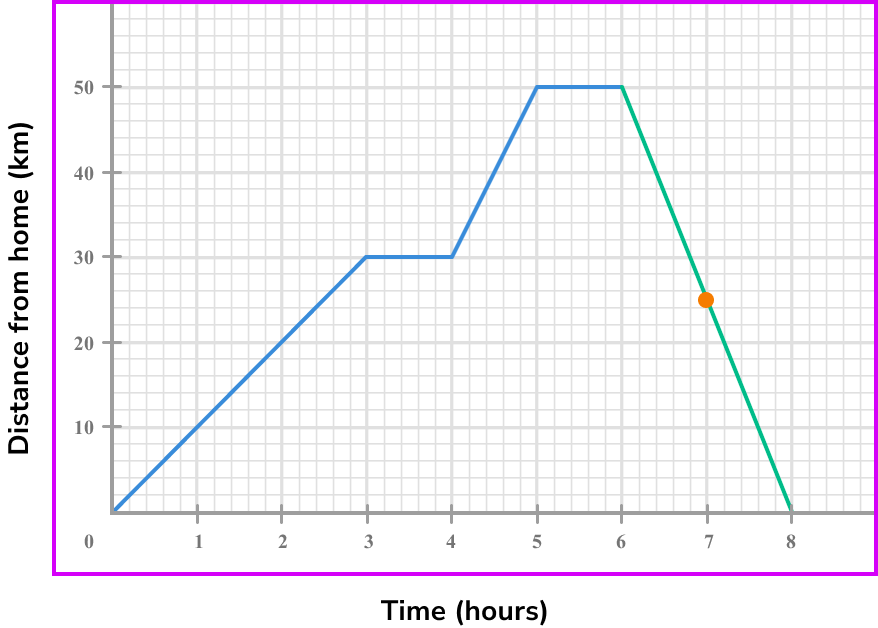
We can use the points (6,50) and (8,0).
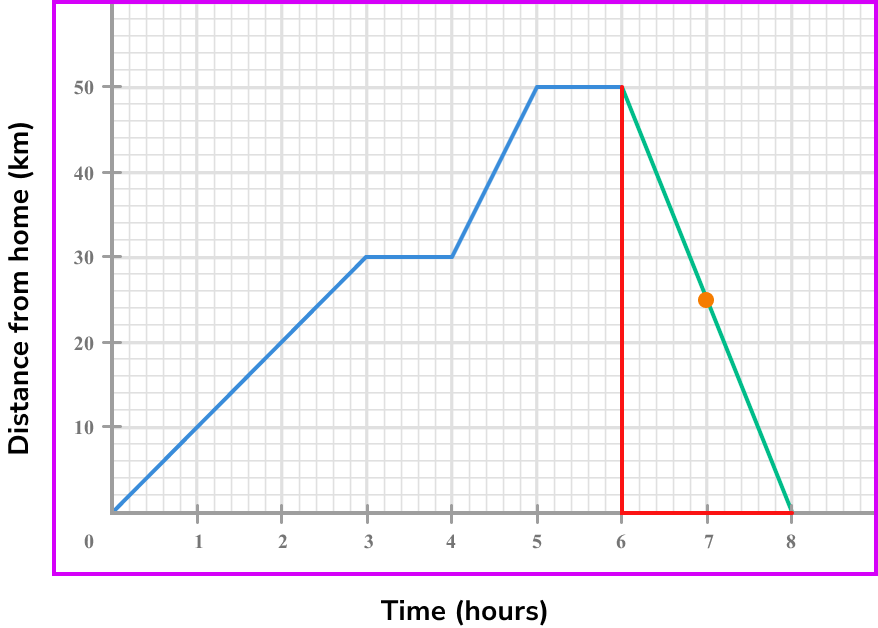
Coordinate one, (6,50) .
Coordinate two, (8,0) .
\text {Gradient }=\frac{\text{change in y}}{\text{change in x}} =\frac{y_{2}-y_{1}}{x_{2}-x_{1}}=\frac{50-0}{6-8}=\frac{50}{-2}=-25
The gradient is -25.
For speed we can ignore the negative sign.
The speed at 7 \ hours is 25 \ km \ per \ hour.
Note: if we were asked for the velocity, speed in a given direction, the answer would be -25 \ km \ per \ hour.
Example 3: calculating the instantaneous rate of change at a specific point from a graphed function
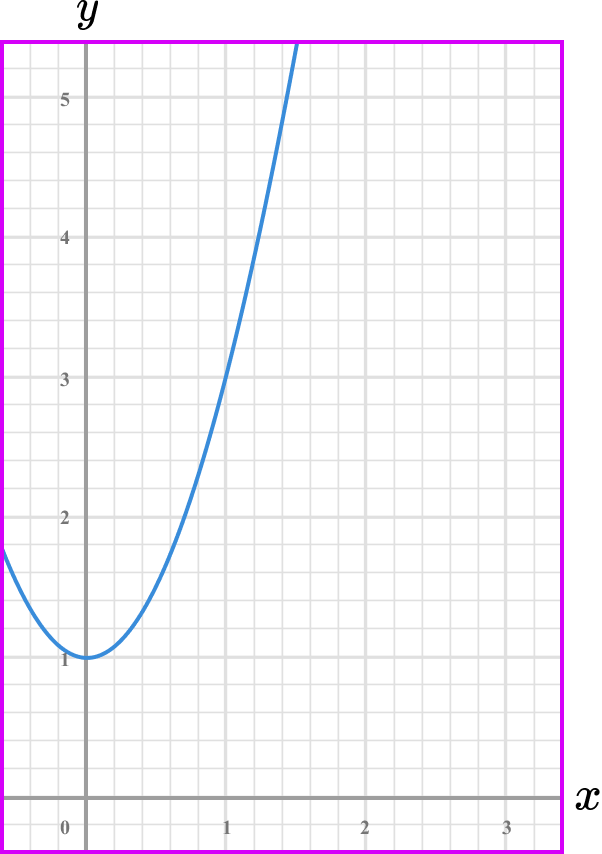
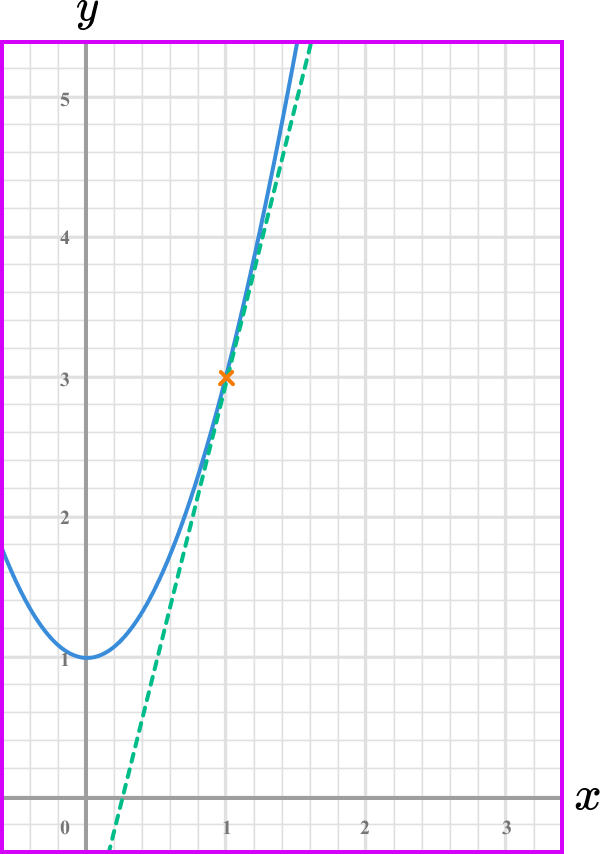
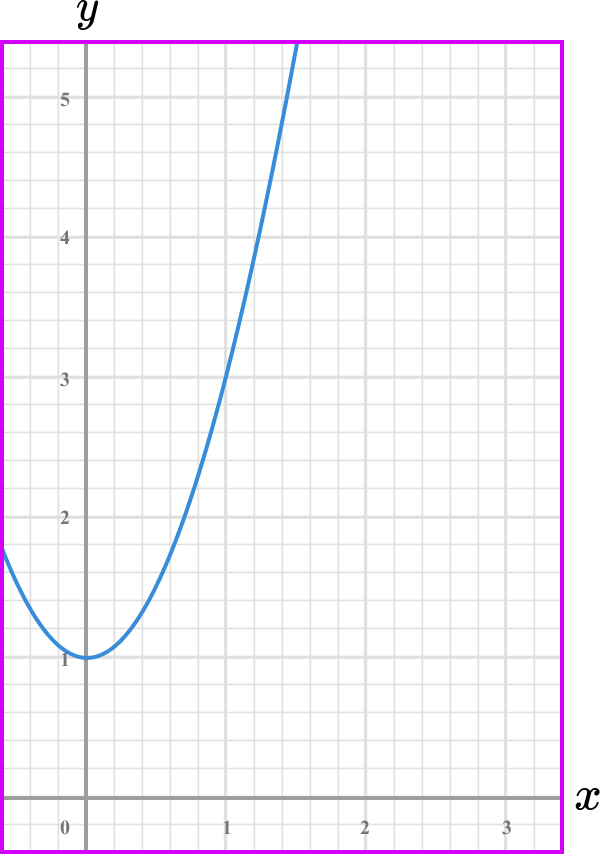
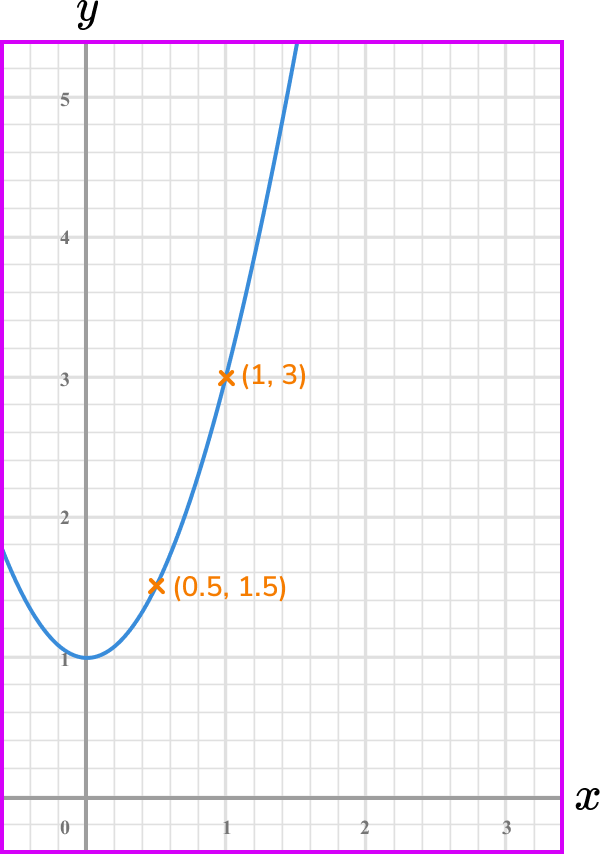
What is the rate of change of the graphed function below at the point where x=1?

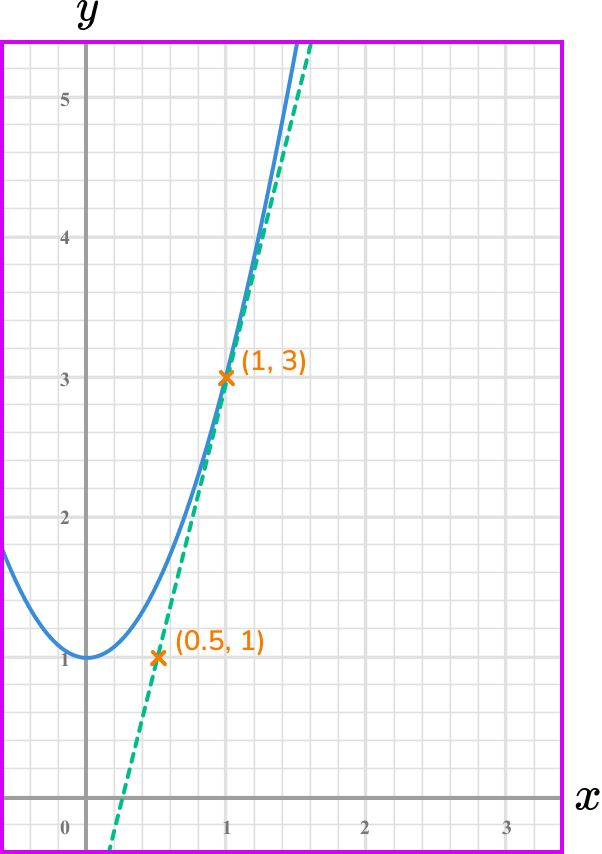
Coordinate one, (0.5,1) .
Coordinate two, (1,3) .
\text {Gradient }=\frac{\text{change in y}}{\text{change in x}} =\frac{y_{2}-y_{1}}{x_{2}-x_{1}}=\frac{3-1}{1-0.5}=\frac{2}{0.5}=4
The rate of change at the point x=1 is 4.
Note: this is the instantaneous rate of change because you calculated it from a specific point.
Example 4: calculating the instantaneous rate of change at a specific point from a graphed function
What is the rate of change of the graphed function below at the point where x=0.5?

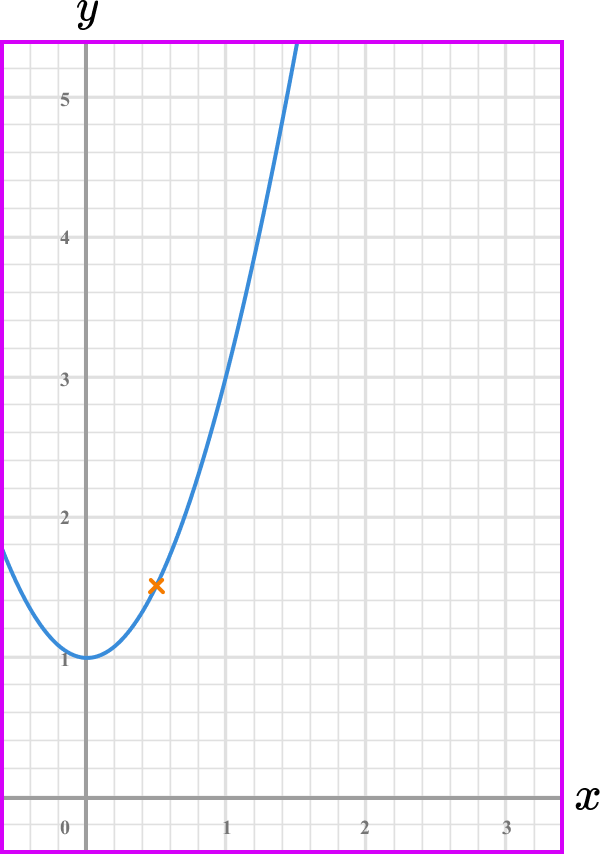
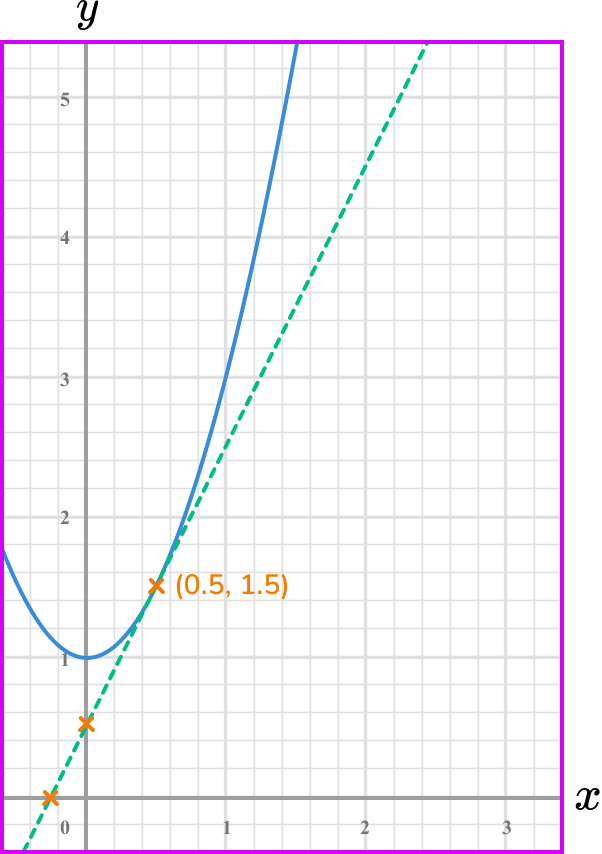
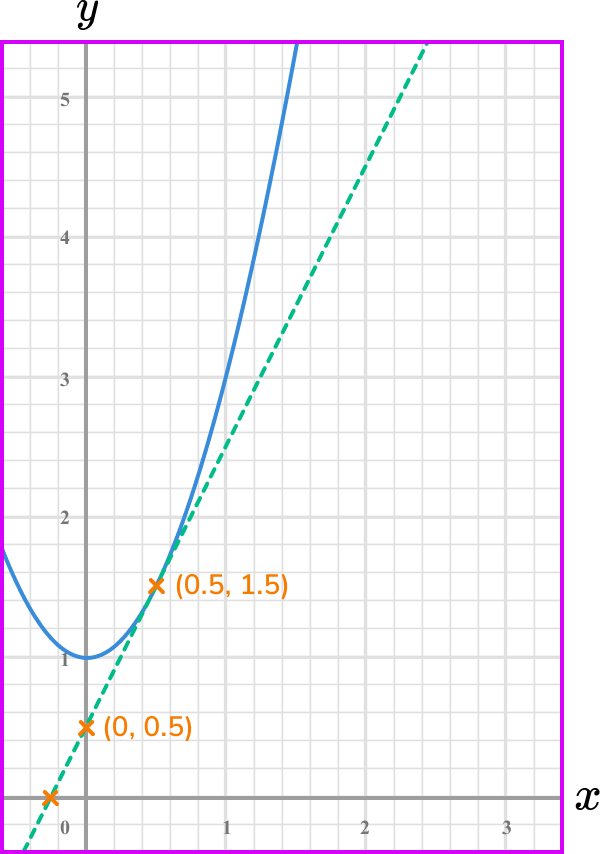
Coordinate one, (0,0.5) .
Coordinate two, (1.5,0.5) .
\text { Gradient }=\frac{\text{change in y}}{\text{change in x}}=\frac{y_{1}-y_{1}}{x_{2}-x_{1}}=\frac{1.5-0.5}{0.5-0}=\frac{1}{0.5}=2
The rate of change at the point x=0.5 is 2.
Note: this is the instantaneous rate of change because you calculated it from a specific point.
Example 5: calculating the average rate of change between two points on a graphed function
What is the average rate of change of the graphed function between the points x=0.5 and x=1?
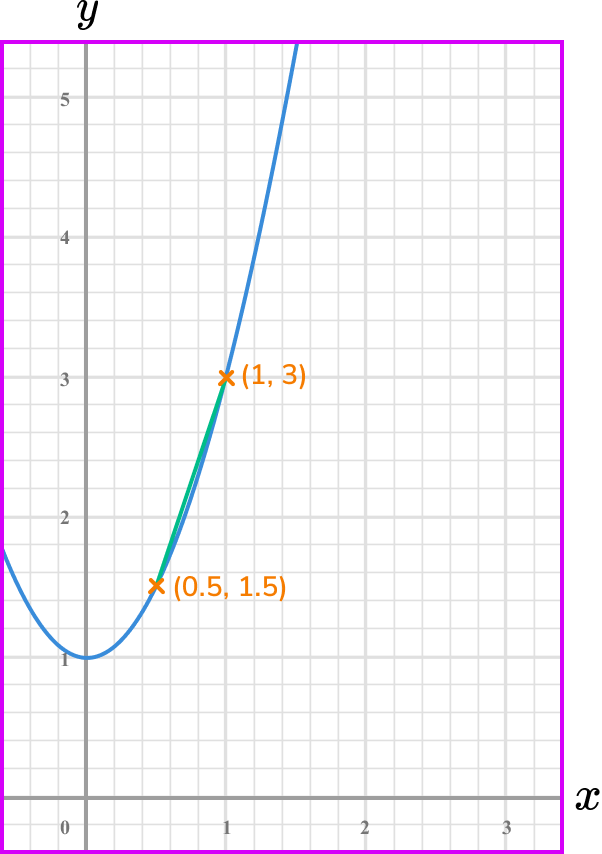
You already have two points so you do not need to find another point on the straight line.
The line you draw is a chord.
Coordinate one, (0.5,1.5) .
Coordinate two, (1,3) .
\text { Gradient }=\frac{\text{change in y}}{\text{change in x}}=\frac{y_{-} y_{1}}{x_{2}-x_{1}}=\frac{3-1.5}{1-0.5}=\frac{1.5}{0.5}=3
The average rate of change between the points x = 0.5 and x = 1.5 is 3.
Note: this is the average rate of change because you calculated it from two points.
Example 6: calculating the rate of change from a graph by drawing a tangent line
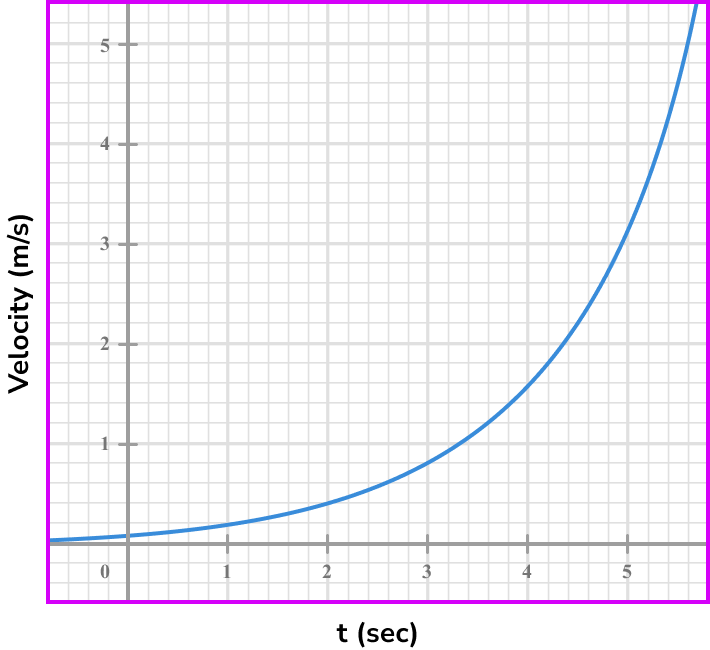
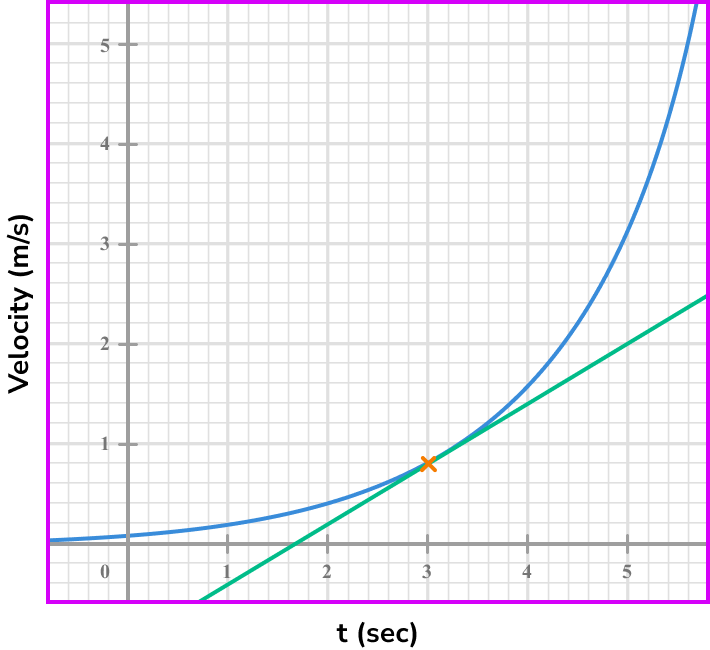
Below is a graph representing the velocity of a cyclist in m/s in relation to the period of time they had been travelling.
Calculate an estimate for the cyclist average rate of change in m/s^2 after they had been travelling for 3 seconds. Give your answer to 2 decimal places.
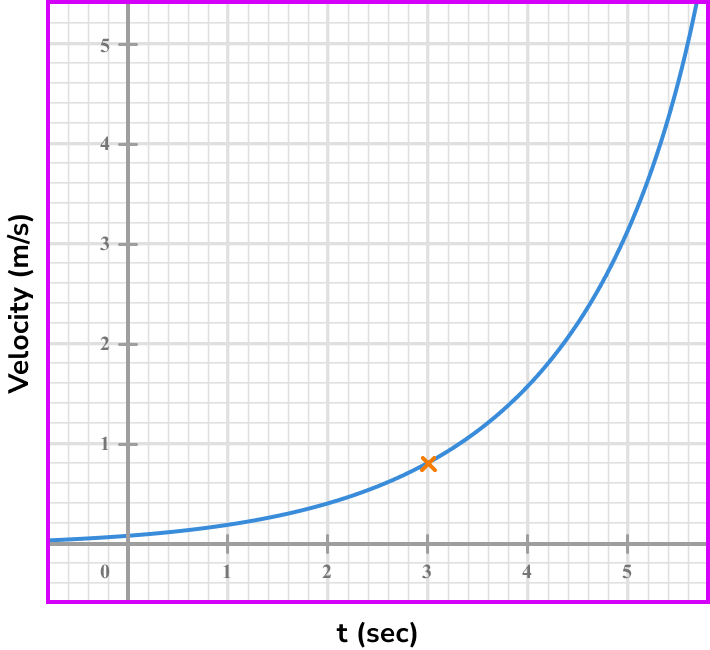
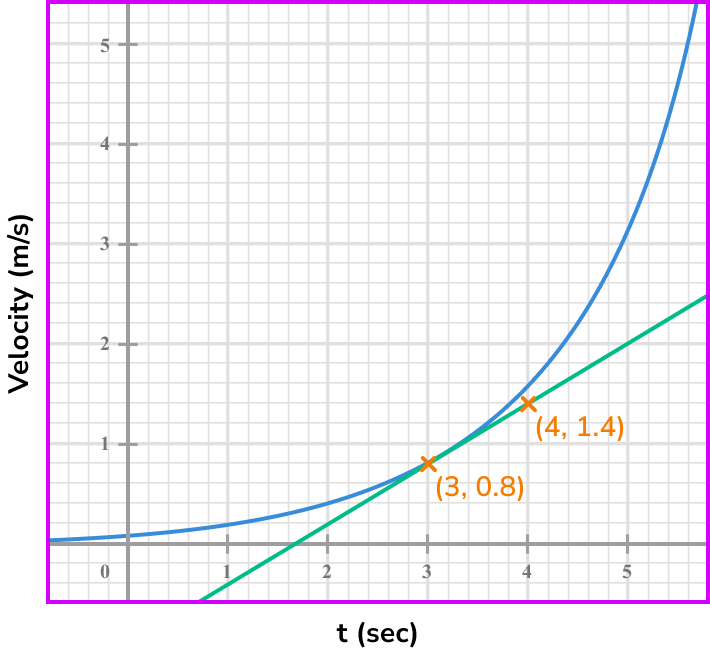
Coordinate one, (3,0.8) .
Coordinate two, (4,1.4) .
\text { Gradient }=\frac{\text{change in y}}{\text{change in x}}=\frac{y_{2}-y_{1}}{x_{2}-x_{1}}=\frac{1.4-0.8}{4-3}=\frac{0.6}{1}=0.6
The rate of change of the cyclist after 3 seconds is 0.6 \ ms^{-2}.
Note: this is the instantaneous rate of change because you calculated it from a specific point or moment in time. For a velocity-time graph this is the acceleration.
Example 7: apply rate of change to a graph (finding minimum and maximum points)
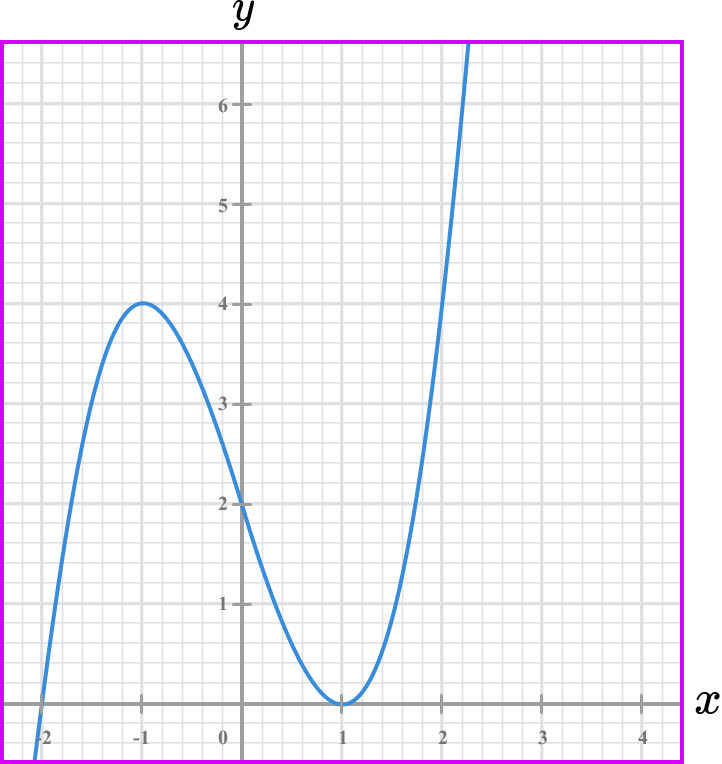
The graph of y = f(x) is drawn below.
At what coordinates does the graph have a rate of change of zero?
The example is asking to find the points where the rate of change is 0. This is a ‘reverse’ of examples 1-6 where you were finding the rate of change at a specific point. Here you are being asked to find the points where the rate of change is 0.
Hint: Notice how the questions says points not point. This indicates to you that there is more than one point where the rate of change is 0.
Earlier on this page you were told a rate of change is zero when the tangent is a horizontal line. This is because at a point where the rate of change is zero the output remains a constant (no change in y ).
Therefore you are looking for points on the graph where the tangent to the curve is a horizontal line. Consider the below diagram to help you before looking at the graph.
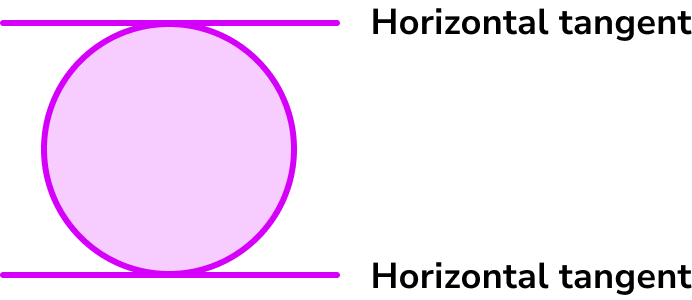
A curve has a horizontal line as a tangent at its ‘maximum point’ and ‘minimum point’.
See below.
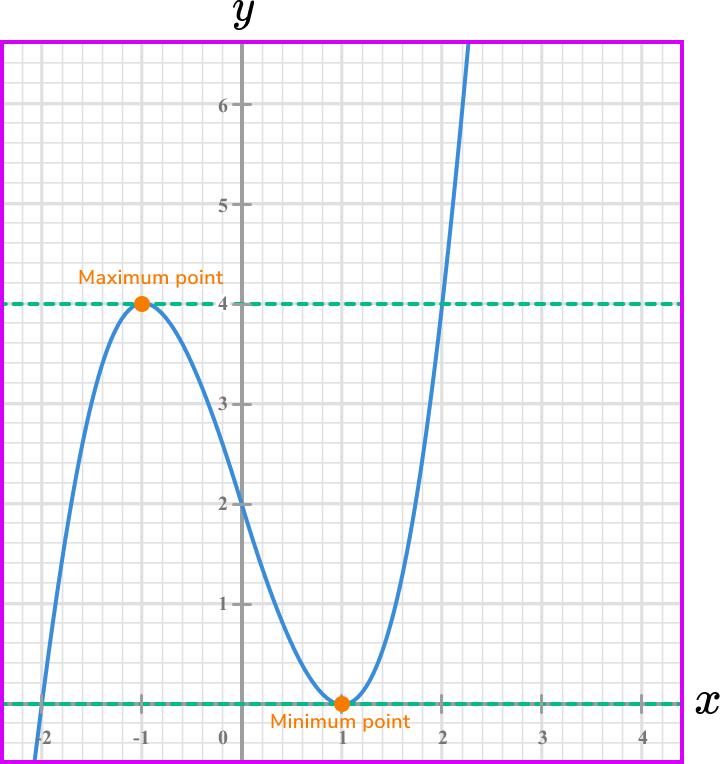
Therefore the points on the curve from the graph where the rate of change is zero is at the points \bf{(-1,4)} and \bf{(1,0).}
Common misconceptions
- Not drawing an accurate tangent line
If you do not draw an accurate tangent line on a curve you will not be finding an accurate rate of change. However the mark schemes for assessment do give you a bit of ‘lee-way’ each side of your answer.
- Incorrect reading of coordinates
Remember the first coordinate refers to the x-axis and the second to the y -axis.
- Not using a ruler to draw the tangent line
Always use a ruler to draw the tangent line.
- Incorrect formula for calculate the gradient of a line
This is something you need to be super confident about for this topic. It is worth recapping beforehand.
\text {Gradient}=\frac{\text{change in y}}{\text{change in x}}=\frac{y_{2}-y_{1}}{x_{2}-x_{1}}
- Gradients may be positive or negative
Remember gradients can be positive or negative. If you are finding speed from a distance-time graph, we can ignore any negative gradients. However, if we are calculating the velocity, then it is important if the gradient is positive or negative.
Practice rate of change questions
1. What is the speed when t=1 ?


Coordinate one, (0,10) .
Coordinate two, (2,40) .

\text { Gradient }=\frac{\text{change in y}}{\text{change in x}}=\frac{40-10}{2-0}=\frac{30}{2}=15
Therefore the speed is 15 \ m/s.
Note: you may have picked different coordinates but you should still get the same gradient.
2. What is the speed when t=9? Give your answer correct to 3 significant figures.

Coordinate one, (7,50) .
Coordinate two, (10,0) .

\text { Gradient }=\frac{\text{change in y}}{\text{change in x}}=\frac{50-0}{7-10}=\frac{50}{-3}=-16.666…
Therefore the speed is 16.7 \ m/s (to 3 sf). Since we have been asked for the speed we can ignore the negative sign.
Note: you may have picked different coordinates but you should still get the same gradient.
3. What is the speed at t=2.5?

Coordinate one, (5,50) .
Coordinate two, (7,50) .

\text { Gradient }=\frac{\text{change in y}}{\text{change in x}}=\frac{50-50}{7-5}=\frac{0}{2}=0
Therefore the speed is 0 \ m/s.
Note: since the line is horizontal when t=2.5 we can just write down that the speed is 0 \ m/s.
4. What is the rate of change between the point when x=4?


Two coordinates on the tangent are
coordinate one, (1,6) , and
coordinate two, (6,12) .
\text {Gradient}=\frac{\text{change in y}}{\text{change in x}}=\frac{12-6}{6-1}=\frac{6}{5}=1.2
Therefore the gradient is 1.2.
Note: you may have picked different coordinates but you should still get the same or similar gradient.
5. What is the average rate of change between the points where x=0 and x=2?

When x=0, \ y=0 .
When x=2, \ y=6 .
Therefore the two coordinates are given to you as
coordinate one, (0,0) , and
coordinate two, (2,6) .

\text {Gradient}=\frac{\text{change in y}}{\text{change in x}}=\frac{6-0}{2-0}=\frac{6}{2}=3
Therefore the gradient is 3.
6. Where does the graph have a rate of change of zero?

The graph has a horizontal tangent, with gradient 0 , when x=6.

Rate of change GCSE questions
1. Look at the graph below.

a) What is the instantaneous rate of change when x=1?
b) What is the instantaneous rate of change when x=2?
c) What is the average rate of change between x=1 and x=2?
(6 marks)
a)
Drawing tangent line at x = 1
(1)
Gradient of 2 (allow \pm \ 0.2 )
(1)
b)
Drawing tangent line at x = 2
(1)
Gradient of 4 (allow \pm \ 0.2 )
(1)
c)
\frac{4-1}{2-1}
(1)
3(1)
2. The graph below gives information about the changing temperature of a hot drink (C) as it cools down over a period of time in seconds (t).

a) What was the initial temperature of the drink?
b) What was the temperature of the drink after 4 seconds?
c) What was the instantaneous rate of change of the drink after 3 seconds?
d) What was the average rate of change of the drink between 2 and 5 seconds?
(6 marks)
a)
7.5
(1)
b)
4.4
(1)
c)
Drawing of a straight line tangent at x=3
(1)
-1(1)
d)
\frac{3.1-6.4}{5-2}
(1)
-1.1 (allow \pm \ 0.2 )
(1)
3. The graph below gives information about the distance (km) covered by a person walking in relation to a period of time in hours (t).

a) How long was it until the person moved?
b) How far had the person travelled after 1 hour?
c) What was the speed of the person walking at 3 hours?
d) What was the average speed of the person walking between 1 and 2 hours?
e) When was the person stationary during the walk?
(7 marks)
a)
0.4 hours (allow \pm \ 0.05 )
(1)
b)
3 \ km
(1)
c)
Drawing of a straight line tangent at x=3
(1)
3 (allow \pm \ 0.2 )
(1)
d)
\frac{4-3}{2-1}
(1)
1(1)
e)
At 2 hours
(1)
Allow t=2
(1)
Learning checklist
You have now learned how to:
The next lessons are
Still stuck?
Prepare your KS4 students for maths GCSEs success with Third Space Learning. Weekly online one to one GCSE maths revision lessons delivered by expert maths tutors.

Find out more about our GCSE maths tuition programme.