GCSE Tutoring Programme
Our chosen students improved 1.19 of a grade on average - 0.45 more than those who didn't have the tutoring.
In order to access this I need to be confident with:
Coordinates maths Line graph Speed, distance time Gradients of a lineThis topic is relevant for:

Distance Time Graph
Here we will learn about distance-time graphs, including how to interpret and construct them.
You can also download the following free distance time graph resources suitable for those following Edexcel, AQA or OCR exam boards:
What are distance time graphs?
Distance-time graphs are graphs that show the distance an object or person has travelled against time. They can also be referred to as travel graphs.
A distance-time graph will show the distance (in metres, kilometres, miles etc.) on the vertical axis ( y -axis) and the time (in seconds, minutes, hours etc.) on the horizontal axis ( x -axis).
The distance-time graphs we will look at on this page will all be drawn using straight lines.
Straight lines on a distance-time graph represent constant speeds. To find the speed from a distance-time graph you will need to be able to find the gradient of the straight lines.
The steeper the gradient, the faster the object is travelling.
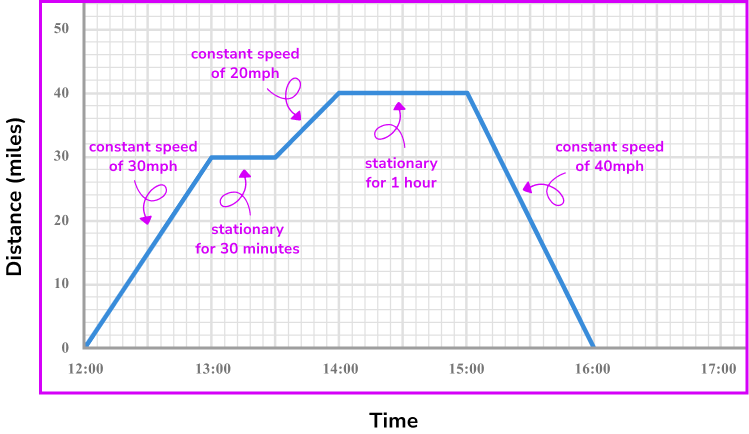
One way of calculating the speed from a distance-time graph is to think about how far the object has travelled in one time unit.
For example, if an object has travelled 20 miles in 30 minutes, it would travel 40 miles in one hour, therefore the speed is 40 \ mph.
What are distance time graphs?

How to read distance time graphs
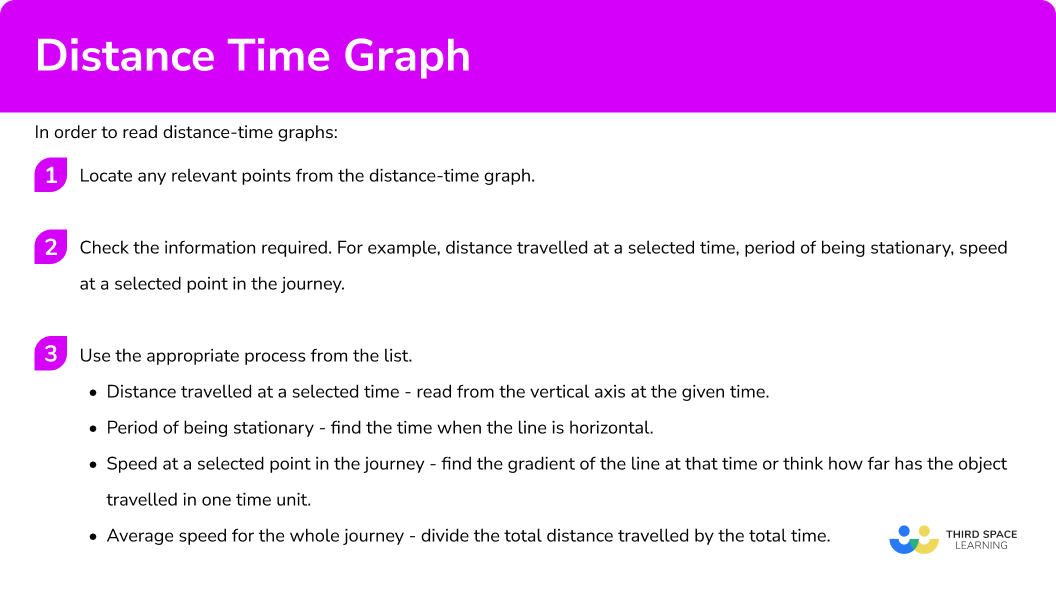
In order to read distance-time graphs:
- Locate any relevant points from the distance-time graph.
- Check the information required. For example, distance travelled at a selected time, period of being stationary, speed at a selected point in the journey.
- Use the appropriate process from the list.
- Distance travelled at a selected time – read from the vertical axis at the given time.
- Period of being stationary – find the time when the line is horizontal.
- Speed at a selected point in the journey – find the gradient of the line at that time or think how far has the object travelled in one time unit.
- Average speed for the whole journey – divide the total distance travelled by the total time.
Explain how to read distance time graphs
Distance time graph worksheet
Get your free distance time graph worksheet of 20+ questions and answers. Includes reasoning and applied questions.
DOWNLOAD FREE Distance time graph worksheet
Get your free distance time graph worksheet of 20+ questions and answers. Includes reasoning and applied questions.
DOWNLOAD FREERelated lessons on rates of change
Distance time graph is part of our series of lessons to support revision on rates of change. You may find it helpful to start with the main rate of change lesson for a summary of what to expect, or use the step by step guides below for further detail on individual topics. Other lessons in this series include:
Reading distance time graphs examples
Example 1: finding the distance travelled from a distance-time graph
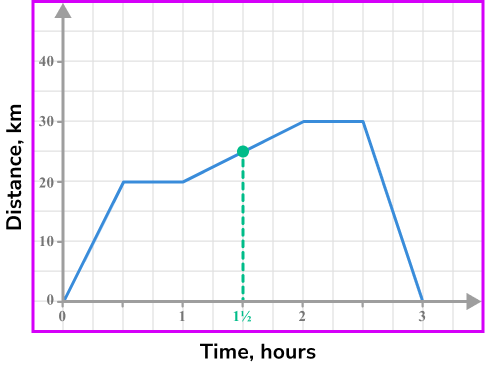
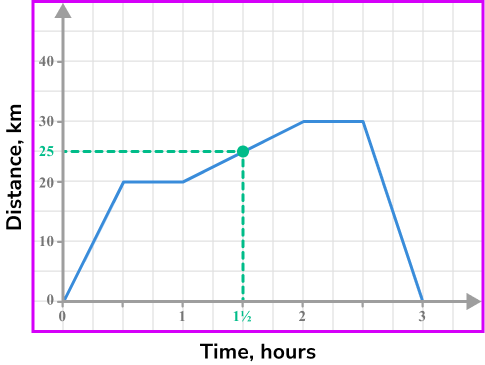
The distance-time graph shows the journey of a person from their home.
How far away from their home are they after 1 hour and 30 minutes?

- Locate any relevant points from the distance-time graph.
Locate 1 hour 30 minutes on the horizontal axis and go up to the graph line.
2Check the information required. For example, distance travelled at a selected time, period of being stationary, speed at a selected point in the journey.
We require the distance travelled at that time.
3Use the appropriate process from the list. Distance travelled at a selected time – read from the vertical axis at the given time.
Reading from the vertical axis gives a distance of 25 \ km.
Example 2: finding stationary periods from a distance-time graph
The distance-time graph shows the journey of a person from their home.
At what time did the person first stop and for how long?

Locate the points in the graph when the line changes.
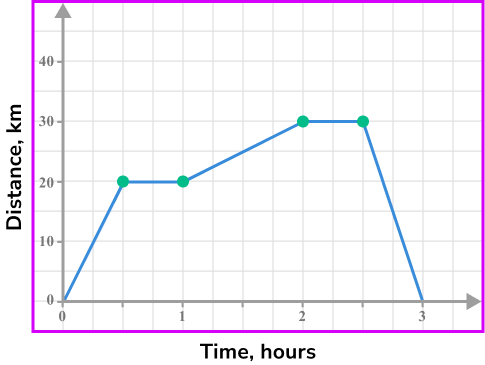
We required the first period that the person was stationary.
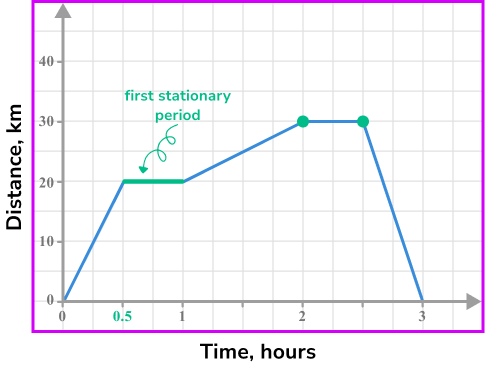
The person was first stationary after 30 minutes, and remained stationary for 30 minutes.
Example 3: finding the speed from a distance-time graph
The distance-time graph shows the journey of a person from their home.
The graph shows the person taking a bus to a cafe. They then stopped at the cafe for a drink and snack. They then ran for an hour, before taking a taxi home.
What speed was the person travelling during the taxi journey home?

The journey home began after 2 hours 30 minutes and finished at 3 hours.
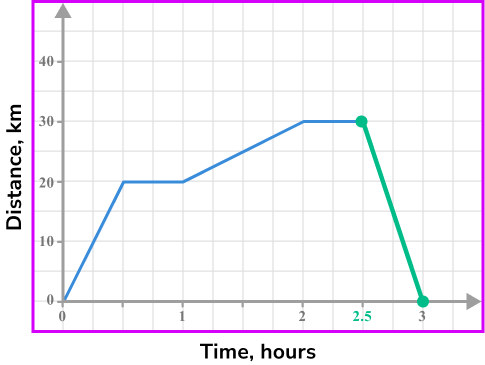
We require the speed between 2.5 hours and 3 hours.
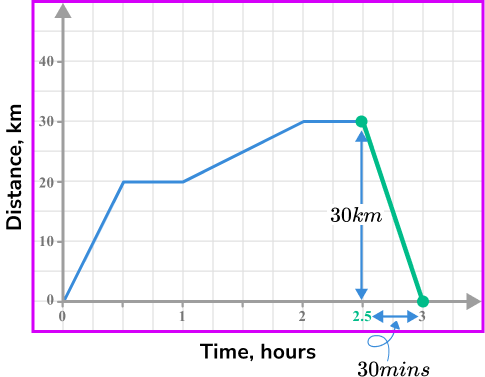
The person travelled 30 \ km in 30 minutes, this would mean they would travel 60 \ km in 1 hour, therefore, their speed was 60 \ km/h.
We could also find this using the speed, distance, time formula,
\text{Speed}=\frac{\text{distance}}{\text{time}}=\frac{30}{0.5}=60\,\text{km/h}
(it is important to use 0.5 hours and not 30 minutes for the time).
Or we could have found the gradient of the line,
\frac{\text{Change in }y}{\text{Change in }x}=\frac{30}{0.5}=60.
Example 4: finding the average speed of the whole journey from a distance-time graph
The distance-time graph shows the journey of a person from their home.
The graph shows the person taking a bus to a cafe. They then stopped at the cafe for a drink and snack. They then ran for an hour, before taking a taxi home.
What was the person’s average speed for their whole journey?
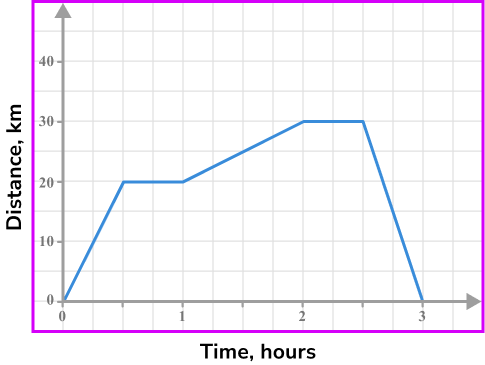
We need to find the total distances travelled.
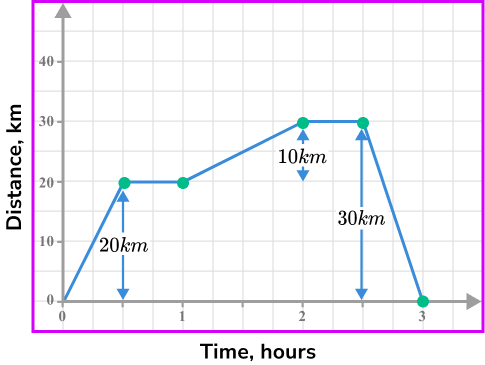
We required the average speed for the whole journey.
It is important to add all the distances travelled and find the time for the whole journey including any periods when the person was stationary.
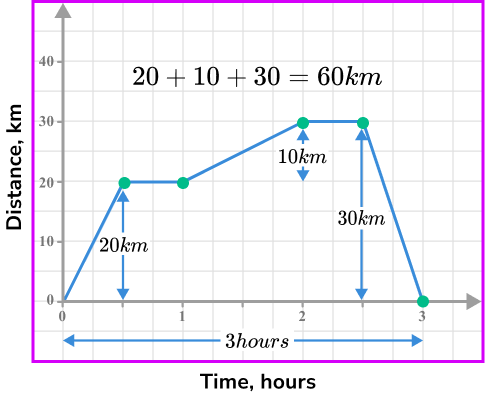
\text{Average speed =}\frac{\text{total distance}}{\text{total time}}=\frac{60}{3}=20 \ \text{km/h.}
How to draw distance time graphs
In order to draw distance-time graphs:
- Draw/label the horizontal axis for the time and a vertical axis for the distance.
- Use the information about the distance or speed of the object to plot points on the graph.
- Join the points with straight line segments.
Explain how to draw distance time graphs
Drawing distance time graph examples
Example 5: drawing a distance-time graph from information about distance at given times
A car starts from home and travels at a constant speed for 30 minutes until it is 20 miles from home. It then stops for 1 hour before returning home, travelling at a constant speed for 45 minutes.
Draw a distance-time graph to represent the journey.
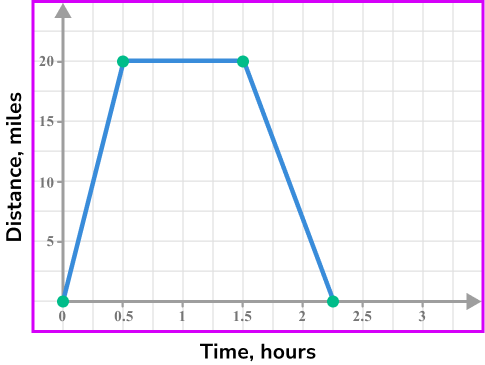
The car gets no further than 20 miles from home and the journey takes a total of 2 hours 15 minutes. Draw and label the vertical axis from 0 to 20 miles and the horizontal axis from 0 to 3 hours.
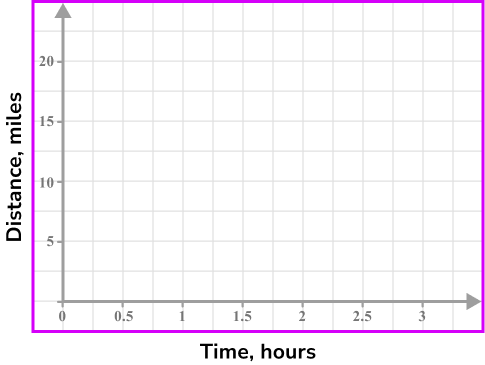
The car starts at home, so plot the point (0, 0).
After 30 minutes the car has travelled 20 miles, so plot the point (0.5,20).
It remains stationary for 1 hour, so plot the point (1.5,20).
It then returns home after 45 minutes, so plot the point (2.25,0).

Example 6: drawing a distance-time graph from information about speed at given times
A car leaves home at 12:00 and sets off at a constant speed of 30 \ mph.
At 12:30 the car stops for 10 minutes. It then returns home at a speed of 45 \ mph.
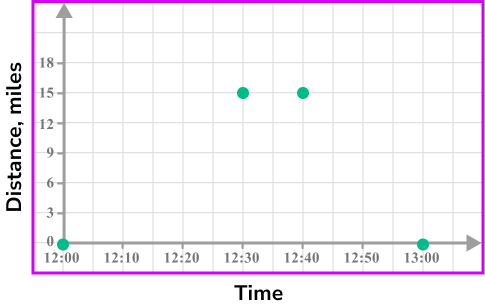
Draw a distance-time graph to represent the journey.
Draw the horizontal and vertical axes, but we will finish labelling them once we know more information about the maximum distance and times taken based on the information provided about the speed.
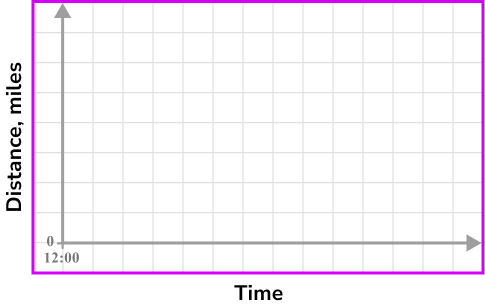
Plot (12:00,0).
The car travels at a speed of 30 \ mph between 12:00 and 12:30. \ 30 \ mph means it would travel 15 miles in 30 minutes, so we will need to plot (12:30,15).
The car stops for 10 minutes, so we will need to plot (12:40,15).
The car returns home at a speed of 45 \ mph.
You can use \text{time =}\frac{\text{distance}}{\text{speed}}=\frac{15}{45}=\frac{1}{3} \ hour, so it will take 20 mins to travel 15 miles.
We will need to plot (13:00,0).
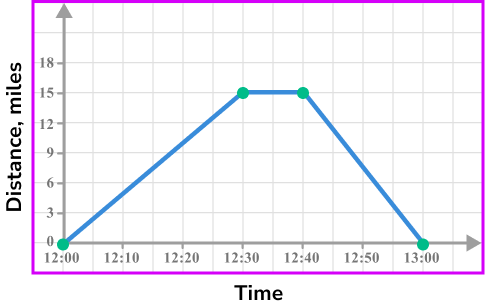
Choose appropriate scales for the axes and plot the points.
Example 7: drawing a distance-time graph from information about distance and speed at given times
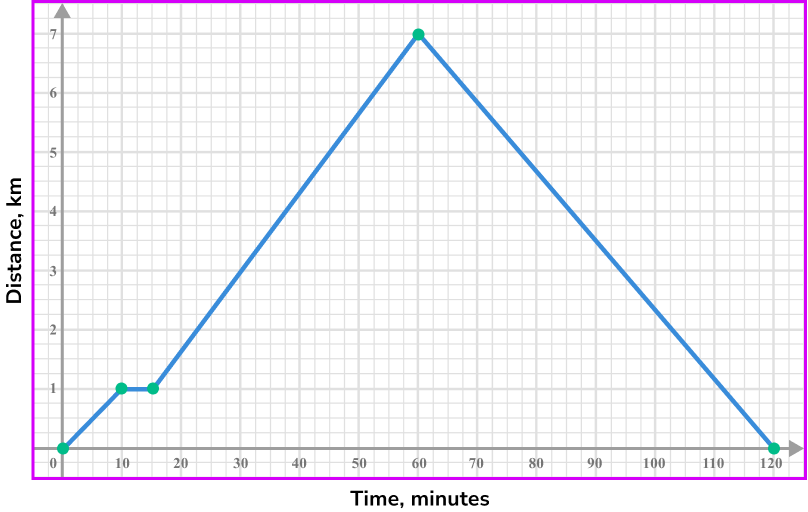
A person walks from home for 10 minutes to a distance of 1 \ km. They stop for 5 minutes, and then run at a speed of 8 \ km/h away from home. After 45 minutes they immediately change direction and run towards home at a speed of 7 \ km/h.
Draw a distance-time graph to represent their journey.
Draw the horizontal and vertical axes, but we will finish labelling them once we know more information about the maximum distance and times taken based on the information provided about the speed.
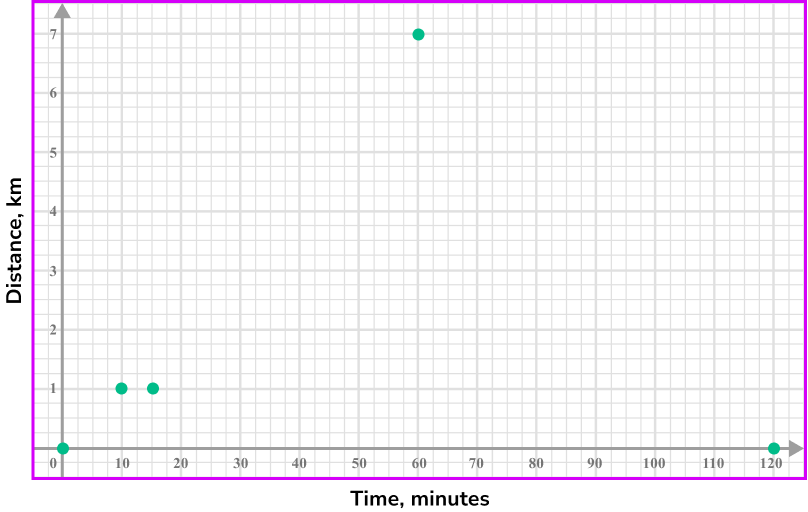
The person starts from home, so we will need to plot (0, 0).
The person walks from home for 10 minutes to a distance of 1 \ km, so we will need to plot (10,1).
They stop for 5 minutes, so we will need to plot (15,1).
Then run at a speed of 8 \ km/h away from home for 45 minutes. 45 minutes = 0.75 hours. Using \text{distance = speed}\times \text{time = }8\times 0.75=6 \ km.
We will need to plot (60,7).
They immediately change direction and run towards home at a speed of 7 \ km/h, they have 7 \ km to run which will take 60 minutes, so we will need to plot (120,0)
Choose appropriate scales for the axes and plot the points.
Common misconceptions
- Confusing distance-time graphs with speed-time graphs
It is common for students to confuse distance-time graphs with speed-time graphs. This may result in students just reading a value from the vertical axis instead of calculating the gradient of a distance-time graph to find a speed.
- Calculating average speed incorrectly
The average speed could be incorrectly calculated by finding the mean of the different speeds during a journey. Another incorrect method is to only use the periods when the object is moving and to forget to include the periods when it is stationary.
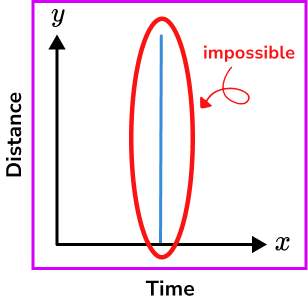
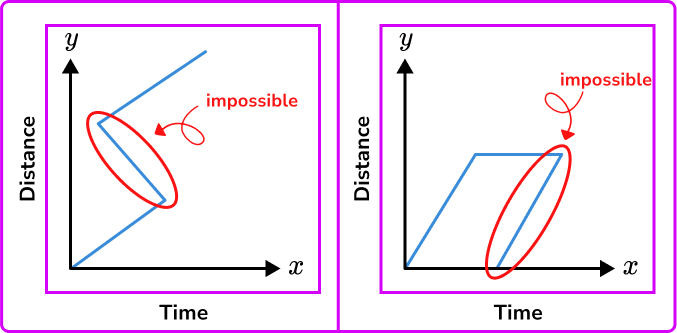
- Drawing impossible distance-time graphs
There are some graphs that would be impossible for a distance-time graph.
For example, vertical lines would represent an infinite speed.
Objects travelling back in time.
Practice distance time graph questions
1. A horizontal line on a distance-time graph shows that …
The object is accelerating.

The object is stationary.

The object is moving at a constant speed.
The object is decelerating.
A horizontal line shows the object is covering zero distance for a period of time.
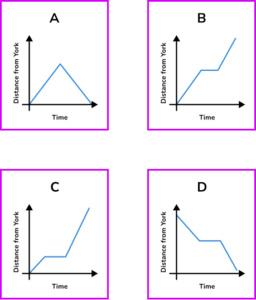
2. Which of the distance-time graphs shows an object moving at the greatest speed?
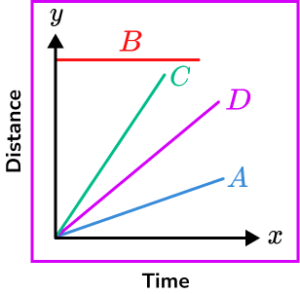
A
B
C
D
Greater speeds have a steeper gradient.
3. What is the speed of the object shown in this distance-time graph?
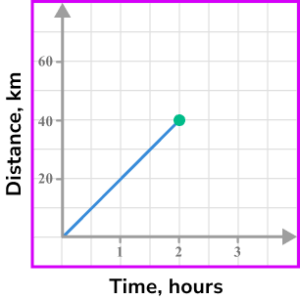
The object travels 40 \ km in 2 hours.
4. What is the speed of the object shown in this distance-time graph?
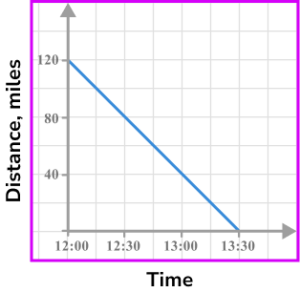
The object travels 120 miles in 1.5 hours, so it must travel 80 miles in 1 hour.
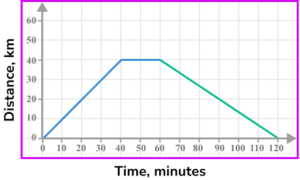
5. An object travels away from home at a speed of 60 \ km/h for half an hour. It then stops and remains stationary for a quarter of an hour before returning home at a speed of 40 \ km/h. Select the correct distance-time graph for the journey.
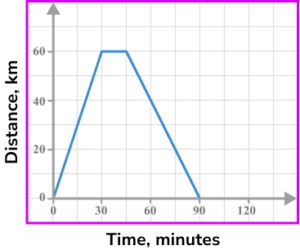
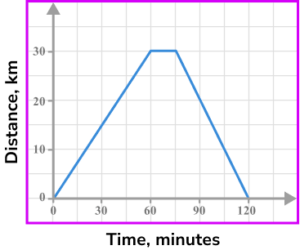
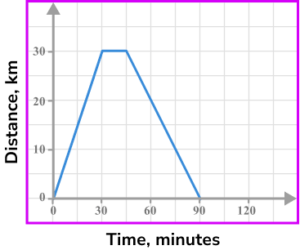
60 \ km/h for 30 minutes gives a distance of 30 \ km. \ 0 \ km at 40 \ km/h will take 45 minutes.
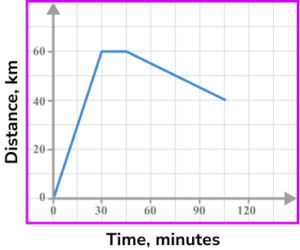
6. The image shows part of a distance-time graph.
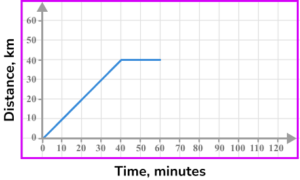
The last part of the journey is for the object to return home at a speed of 80 \ km/h. Which is the correct completed distance-time graph?

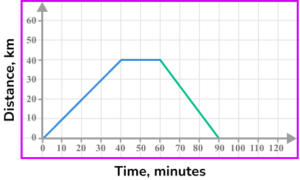
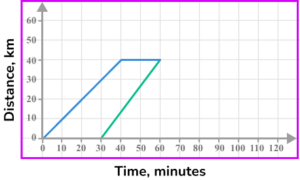
40 \ km at 80 \ km/h will take 30 minutes. The journey ends after 90 minutes.
Distance time graph GCSE questions
1. A salesperson was driving on a motorway from London to York. He stopped at a motorway service station halfway into his journey.
Which of the distance-time graphs could represent his journey?
(1 mark)
B
(1)
- 2. The distance-time graph shows part of a journey Sarah took on a bike ride.
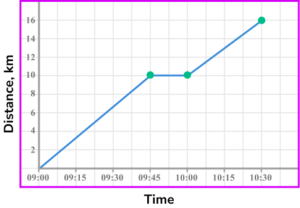
(a) What did Sarah do between 09:45 and 10:00?
(b) What was Sarah’s speed between 10:00 and 10:30, in km/h?
(3 marks)
(a)
She stopped moving/was stationary.
(1)
(b)
Process of dividing 6 \ km by 0.5 hours or equivalent method.
(1)
12 \ km/h(1)
3. The distance-time graph shows the first part of a journey of a person on a shopping trip.
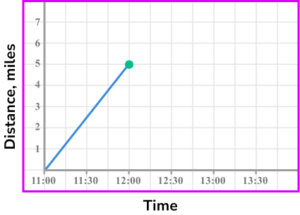
The person walked from their home to the shop and arrived at 12:00.
The person stays in the shop for 15 minutes and then catches a bus home.
The bus stopped outside their door and travelled at an average speed of 20 miles per hour.
(a) At what speed did they walk to the shops? Give your answer in miles per hour.
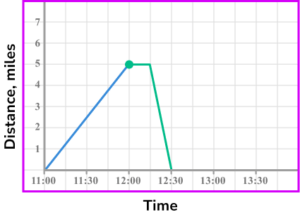
(b) Complete the distance-time graph showing the remaining parts of their journey.
(4 marks)
(a)
5 \ mph
(1)
(b)
Horizontal line to (12:15, 5).
(1)
Process to find the time for the bus ride ( 15 minutes).
(1)
Line from (12:15, 5) to (12:30,0).
(1)
Learning checklist
You have now learned how to:
The next lessons are
Still stuck?
Prepare your KS4 students for maths GCSEs success with Third Space Learning. Weekly online one to one GCSE maths revision lessons delivered by expert maths tutors.

Find out more about our GCSE maths tuition programme.