GCSE Tutoring Programme
Our chosen students improved 1.19 of a grade on average - 0.45 more than those who didn't have the tutoring.
In order to access this I need to be confident with:
Types of graphs Coordinates maths Drawing straight line graphsThis topic is relevant for:

Conversion Graphs
Here we will learn about conversion graphs, including using them to convert units or currency, and using information to draw a conversion graph.
You can also download the following free conversion graphs resources suitable for those following Edexcel, AQA or OCR exam boards:
What are conversion graphs?
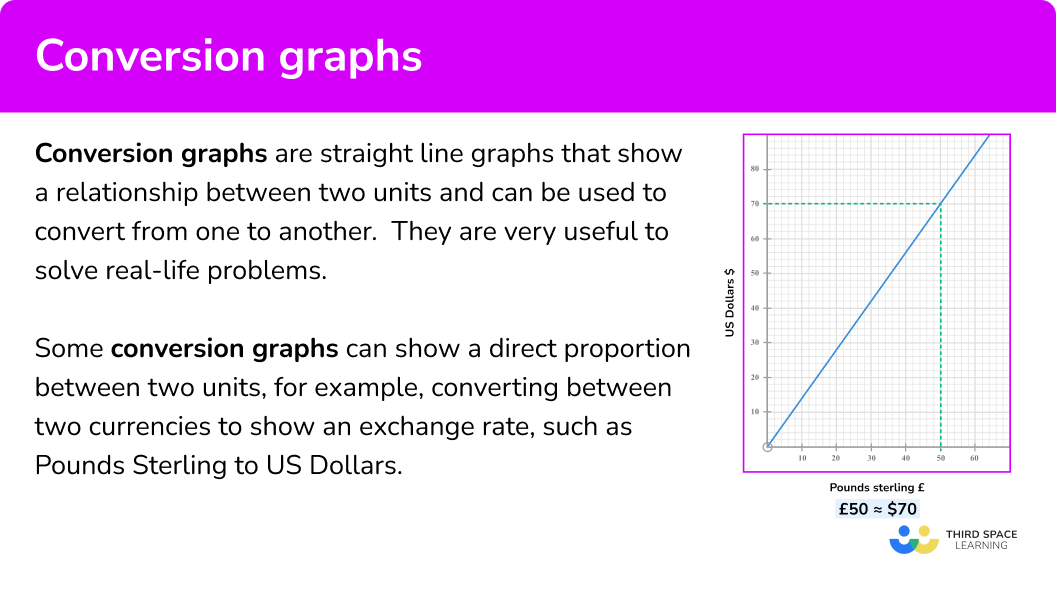
Conversion graphs are straight line graphs that show a relationship between two units and can be used to convert from one to another. They are very useful to solve real-life problems.
See also: Gradient of a line
Some conversion graphs can show a direct proportion between two units, for example, converting between two currencies to show an exchange rate, such as pounds sterling (British pounds) to US dollars.

The conversion between British pounds and American dollars is also an example of direct proportion as £0 is equal to \$0.
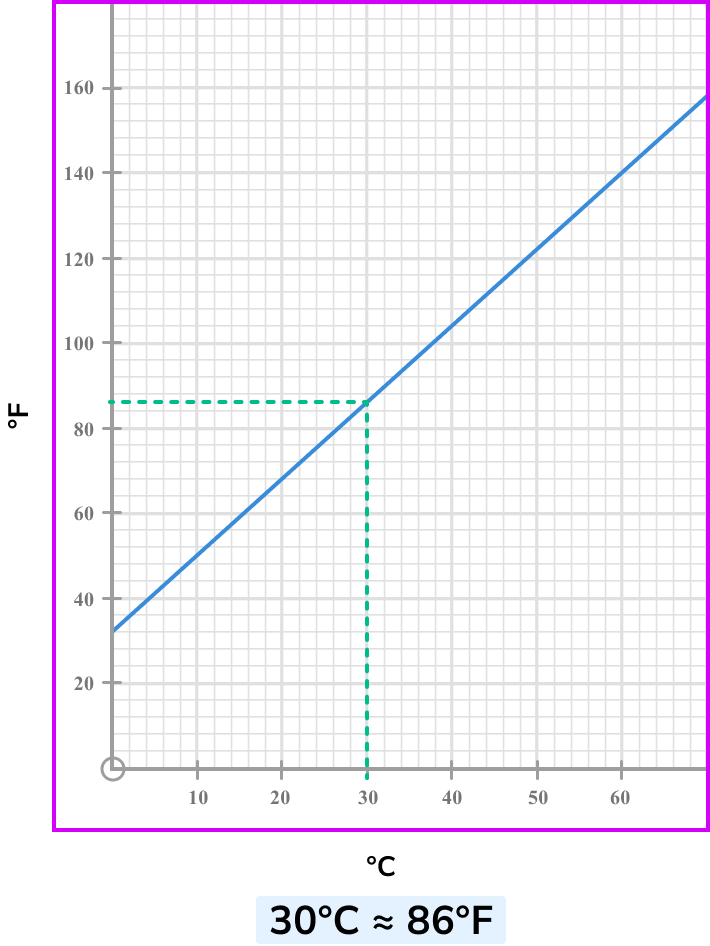
The conversion between degrees celsius and degree fahrenheit is not a direct proportion because 0^{o}C is not equal to 0^{o}F.
We can use horizontal and vertical lines to the conversion graph to convert between the units.
Conversion graphs can be used to convert between metric and imperial units, they can be used to calculate costs of taxi journeys or the cost of energy usage.
Step-by-step guide: Exchange rates
What are conversion graphs?
How to use conversion graphs
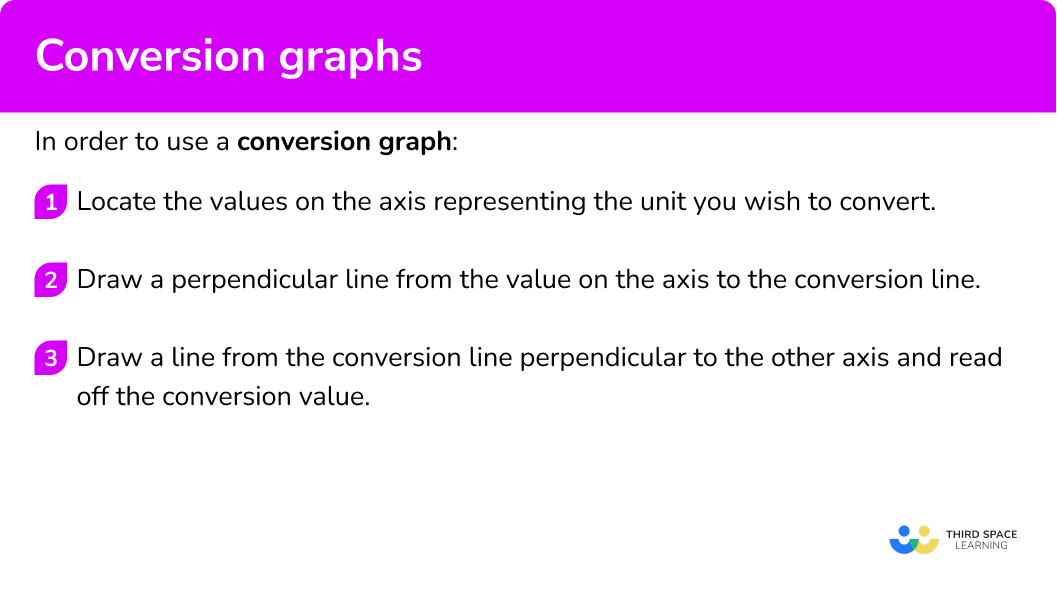
In order to use a conversion graph:
- Locate the values on the axis representing the unit you wish to convert.
- Draw a perpendicular line from the value on the axis to the conversion line.
- Draw a line from the conversion line perpendicular to the other axis and read off the conversion value.
Explain how to use conversion graphs
Conversion graphs worksheet
Get your free conversion graphs worksheet of 20+ questions and answers. Includes reasoning and applied questions.
DOWNLOAD FREE Conversion graphs worksheet
Get your free conversion graphs worksheet of 20+ questions and answers. Includes reasoning and applied questions.
DOWNLOAD FREEConversion graphs examples
Example 1: converting currency using a conversion graph
The graph shows the conversion between pound sterling, £, to US dollars, \$.
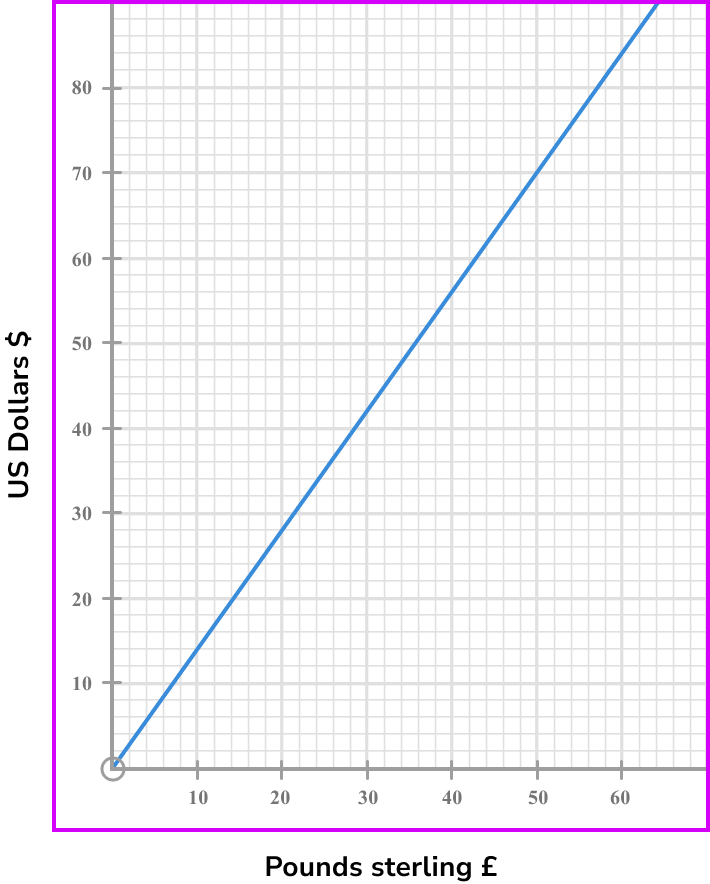
Use the graph to convert \$60 to pounds, £.
- Locate the values on the axis representing the unit you wish to convert.
US dollars are represented by the vertical axis.
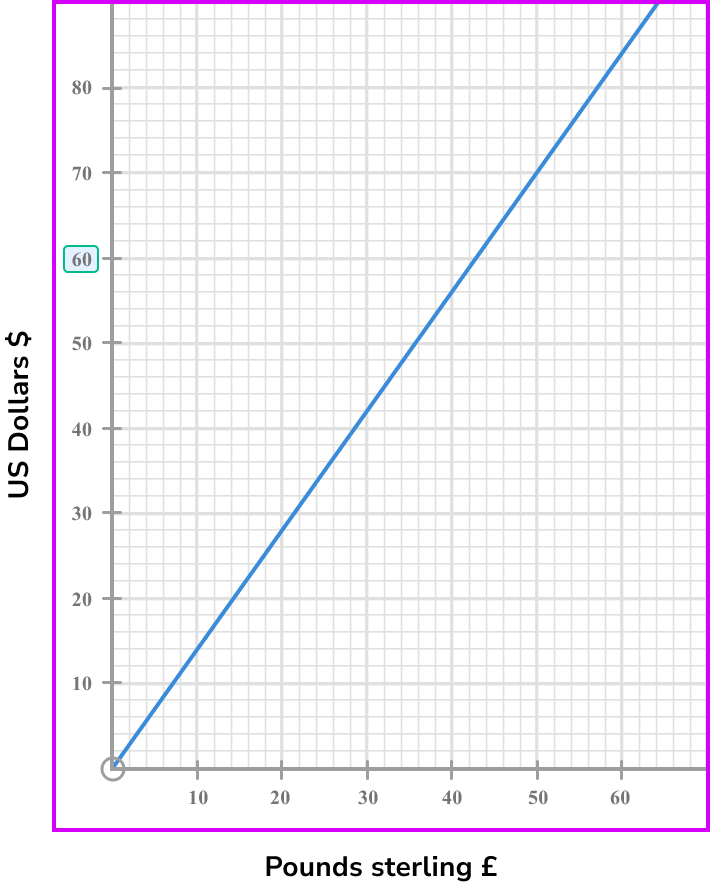
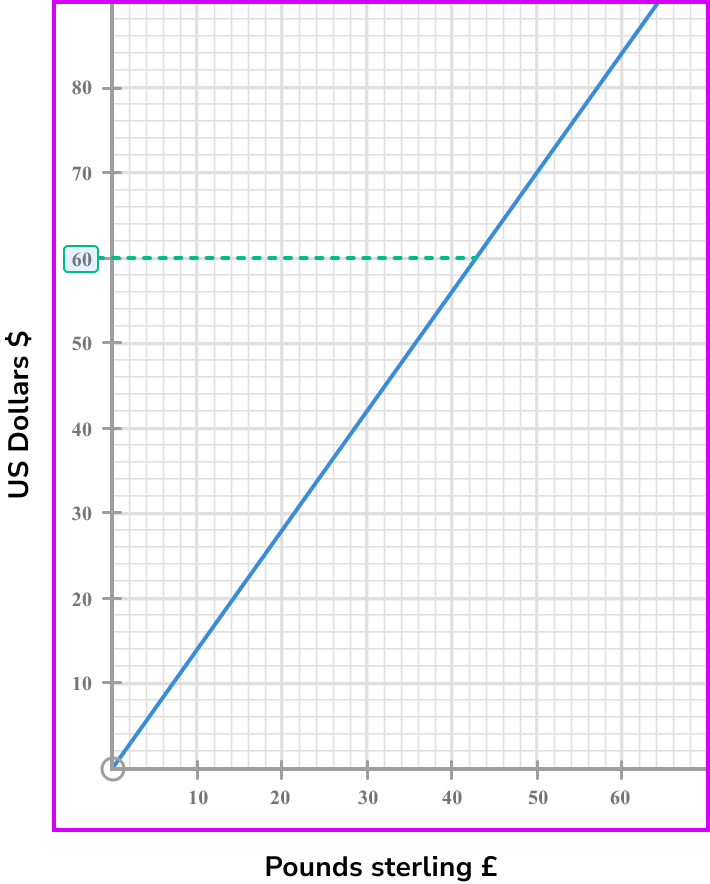
2Draw a perpendicular line from the value on the axis to the conversion line.
Draw a horizontal line from \$60 to the conversion line.
3Draw a line from the conversion line perpendicular to the other axis and read off the conversion value.
Now draw a vertical line to the horizontal axis and read off the value.
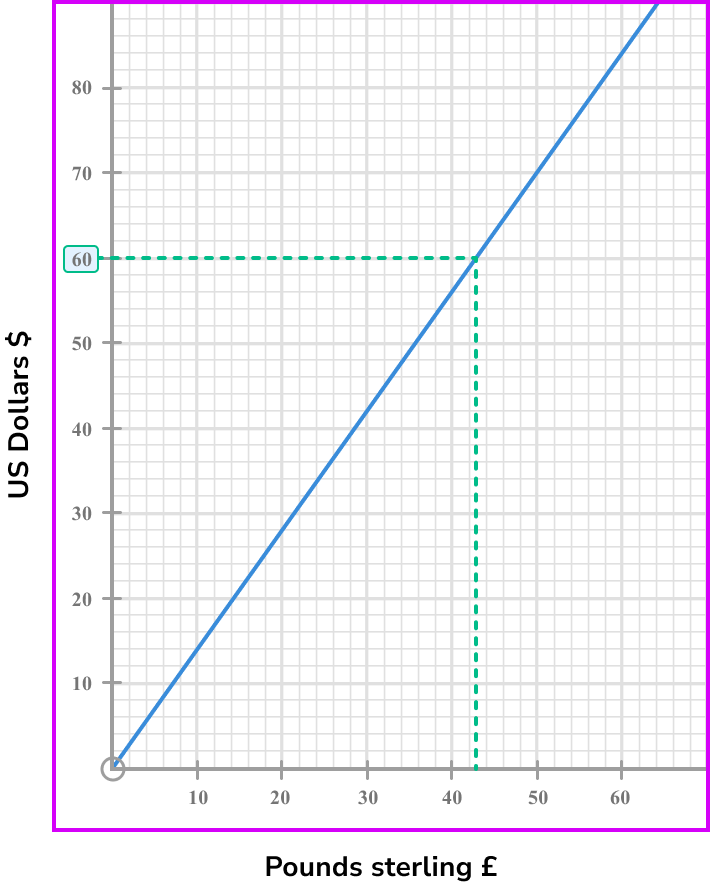
\$60 is approximately £43.
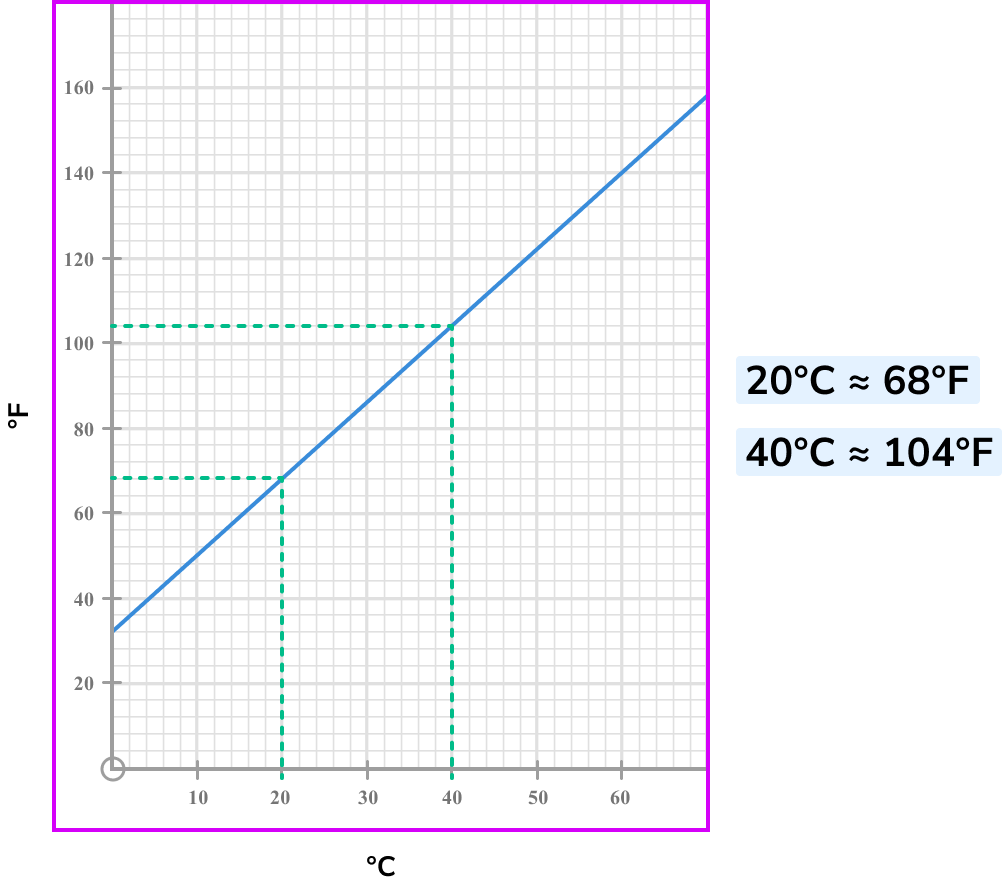
Example 2: converting Celsius to Fahrenheit
The graph shows the conversion between degrees Celsius to degrees Fahrenheit.
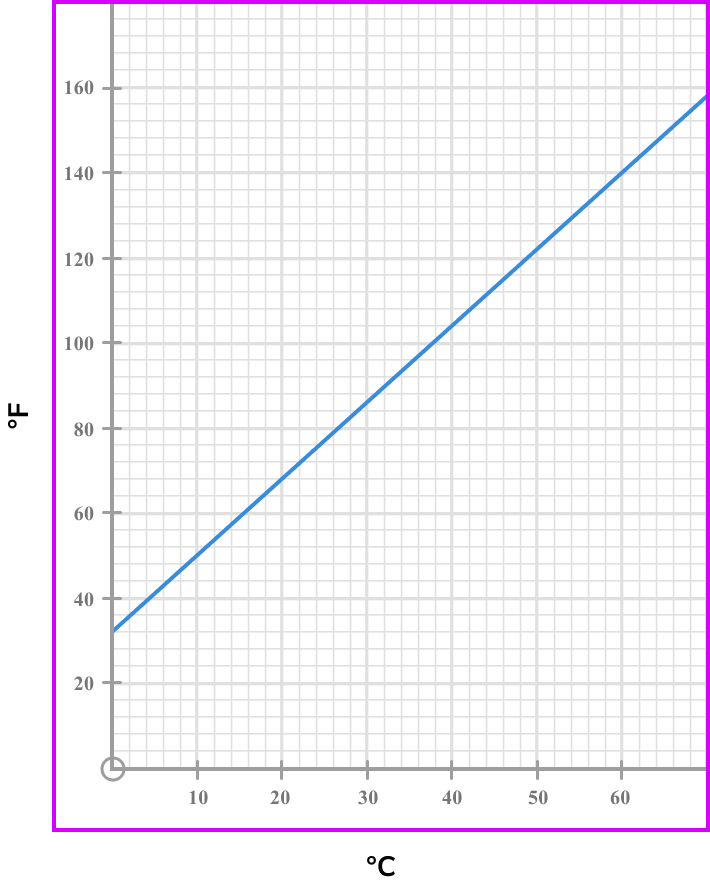
Use the graph to convert 20^{o}C to ^{o}F.
^{o}C are represented by the horizontal axis.
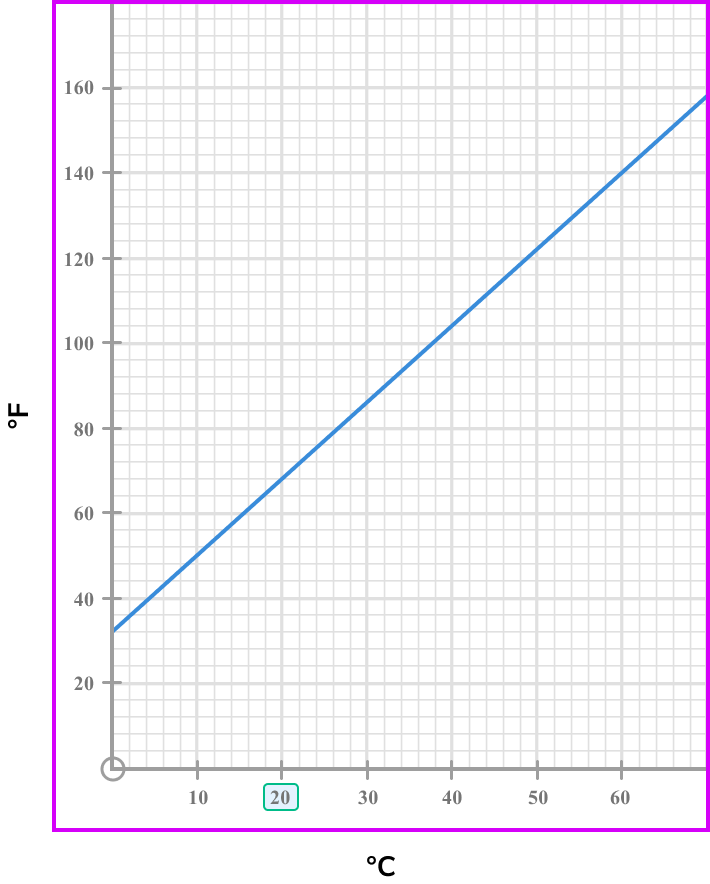
Draw a vertical line from 20^{o}C to the conversion line.
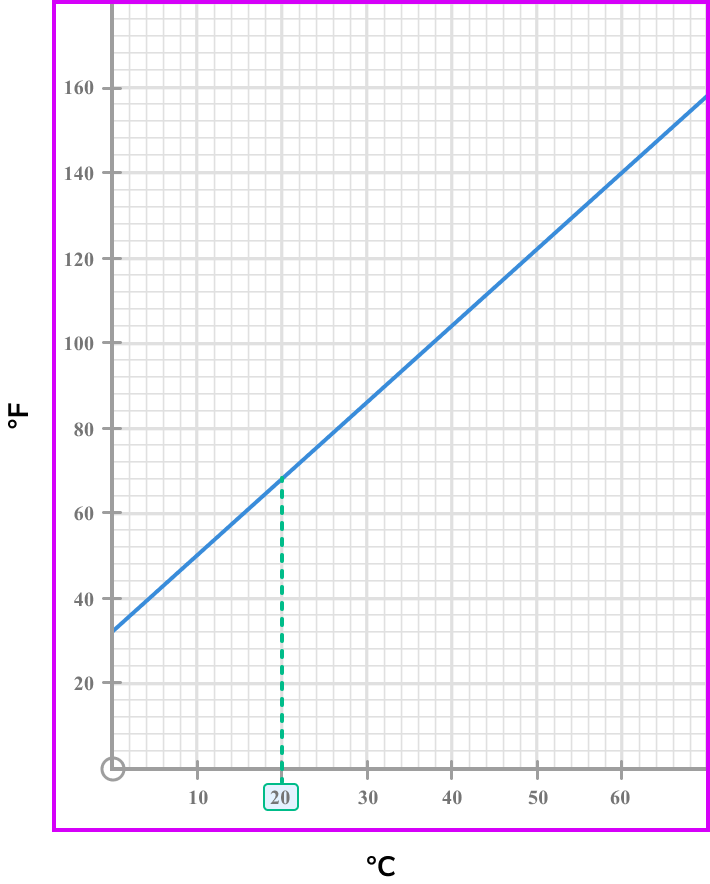
Now draw a horizontal line to the vertical axis and read off the value.

20^{o}C is approximately 68^{o}F.
Example 3: using a conversion graph to estimate larger amounts
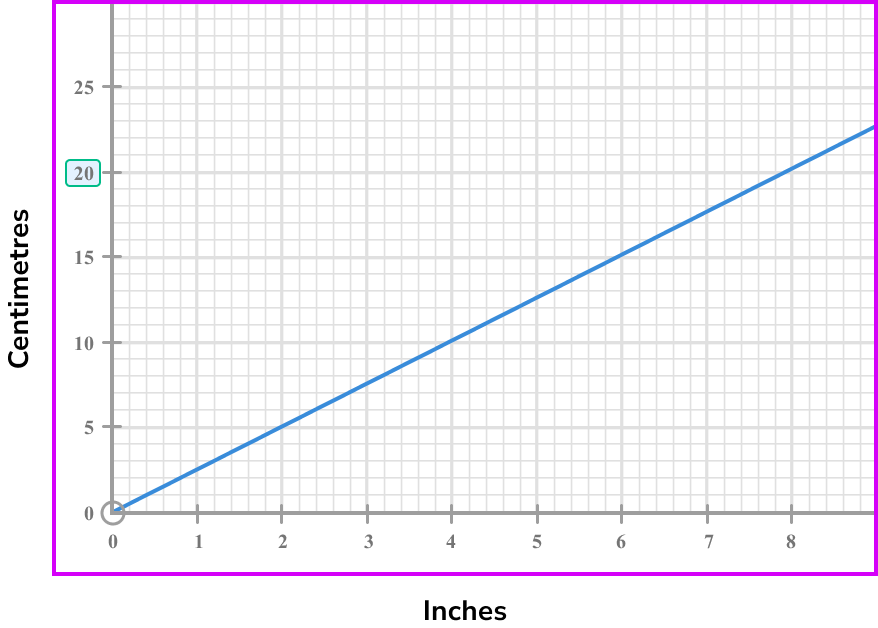
The graph shows the conversion between centimetres and inches.
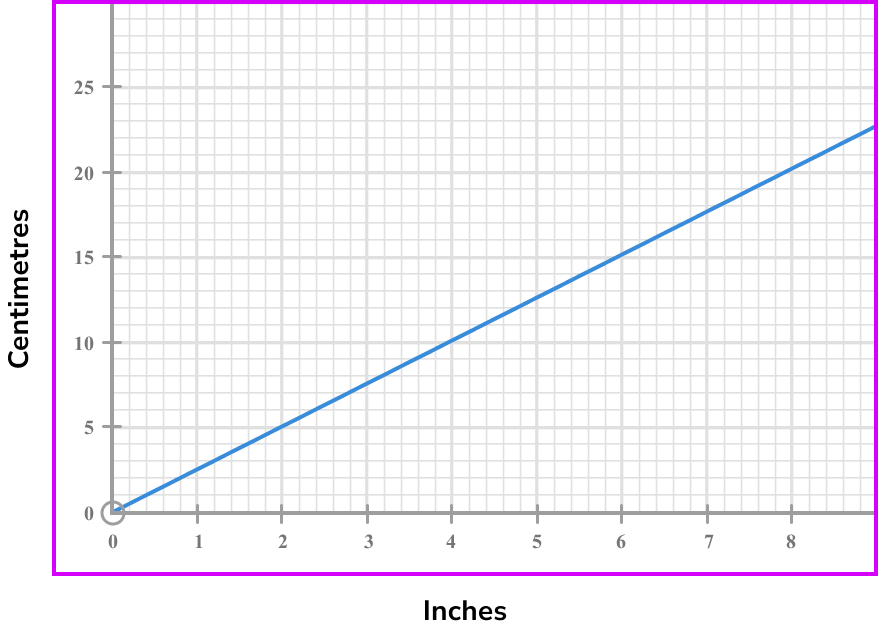
Use the graph to convert 300 centimetres to inches.
Centimetres are represented by the vertical axis, however, the 300 centimetres is not in the range of values available on the vertical axis. Instead, we can use another value that is a factor of 300. It’s best to use the largest one available, so 20 centimetres is a good value to use.
Draw a horizontal line from 20 centimetres to the conversion line.
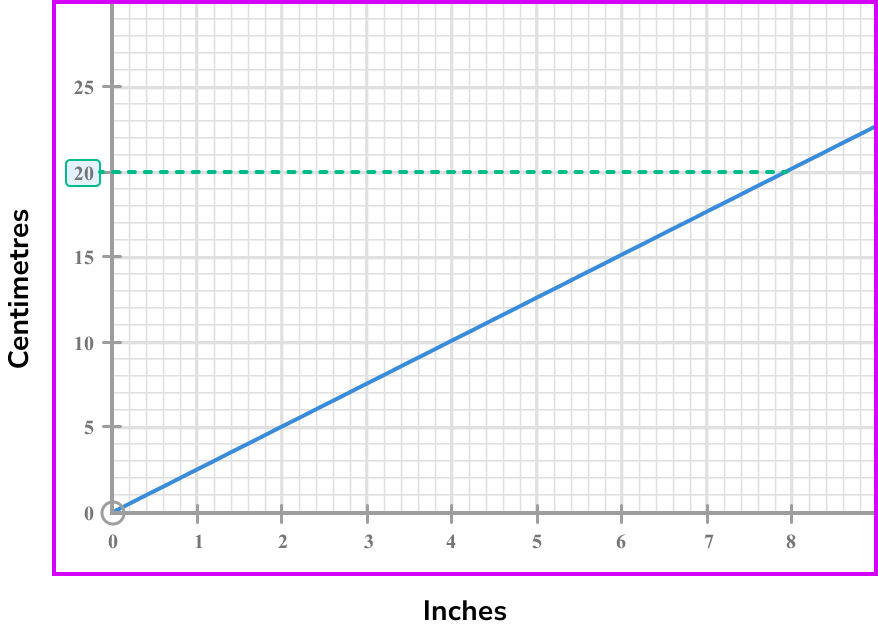
Now draw a vertical line to the horizontal axis and read off the value.

20 centimetres is approximately 7.9 inches
20 \times 15 = 300, so to convert 300 centimetres into inches, we must work out 7.9 \times 15.
This gives 118.5, therefore, 300 centimetres is approximately 118.5 inches.
How to draw conversion graphs
In order to draw a conversion graph:
- Draw axes and choose which units should be represented by the horizontal and vertical.
- Use information provided to plot at least \bf{3} points that represent the conversion between the units. If the units are in direct proportion, the line will go through \bf{(0,0)} .
- Draw a straight line through the points ensuring it is long enough to span the width and height of the axes.
Explain how to draw conversion graphs
Drawing conversion graph examples
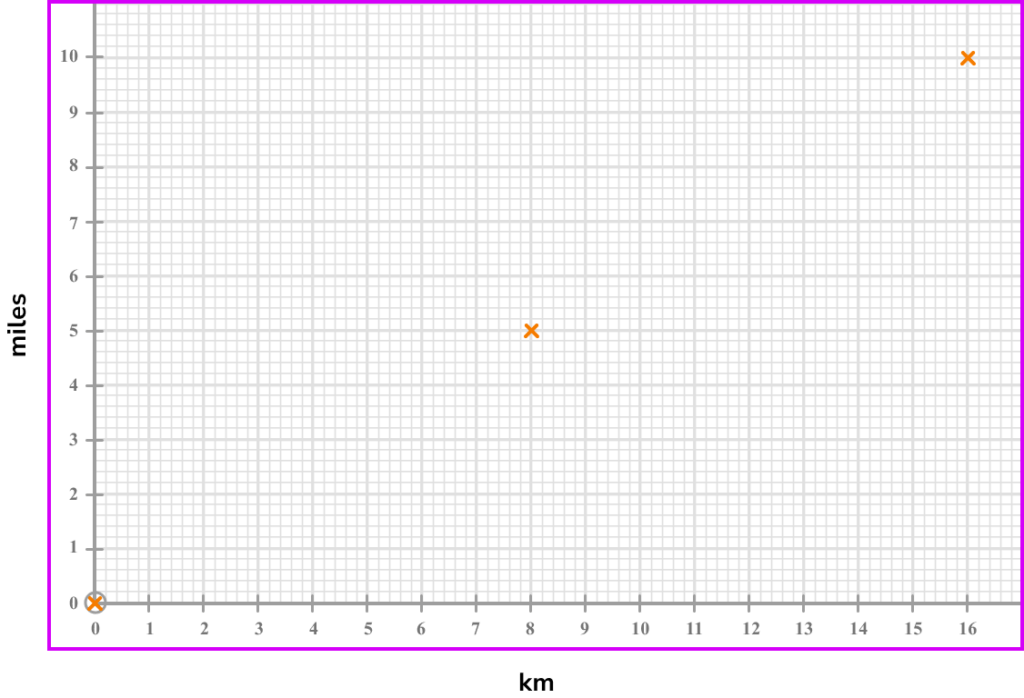
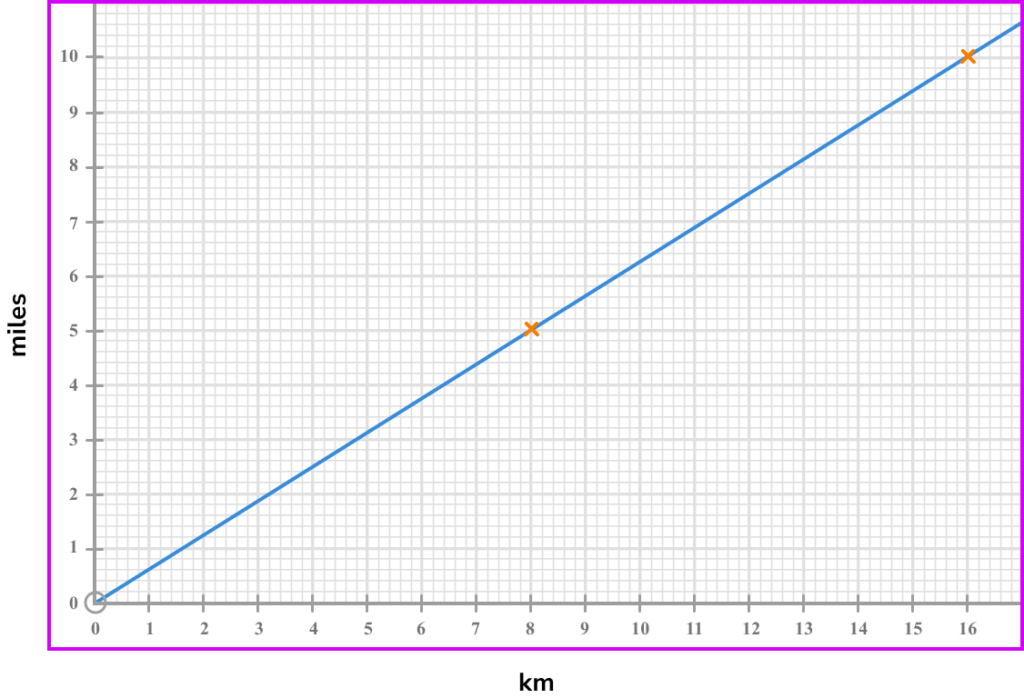
Example 4: drawing a graph to convert kilometres to miles
8 \ km is equivalent to 5 \ miles. Draw a conversion graph for values of 0 \ km to 16 \ km.
We know that 0 \ km = 0 \ miles.
We can use the fact that 8 \ km = 5 \ miles to say that 16 \ km = 10 \ miles.
Let the horizontal axis represent km, and the vertical axis represent miles.
The horizontal axis therefore must go from 0 to 16 and the vertical axis must go from 0 to 10.
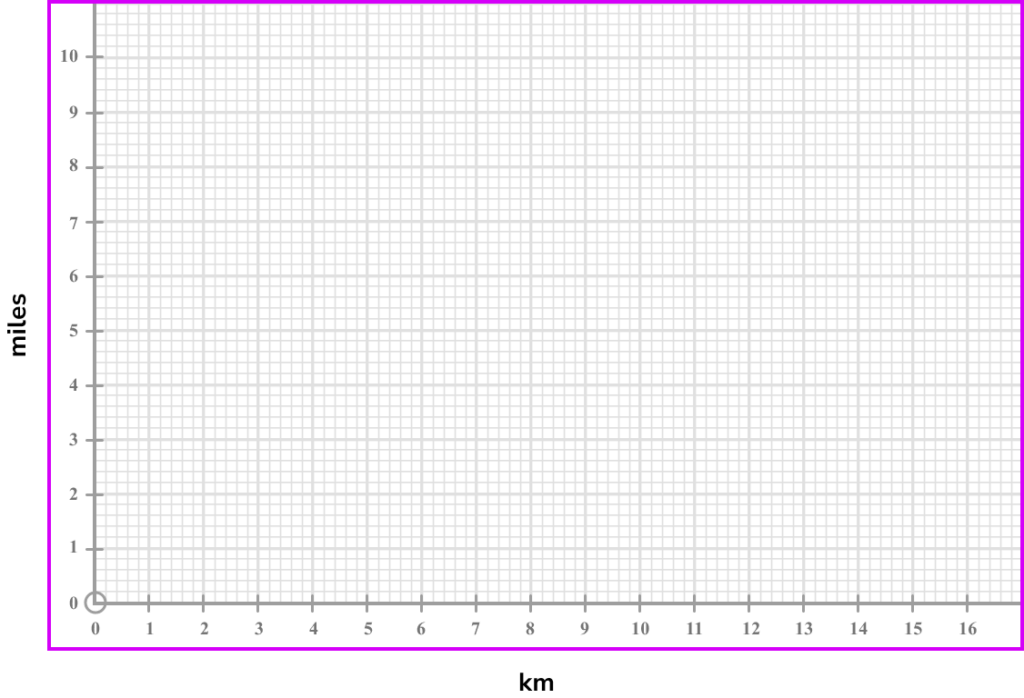
Plot the points (0,0), (8,5) and (16,10) .
Example 5: drawing a graph to convert distance to cost
A taxi company charges a fixed fee of £5 plus an extra £1.20 \ per \ mile.
Use this information to draw a conversion graph for distance travelled in miles, up to 30 \ miles, and cost of the journey in pounds.
Let the horizontal axis represent the distance in miles and the vertical axis represent the cost.
A 30 \ mile journey will cost £5 plus 30 \times £1.20 = £41. Therefore the vertical axis could be from 0 to 45.
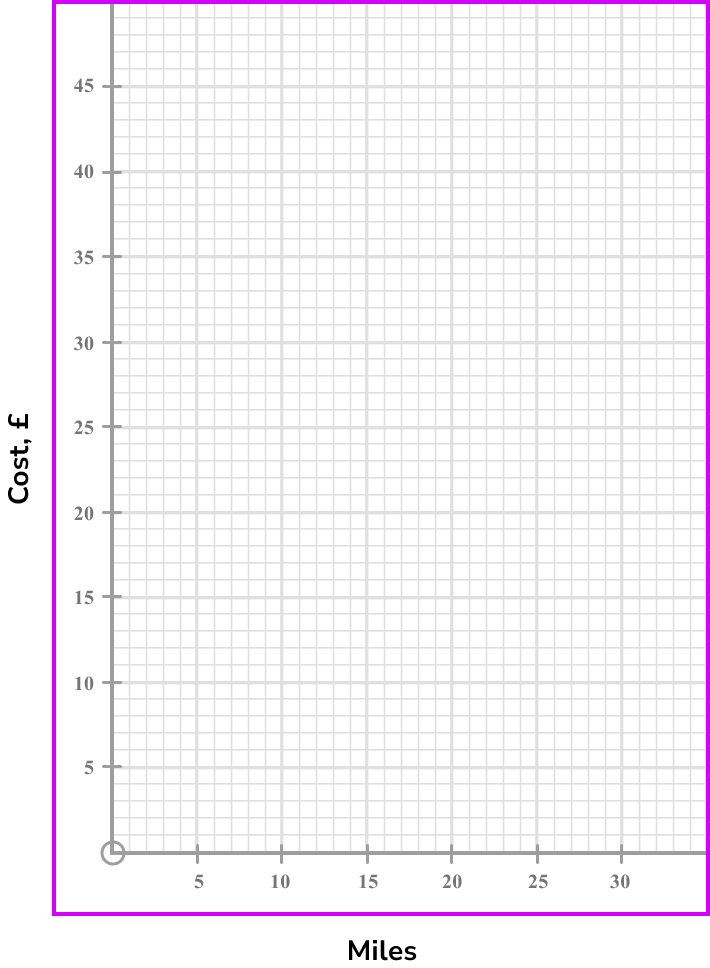
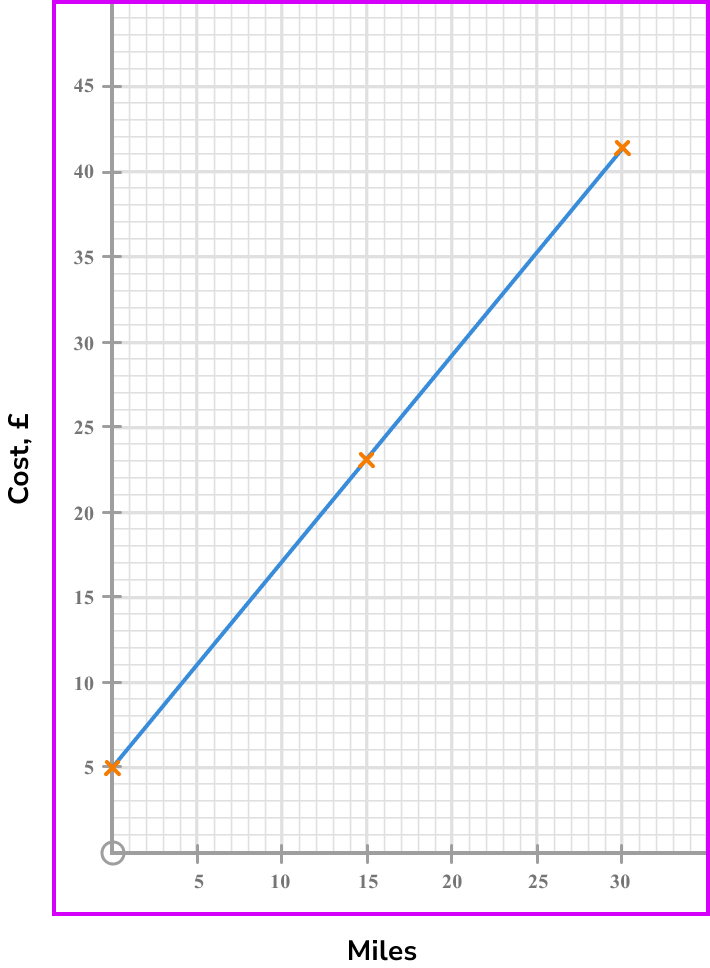
The units are not in direct proportion because the fixed fee of £5 will be plotted as the point (0,5). We also know that 30 \ miles will cost £41 so we need to plot the point (30,41).
For the third point we can work out the cost for 15 \ miles.
15\times 1.20+5=23
So the third point will be (15,23) .

Example 6: drawing a graph to convert currency
The exchange rate for converting Pounds Sterling to Australian Dollars is £1 = \$1.8.
Use this information to plot a conversion graph for Pounds Sterling between 0 and 50.
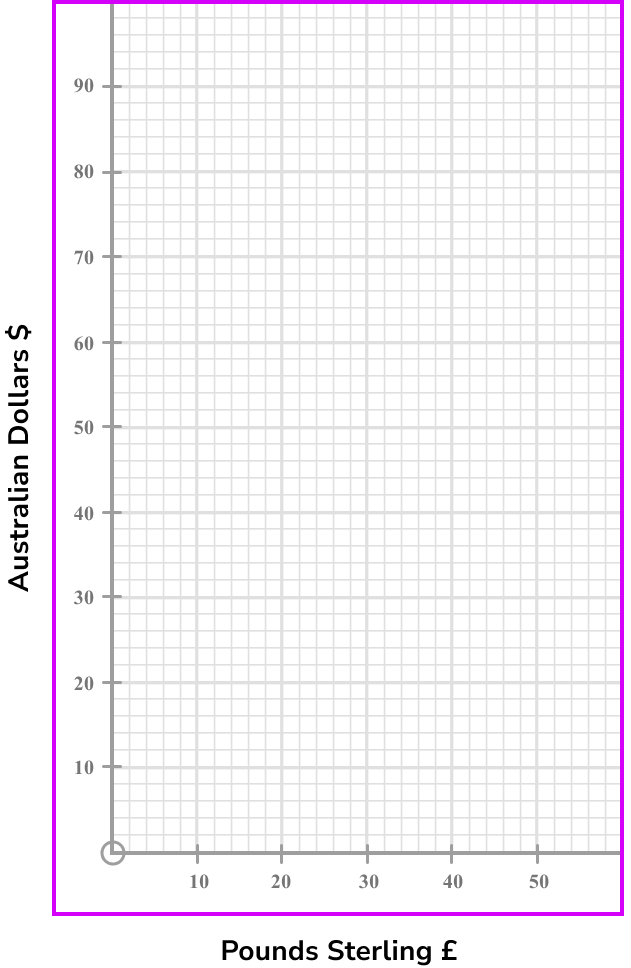
Let Pounds Sterling be represented by the horizontal axis and Australian Dollars be represented by the vertical axis.
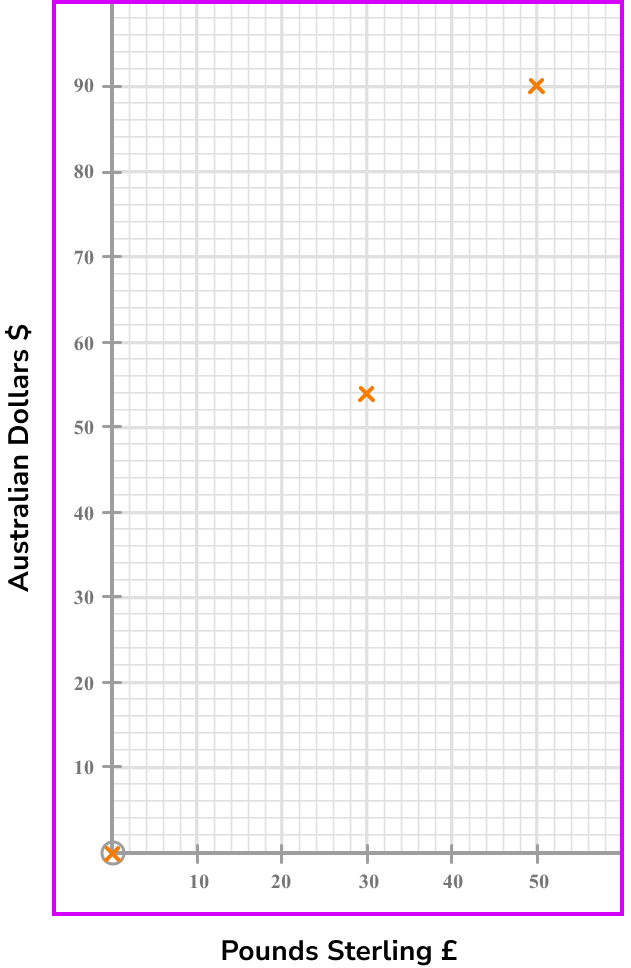
The exchange rate is £1 = \$1.8. As £ is on the horizontal axis, this means the gradient of the line will be 1.8. We can also make a table of values.
| £ | 0 | 30 | 50 |
|---|---|---|---|
| \$ | 0 | 54 | 90 |
The vertical axis must go from 0 to 90.
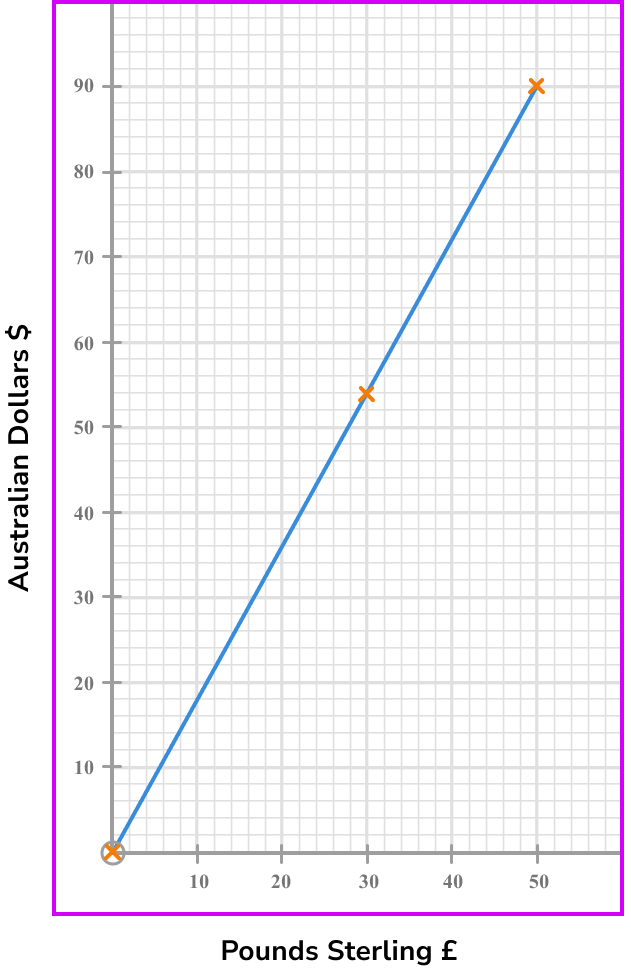
Plot the points from the table.
Common misconceptions
- Using the wrong axis to read off values
A common misconception is to use the wrong axis when converting. It is important to locate the correct axis for the unit being converted and then use the conversion line to read from the axis representing the other unit.
- Extrapolating larger amounts from a conversion graph of units not in direct proportion
Conversion graphs of units that are in direct proportion, such as currencies or units to measure mass, length and capacity, can be used to extrapolate larger conversions.
For example,
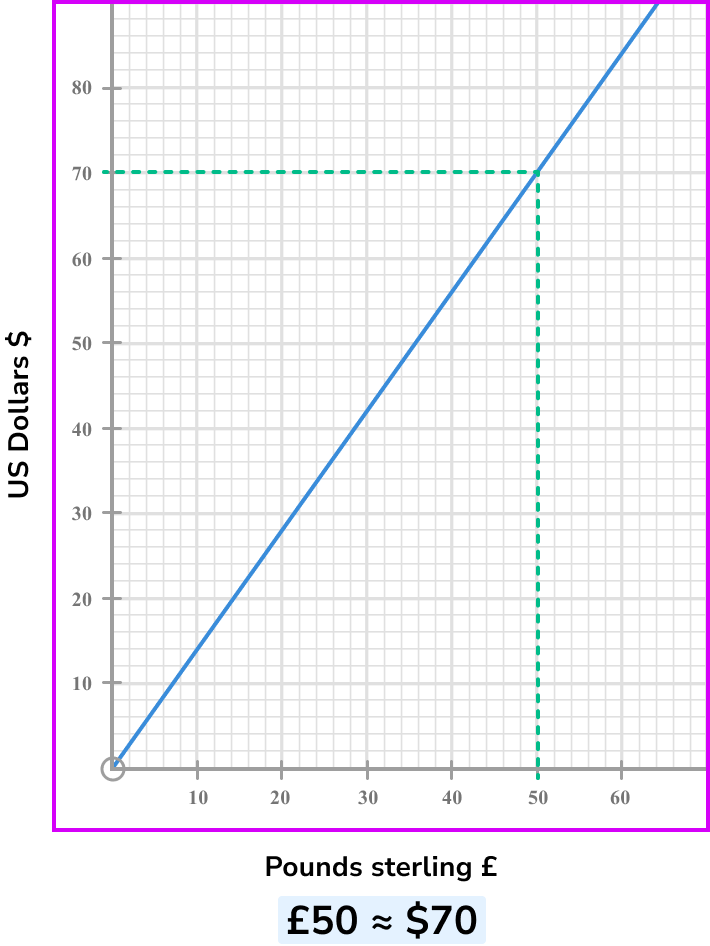
We know £50 is approximately \$70, therefore, £500 is approximately \$700.
However, looking at the conversion graph degree Celsius and degrees Fahrenheit, we can see extrapolation using multiples will not work.
Doubling the value in ^{o}C does not double the value in ^{o}F.
- Extrapolating inaccurately
When extrapolating, try as large a value as possible. This will help your value be as accurate as you can. For small values, an error can make your estimate inaccurate.
Practice conversion graphs questions
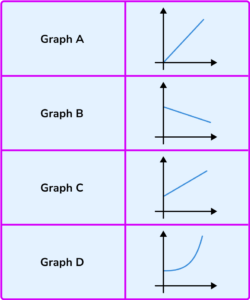
1. 1 stone is approximately equal to 6.25 \ kg. Which of the conversion graphs shows the correct conversion between stones and kilograms?


0 stones would be 0 \ kg, so a point on the graph would be (0,0) .
4 stones would be,
4\times 6.25=25 .
So a point on the graph would be (4,25) .
8 stones would be,
8\times 6.25=50 .
So a point on the graph would be (8,50) .
2. A taxi firm charges a fixed fee of £6 and then an additional fee of £1 per mile. Which of the following graphs shows a possible conversion between distance and cost of a journey?


The fixed fee is £6, so a point on the graph would be (0,6) .
A journey of 10 miles would cost,
10\times 1+6=16 .
So a point on the graph would be (10,16) .
A journey of 20 miles would cost,
20\times 1+6=26 .
So another point on the graph would be (20,26).
3. The graph shows the conversion between kilometres and miles.
Use the graph to estimate the number of miles equivalent to 6 \ km.

Draw a vertical line from the horizontal axis at 6 \ km until it reaches the conversion line, then draw a horizontal line to the vertical axis and read from the scale.

4. An electricity supplier charges a fixed fee and an additional price per unit of electricity used.
The graph shows the conversion between electricity units used and the cost in £. What is the fixed fee?

The fixed fee is the cost for zero units of electricity used and is the value where the line crosses the vertical axis.
5. An electricity supplier charges a fixed fee and an additional price per unit of electricity used.
The graph shows the conversion between electricity units used and the cost in £. Estimate the number of units used by a family with an electricity bill of £34.

460 units
800 units
120 units
600 units
Draw a horizontal line from the vertical axis at £34 until it reaches the conversion line, then draw a vertical line to the horizontal axis and read from the scale.
6. The graph shows the conversion between Pounds Sterling and US Dollars. Use the graph to convert £140 to \$.

Use a factor of 140 that can be found on the horizontal axis. Read off the conversion from the vertical axis and multiply by the required multiple. So, we could find the value for £35 and scale up.
£35=\$50
So, 4 \times \$50= \$200

Conversion graphs GCSE questions
1. A taxi firm charges a fixed fee of £5 and then an additional fee of £1.50 \ per \ mile.
Which of the following graphs shows a possible conversion between distance and cost of a journey?
(1 mark)
Graph C
(1)
2. The graph shows the conversion between pints and litres.

(a) Use the graph to estimate the number of litres equivalent to 14 \ pints .
(b) Use the graph to estimate the number of pints equivalent to 12 \ litres.
(c) A bath can hold 70 \ litres of water. Estimate the number of pints equivalent to 70 \ litres.
(4 marks)
(a) 8
(1)
(b) 21
(1)
(c) Using an appropriate factor of 70 \ litres and converting correctly, eg 10 \ litres = 17.6 pints.
(1)
Answer between 120 and 125 inclusive.
(1)
3. A knot is the speed unit used in sailing. One knot is equivalent to 1.15 \ miles \ per \ hour.
(a) Use the information above and the axes provided to draw a conversion graph for knots and miles \ per \ hour.

(b) Use your line to convert 25 \ miles \ per \ hour to knots. Give your answer to the nearest integer.
(3 marks)
(a)

A correct point plotted, eg (10,11.5) .
(1)
Correct line.
(1)
(b) 22 \ knots
(1)
4. The graphs show the conversion between Pound Sterling and US Dollars and US Dollars to South African Rand.

(a) John wishes to buy a camera. He can buy it in the UK for £360 or order it from South Africa for 6000 Rand including postage.
Is it cheaper to buy the camera in the UK or order it from South Africa?
(b) Convert 400 South Rand to Pound Sterling.
(6 marks)
(a)
Writes a conversion for £ and \$, for example £50=\$72 .
(1)
Converts £360 to \$520 (approximately).
(1)
Uses the graph to convert 6000 Rand to \$500 (approximately).
(1)
States that camera is cheaper if ordered from South Africa.
(1)
(b)
Converts 400 Rand to \$33-\$34 .
(1)
Converts their amount of \$ to £22-£25 .
(1)
Learning checklist
You have now learned how to:
The next lessons are
Still stuck?
Prepare your KS4 students for maths GCSEs success with Third Space Learning. Weekly online one to one GCSE maths revision lessons delivered by expert maths tutors.

Find out more about our GCSE maths tuition programme.