
What Is A Venn Diagram: Explained For Primary School Teachers, Parents And Children
In this post we will be explaining what venn diagrams are, how they can be used and what your child will be learning about them throughout primary school. We’ve also included a number of venn diagram based questions to test your child’s skills, so take a look!
What is a venn diagram?
A Venn diagram (named after mathematician John Venn in 1880) is a method used to sort items into groups.
Venn diagrams explained: How to interpret them
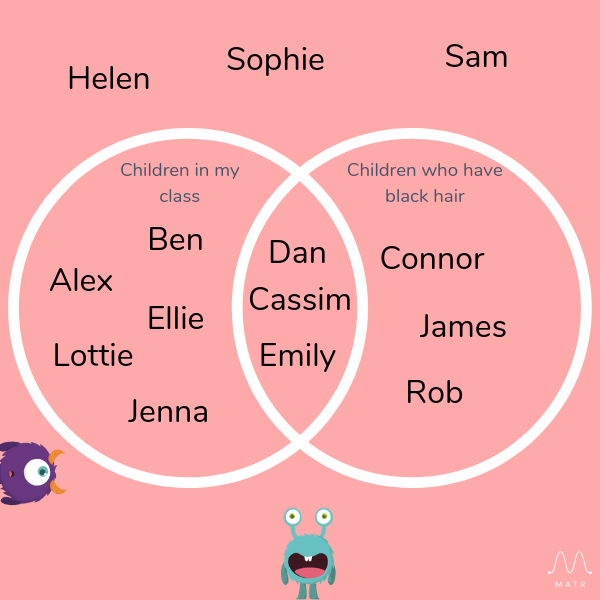
These diagrams are usually presented as two or three circles overlapping, with the overlapping sections containing items that fit into both (or all, if three circles overlap) groups. Items which don’t belong to either/any group are placed on the outside of the circles.
An example of a simple venn diagram:
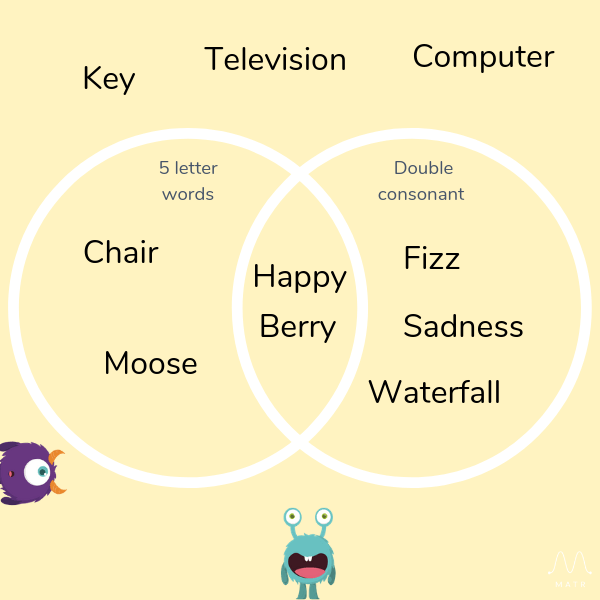
In the example above, you can see that the words have been sorted into one of four categories: those with 5 letters (placed in the left circle), those with a double consonant (placed in the right circle), those with both 5 letters and a double consonant (placed in the centre overlap) and those with neither (placed round the edge).
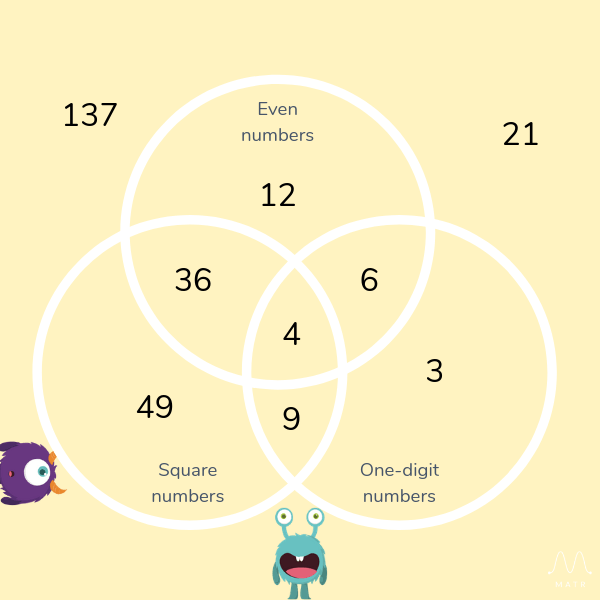
Below is another example with three circles creating eight groups.

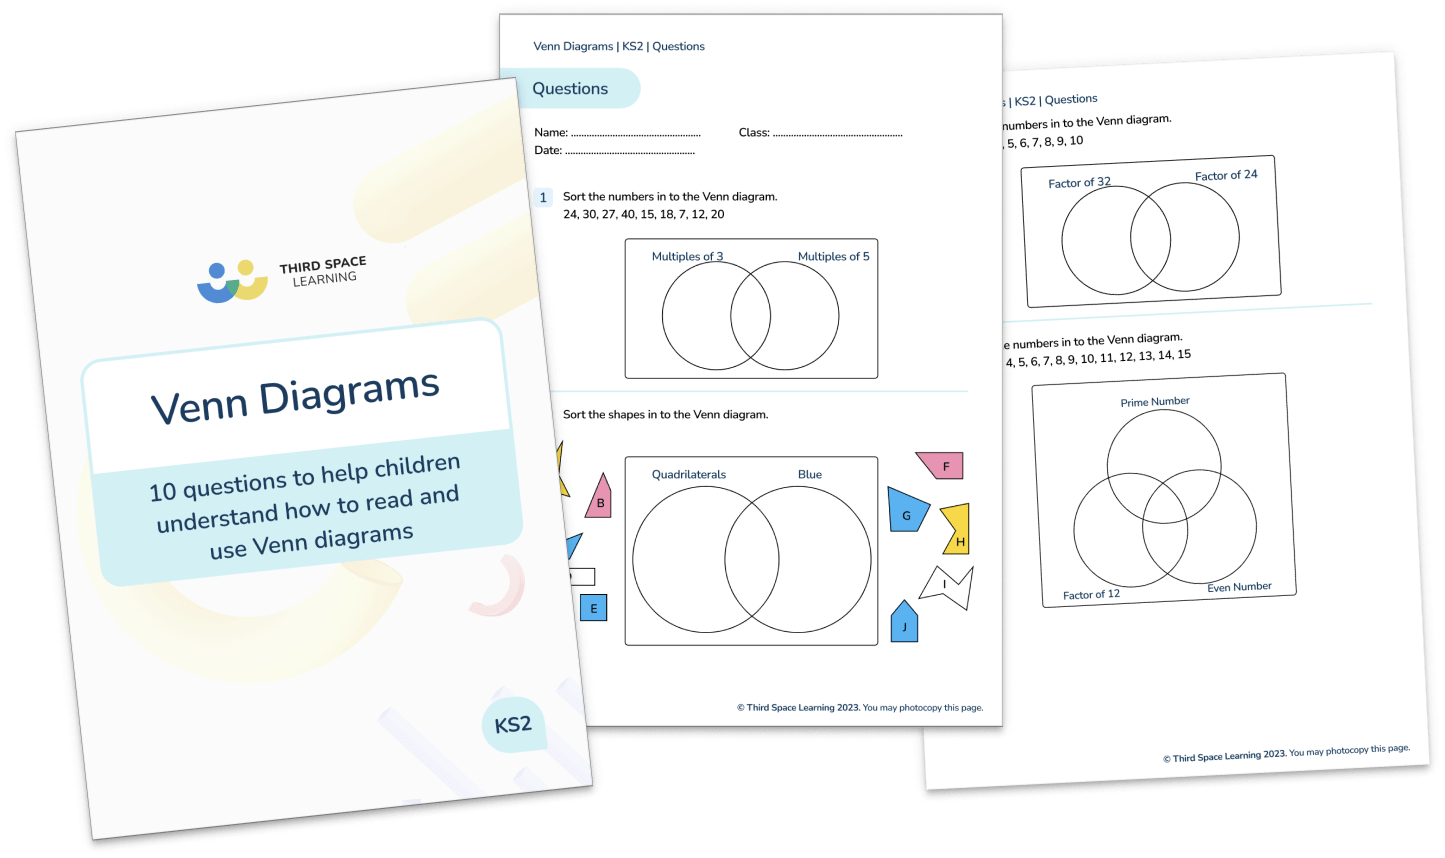
Venn Diagram Worksheet For KS2
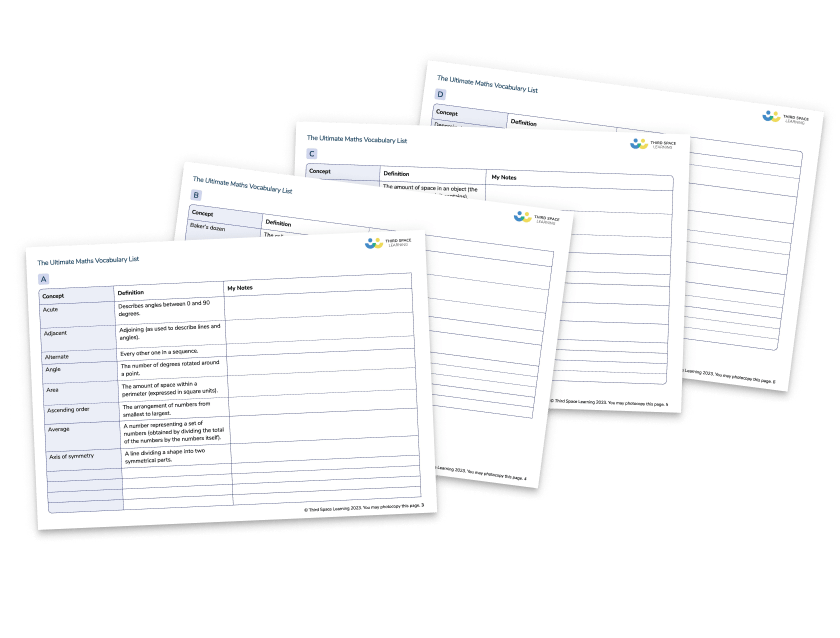
Download these 10 questions to help children understand how to read and use Venn diagrams. Includes answers.
Download Free Now!When will my child learn about Venn diagrams?
Venn diagrams don’t officially appear in the National Curriculum until Key Stage 3 (secondary school), but your child could be introduced to them from as early as Year 2 as a method of interpreting or presenting data.
Because Venn diagrams require children to sort and classify information, they draw on skills developed across several areas of maths. Primary school tuition can help reinforce these cross-topic connections so children feel confident when data handling appears in the classroom.
Meet Skye, the spoken AI tutor making maths success possible for every student.
Built by teachers and maths experts, Skye uses the same pedagogy, curriculum and lesson structure as our traditional tutoring.
But, with more flexibility and a lower cost, schools can scale online maths tutoring to support every student who needs it.
Watch Skye in actionWondering about how to explain other key maths vocabulary to your children? Check out our Primary Maths Dictionary, or try these other maths terms:
- What Is The Perimeter?
- What Is BODMAS (and BIDMAS)?
- Properties Of Shapes
- What Are 2D Shapes?
- What Are 3D Shapes?
- What Is A Carroll Diagram?
Venn diagram examples
To help your child understand the different ways in which a venn diagram can be used, here is a variety of diagrams that they may come across.
If pupils find it difficult to decide where numbers or items belong in overlapping groups, one to one tuition gives them the space to talk through their reasoning without the pressure of a whole-class setting.
Number venn diagram examples
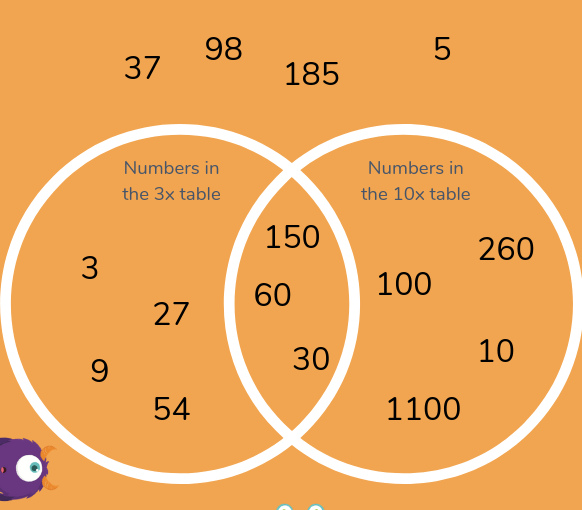
An example of a venn diagram which includes the 3x table and 10x table.
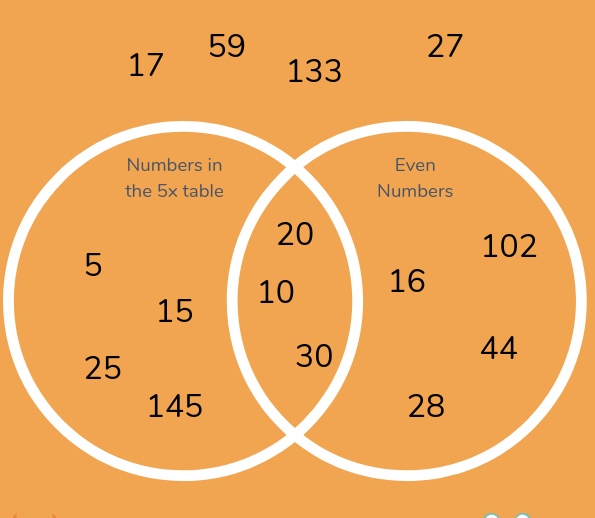
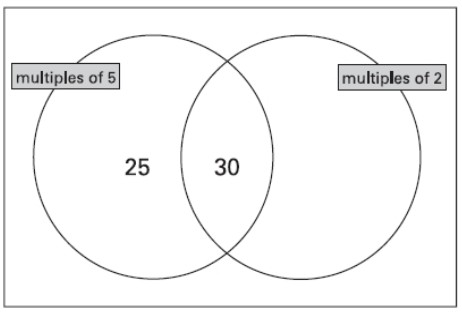
An example of a venn diagram including the 5x table and even numbers.
Word venn diagram examples
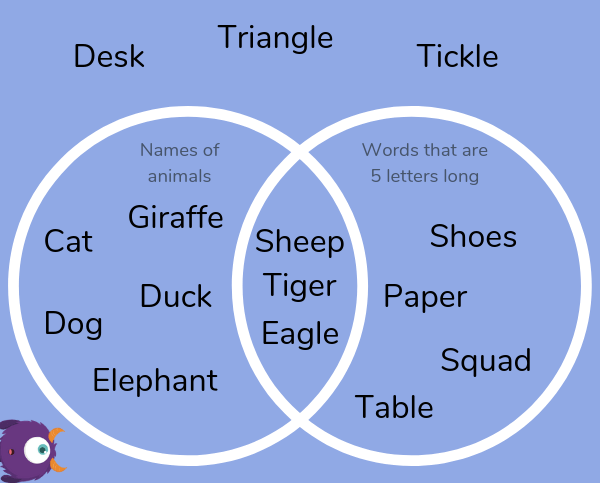
Venn diagram for kids
Venn diagram practice questions
1) Year 2: Write each of these numbers in its correct place on the sorting diagram: 40, 8 and 15
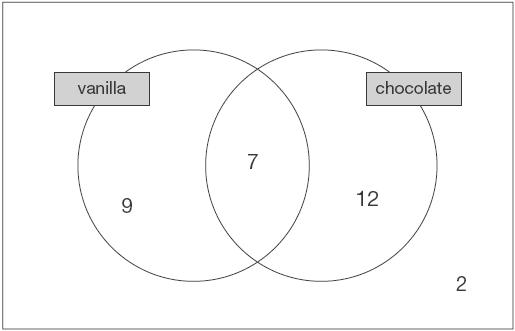
2) Year 3/4: Joe asked the children in his class which flavours of ice-cream they like. He recorded the results in a Venn diagram. How many children like chocolate ice-cream? How many children do not like vanilla ice-cream?
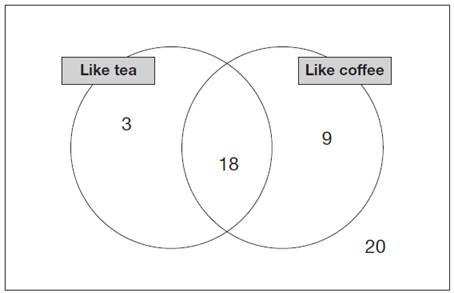
3) Year 6: In a survey people were asked if they like tea and coffee. The results are in this Venn diagram. What percentage of people in the survey like both tea and coffee? What percentage of people in the survey do not like coffee?
For children who struggle with these kind of questions the AI tutor provides a safe and confidence boosting environment to practise.
DO YOU HAVE STUDENTS WHO NEED MORE SUPPORT IN MATHS?
Skye – our AI maths tutor built by teachers – gives students personalised one-to-one lessons that address learning gaps and build confidence.
Since 2013 we’ve taught over 2 million hours of maths lessons to more than 170,000 students to help them become fluent, able mathematicians.
Explore our AI maths tutoring or find out about a primary school maths tutor for your school.