

What Is A Carroll Diagram? Explained for Primary School Parents & Teachers
Here you can find out what a Carroll diagram is, why they are called Carroll diagrams and how you can help children to understand a Carroll diagram as part of their maths learning at home.
A common activity for students to do from Reception onwards is to group or classify objects around the classroom. While there are various ways that items and objects can be classified and grouped, one common way in which this might be done is through the use of a Carroll diagram. Students can also carry out data handling using a Venn diagram.
What is a Carroll diagram?
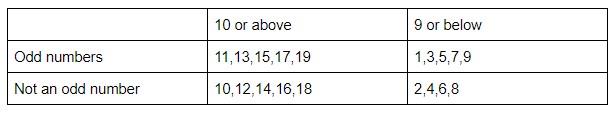
A Carroll diagram is a way to sort data, such as a group of objects, shapes or numbers, based on given properties or traits in a yes/no fashion. It is named after the author of Alice in Wonderland, Lewis Carroll, and is sometimes known as Carroll’s square. An example of a Carroll diagram can be seen below.
It is imperative that the attributes provided in the heading are absolute and can be answered in a ‘closed’ manner so a definite answer is attainable.
Carroll diagram examples KS1
In Key Stage 1, students may use a Carroll diagram to support their learning in geometry. Across Year 1 and 2, they will be expected to learn:
1. Geometry – properties of shapes
Pupils should be taught to recognise and name common 2-D and 3-D shapes, including:
- 2-D shapes, for example, quadrilaterals (rectangles, including squares), circles and triangles;
- 3-D shapes, for example, cuboids (including cubes), pyramids and spheres;
- Identify and describe the properties of 2-D shapes, including the number of sides, and line of symmetry in a vertical line;
- Identify and describe the properties of 3-D shapes, including the number of edges, vertices and number of faces;
- Identify 2-D shapes on the surface of 3-D shapes, for example, a circle on a cylinder and a triangle on a pyramid;
- Compare and sort common 2-D and 3-D shapes and everyday objects.
The parts in bold are objectives that lend themselves to a Carroll diagram being used. In the early stages of learning to use a Carroll diagram, the teacher should provide the students with the criteria they need to sort the shapes, objects or numbers. As they grow confident in using their diagram, students can start to make their own criteria through which to sort things.
Meet Skye, the voice-based AI tutor making maths success possible for every student.
Built by teachers and maths experts, Skye uses the same pedagogy, curriculum and lesson structure as our traditional tutoring.
But, with more flexibility and a lower cost, schools can scale online maths tutoring to support every student who needs it.
Watch Skye in actionCarroll diagram examples KS2
In Key Stage 2 (Year 3-6), students may use Carroll diagrams for sorting numbers and looking at patterns within numbers when learning their times tables or learning about prime numbers.


Join the Third Space Learning Maths Hub
Discover our collection of free and premium educational resources, such as printable worksheets and PowerPoints, in the Third Space Learning Maths Hub! Registering is quick, easy and free! (Please use Google Chrome to access the Maths Hub)
Download Free Now!When do children learn about a Carroll diagram in school?
In primary school, a Carroll diagram is often used to cover the geometry parts of the maths curriculum. Theoretically, they can also be used throughout different subjects wherever a comparison within a set wants to be made. Science is the most common foundation subject where they are likely to be used to support classification of animals. That being said, there is no requirement that they must be used in the national curriculum.
How does a Carroll diagram relate to other areas of maths?
Carroll diagrams do not belong to one ‘area’ of mathematics. They are tools in which classifications and grouping can take place and patterns can be seen clearly. Common areas of mathematics that lend themselves to such activities, where a Carroll diagram may be used, include the following:
- Looking at prime or composite numbers;
- Looking at numbers that are odd or even;
- Looking at different multiplication tables and if numbers within the tables are prime/composite or odd/even;
- To group different shapes by certain criteria.
Carroll diagram worked examples KS1
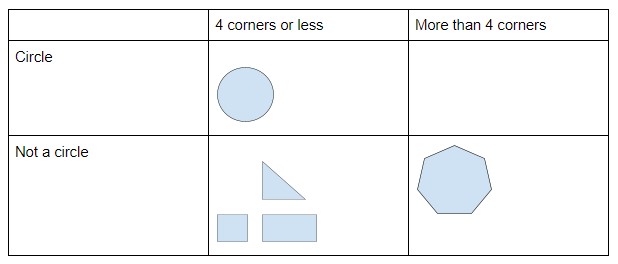
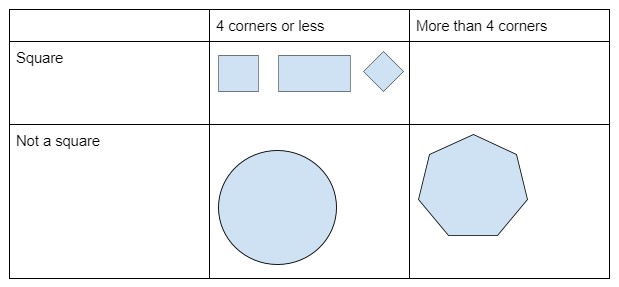
Place these shapes into the Carroll diagram.
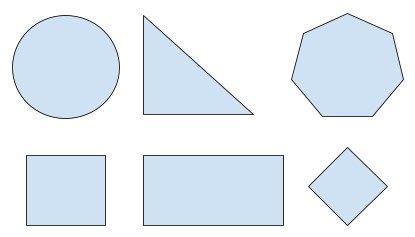
We can start by looking at the first shape, which is a circle. As one of the criteria is whether the shape is a circle or not, we can safely say that the circle will go into the top row of the template. We then need to use our knowledge of shape to know that the circle has less than four corners. It belongs in the top left section.
All the other shapes are not circles, so we know that they will belong in the second row. As the first column looks at shapes with 4 corners or less, any shape that fits this criteria will go into the bottom left section. That would be the right-angled triangle, both squares and the rectangle.
The only remaining shape, the heptagon, has 7 corners and so would go into the bottom right section.
Carroll diagram worked examples KS2
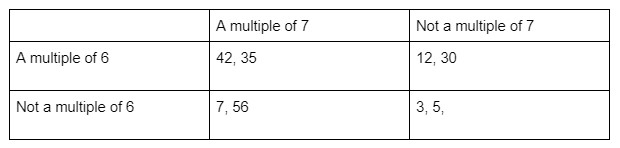
Place these numbers into the Carroll diagram.
3, 5, 7, 12, 30, 35, 42, 56
The same process can be applied here. From the given numbers, make a list of those that are multiples of 6, 7 and the numbers that are not either multiplication table.
| 7 | 12 | 3 |
| 42 | 30 | 5 |
| 56 | 42 | 35 |
From here, we can systematically go through the list of numbers to discern where it belongs.
7 is a multiple of 7 but not of 6 and so it belongs in the bottom left.
12 is a multiple of 6 but not of 7 so belongs in the top right.
3 is not a multiple of 7 or 6 and so belongs in the bottom right.
42 is a common factor of both 6 and 7 and therefore belongs in the top left section.
This process then needs to be repeated until all the numbers have been placed into the diagram.
Carroll diagram questions
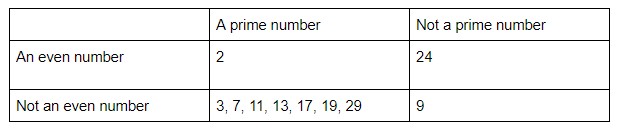
1. Place these numbers into the Carroll diagram.
2, 3, 7, 9, 11, 13, 17, 19, 21, 24, 29
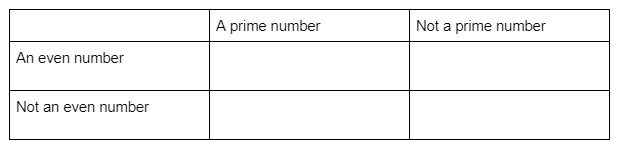
This task is particularly useful for students to see that odd numbers can also be non-prime.
Answer:
2. Place these shapes into the Carroll diagram.
Answer:
A Carroll diagram is a way to sort data by grouping shapes, numbers or objects by traits in a yes/no way.
A Carroll diagram is used to separate and sort data into criteria. A Venn diagram looks at the relationship between sets of data.
A Carroll diagram in maths is used to sort objects or shapes by their traits.
Wondering about how to explain other key maths vocabulary to your children? Check out our Primary Maths Dictionary, or try these other terms related to a Carroll diagram:
Read more:
DO YOU HAVE STUDENTS WHO NEED MORE SUPPORT IN MATHS?
Skye – our AI maths tutor built by teachers – gives students personalised one-to-one lessons that address learning gaps and build confidence.
Since 2013 we’ve taught over 2 million hours of maths lessons to more than 170,000 students to help them become fluent, able mathematicians.
Explore our AI maths tutoring or find out about a primary school maths tutor for your school.