FREE DOWNLOAD
Pie Chart Worksheets
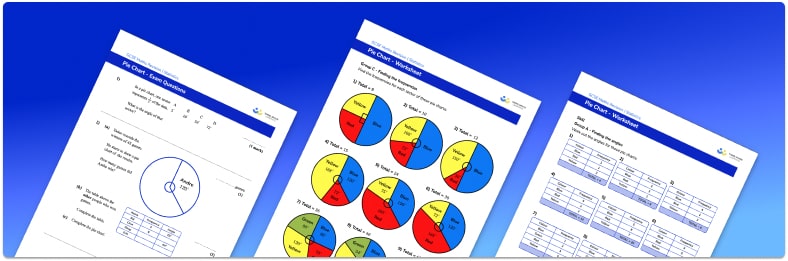
Help your students prepare for their Maths GCSE with this free pie chart worksheet of 25 questions and answers
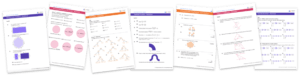
- Section 1 of the pie chart worksheet contains 18 skills-based pie chart questions, in 3 groups to support differentiation
- Section 2 contains 4 applied pie chart questions with a mix of worded problems and deeper problem solving questions
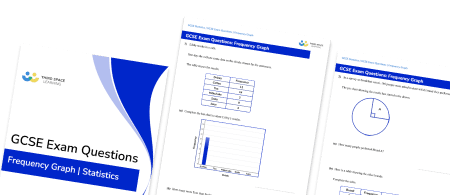
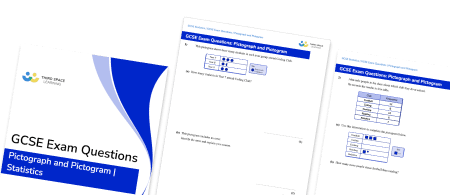
- Section 3 contains 3 foundation and higher level GCSE exam style questions on pie charts
- Answers and a mark scheme for all pie chart questions are provided
- Questions follow variation theory with plenty of opportunities for students to work independently at their own level
- All questions created by fully qualified expert secondary maths teachers
- Suitable for GCSE maths revision for AQA, OCR and Edexcel exam boards
Unlock access to download your free resource
You can unsubscribe at any time (each email we send will contain an easy way to unsubscribe). To find out more about how we use your data, see our privacy policy.
Raise maths attainment across your school with hundreds of flexible and easy to use GCSE maths worksheets and lessons designed by teachers for teachers.
Pie chart at a glance
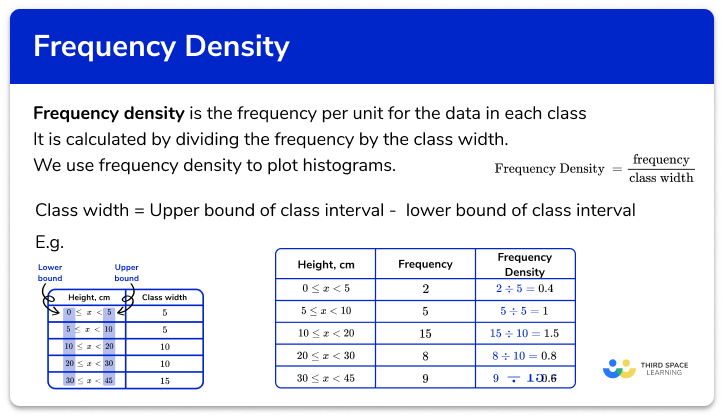
Pie charts (sometimes called circle graphs) are a type of frequency diagram used to display categorical data, for example, the favourite foods or holiday destinations of a number of students.
The first step when drawing a pie chart is to use a pair of compasses to construct a circle, and draw a vertical line from the centre to the circumference – this is where we measure the first angle from.
Next, we calculate the angle size for each category – this links with prior knowledge of proportional reasoning, percentages and decimals.
For example, suppose in a class of 30 students, 12 students chose Spain as their favourite holiday destination. As a fraction, this is 12 over 20 which simplifies to 2 over 5. Next, we need to work out 2 fifths of 360, which is 144. This means we need to measure an angle of 144° from the vertical line, using a protractor. We then proceed to do the same for the other categories until the pie chart is complete.
When interpreting data, it is important that students can work backwards to measure the angle and find the proportion represented by each angle – this is particularly useful when comparing two pie charts.
Looking forward, students can then progress to additional Statistics worksheets, for example a frequency polygon worksheet or histogram worksheet.
For more teaching and learning support on Statistics our GCSE maths lessons provide step by step support for all GCSE maths concepts.
Do you have GCSE students who need additional support?
There will be students in your class who require individual attention to help them achieve their target GCSE maths grade. In a class of 30, it’s not always easy to provide.
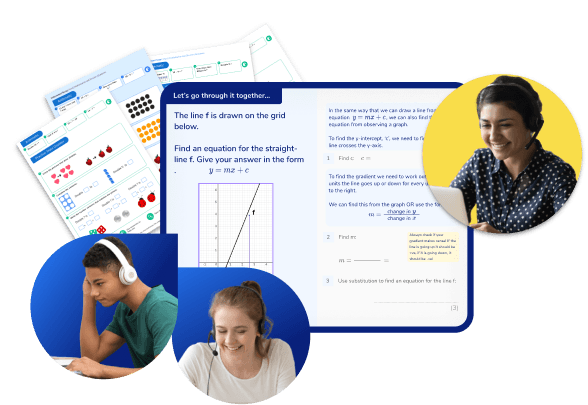
Help your students feel confident with exam-style questions and the strategies they’ll need to answer them correctly with personalised online one to one tutoring from Third Space Learning
Lessons are selected to provide support where each student needs it most, and specially-trained GCSE maths tutors adapt the pitch and pace of each lesson. This ensures a personalised revision programme that raises grades and boosts confidence.