GCSE Tutoring Programme
Our chosen students improved 1.19 of a grade on average - 0.45 more than those who didn't have the tutoring.
In order to access this I need to be confident with:
Adding and subtracting fractions Adding and subtracting decimals Systematic listing strategiesThis topic is relevant for:

Probability Scale
Here we will learn about the probability scale, including placing the chance of events happening on a probability scale, calculating the chance of events happening and calculating the chance of events not happening.
You can also download the following free probability scale resources all suitable for those following Edexcel, AQA or OCR exam boards:
What is the probability scale?
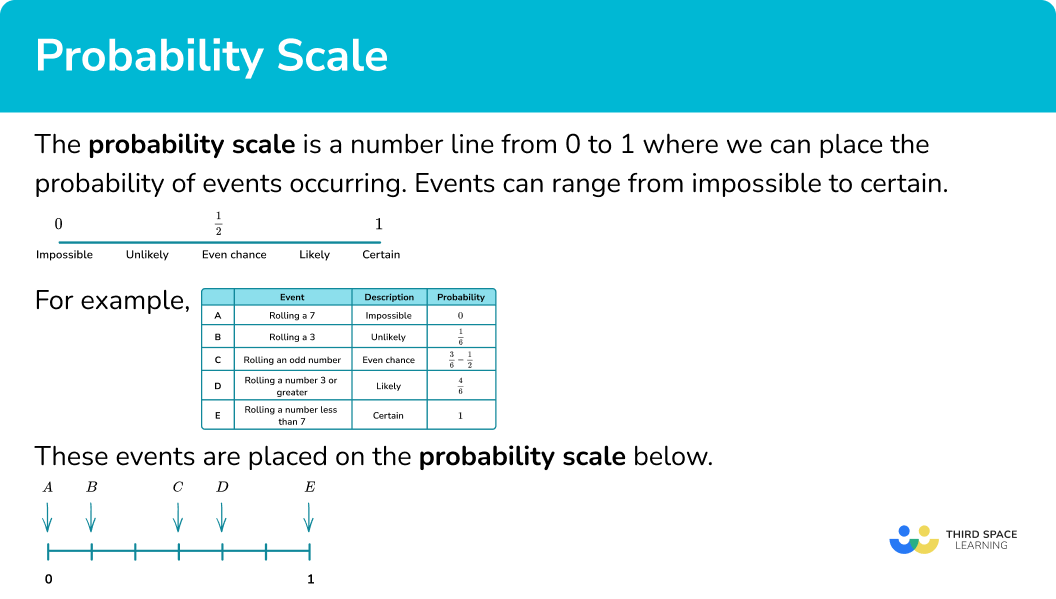
The probability scale is a number line from 0 to 1 where we can place the probability of events occurring. Events can range from impossible to certain.
To do this we need to be able to identify decimals and fractions on the number line from 0 to 1 and calculate the probability of events happening or not happening.

For example, let’s look at the probabilities of a few possible outcomes when a fair 6 sided dice is rolled.
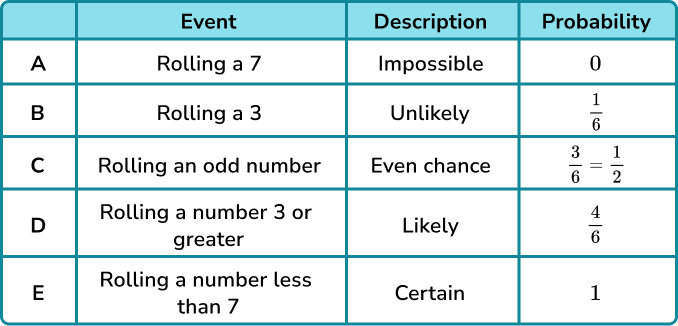
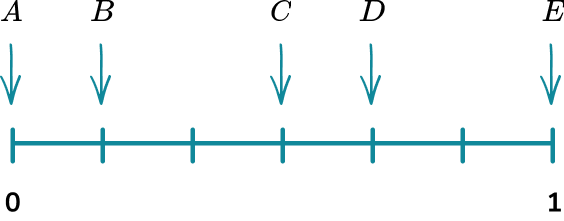
These events are placed on the probability scale below.
What is the probability scale?
Understanding the probability scale
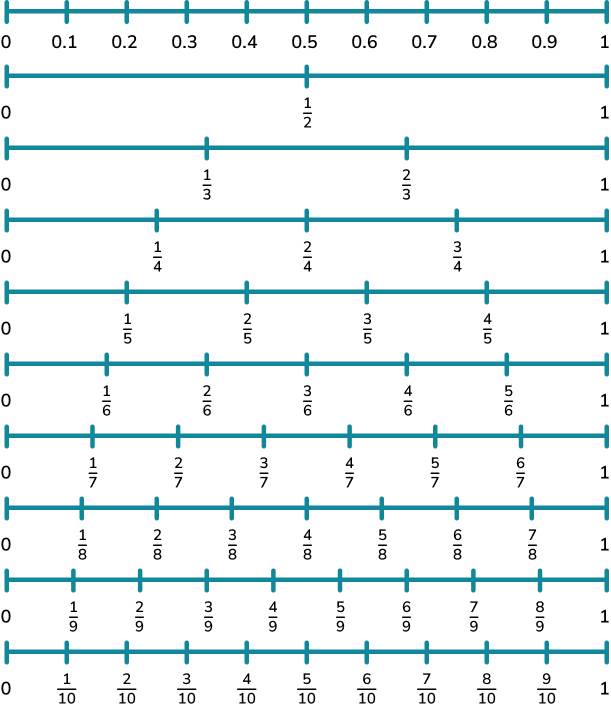
To understand the probability scale, you must be familiar with the positions of fractions and decimals on a number line between 0 and 1.
Here is the 0 to 1 number line split into decimals and fractions.
An event which is impossible would be positioned at 0.
An event which is certain would be positioned at 1.
An event with an even chance of occurring or not occurring would be positioned at \frac{1}{2} .
Events where different fractions, decimals or percentages can be used to describe the probability can be positioned onto the probability scale.
How to use a probability scale
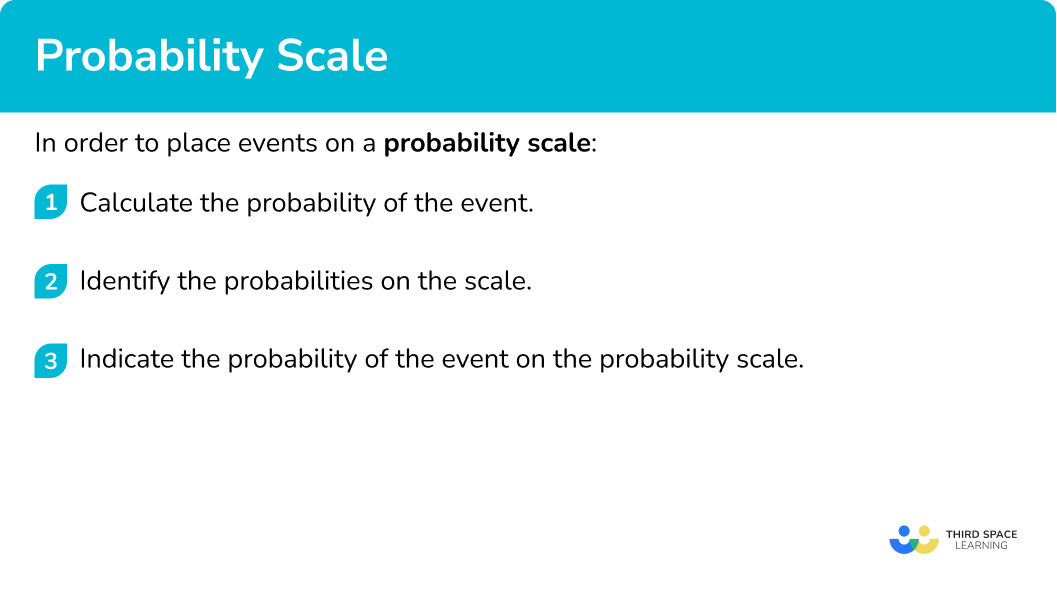
In order to place events on a probability scale:
- Calculate the probability of the event.
- Identify the probabilities on the scale.
- Indicate the probability of the event on the probability scale.
Explain how to use a probability scale
Probability scale worksheet
Get your free probability scale worksheet of 20+ questions and answers. Includes reasoning and applied questions.
DOWNLOAD FREE Probability scale worksheet
Get your free probability scale worksheet of 20+ questions and answers. Includes reasoning and applied questions.
DOWNLOAD FREERelated lessons on describing probability
Probability scale is part of our series of lessons to support revision on describing probability. You may find it helpful to start with the main describing probability lesson for a summary of what to expect, or use the step by step guides below for further detail on individual topics. Other lessons in this series include:
Probability scale examples
Example 1: probability scale
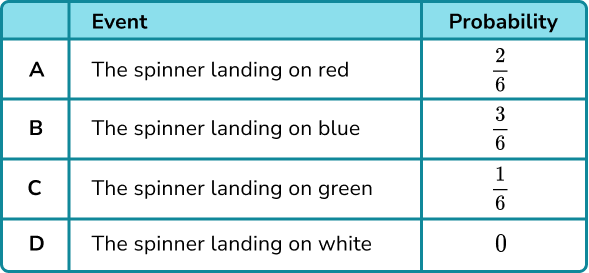
A spinner is shown below. Place the events on the probability scale below.
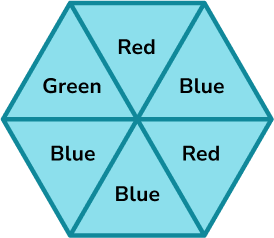

- Calculate the probabilities of the events.
In this example, the probabilities have already been calculated for you.
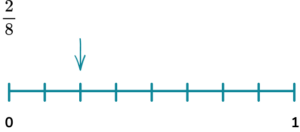
2Identify the probabilities on the scale.
The scale has six divisions so each line represents \frac{1}{6} .
3Indicate the probability of the events on the scale.
Example 2: probability scale
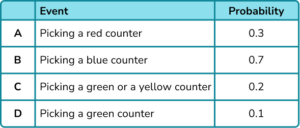
A bag has 10 counters in it. 3 of the counters are red, 4 of the counters are blue, 1 of the counters is green and 2 of the counters are yellow. Place the events on the probability scale below.

In this example, the probabilities have already been calculated for you.
The scale has 10 divisions so each line represents 0.1 .
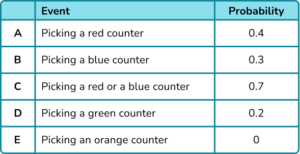
Example 3: calculating probability
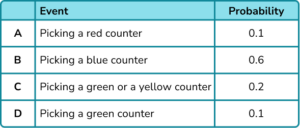
A bag has 10 counters in it. 2 of the counters are red, 6 of the counters are blue, 1 of the counters is green and 1 of the counters is yellow. Place the events on the probability scale below.


In this example, the probabilities have already been calculated for you.
The scale has 10 divisions so each line represents 0.1.
How to calculate the probability of an event happening
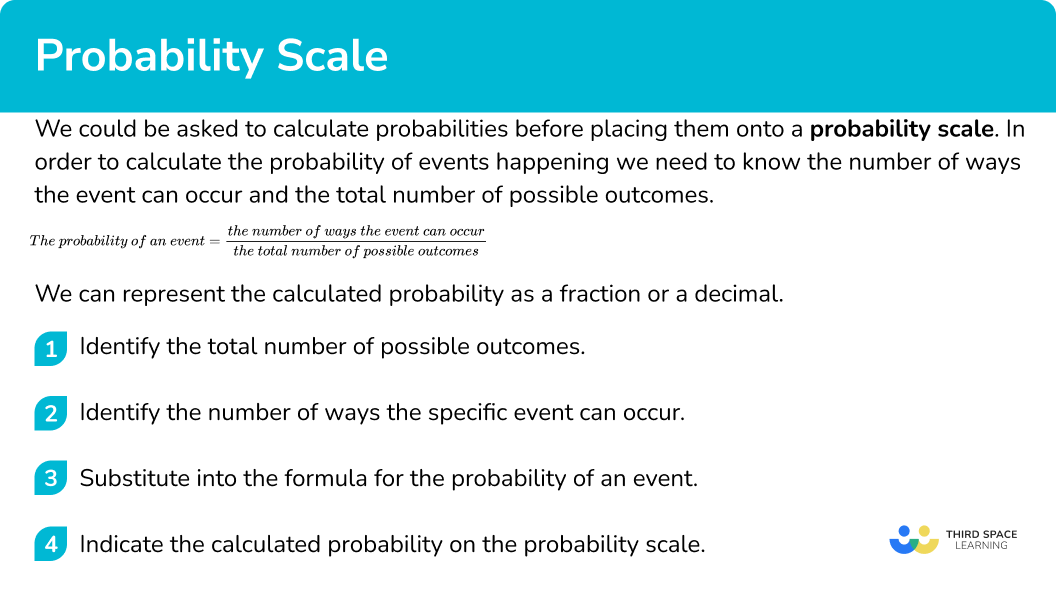
We could be asked to calculate probabilities before placing them onto a probability scale. In order to calculate the probability of events happening we need to know the number of ways the event can occur and the total number of possible outcomes.
\text{The probability of an event} = \frac{\text{the number of ways the event can occur}}{\text{the total number of possible outcomes}}
We can represent the calculated probability as a fraction or a decimal.
- Identify the total number of possible outcomes.
- Identify the number of ways the specific event can occur.
- Substitute into the formula for the probability of an event.
- Indicate the calculated probability on the probability scale.
Explain how to calculate the probability of an event happening
Calculating probability examples
Example 4: calculating probability
A bag contains six blue counters, two red counters, a green counter and a yellow counter.
Represent the probability of picking a blue counter on a probability scale.

There are 10 counters in total.
There are 6 blue counters.
\text { The probability of blue }=\frac{6}{10}=0.6

Example 5: calculating probability
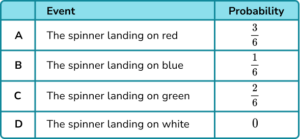
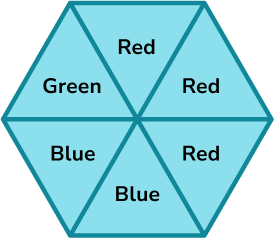
A spinner is shown below. Calculate the probability of the spinner landing on green.
Represent this on a probability scale.

There are six equally likely outcomes on the spinner.
Two of the sections are green.
\text { The probability of green }=\frac{2}{6}

Example 6: probability of an event not happening
A bag contains six blue counters, two red counters, a green counter and a yellow counter.
Represent the probability of not picking a blue counter on a probability scale.

Altogether there are 10 counters which could be picked.
If you do not pick a blue counter, you could pick a yellow counter, a green counter and there are two red counters. There are 4 counters that are not blue.
\text { The probability of not blue }=\frac{4}{10}=0.4

Example 7: probability of an event not happening
A spinner is shown below. Calculate the probability of the spinner not landing on green.
Represent this on a probability scale.

There are six equal sections on the spinner.
Four sections are not green.
\text { The probability of not green }=\frac{4}{6}

Common misconceptions
- Writing probabilities as a ratio or in words
Probabilities must be written as a fraction, decimal or percentage. The chance of rolling a 1 on a fair six-sided dice is \frac{1}{6}. This cannot be written as a ratio, for example 1:6, or in words, for example ‘1 in 6’ or ‘1 out of 6’.
- Probabilities greater than \bf{1}
The chance of all outcomes of an event will always add up to one. Therefore a probability as a decimal cannot be greater than 1 or a fraction cannot be improper. For example 1.4 or \frac{6}{5} cannot be probabilities.
Practice probability scale questions
1. A spinner is shown below. Place the events on the probability scale below.


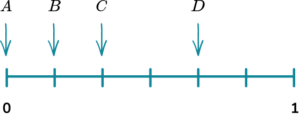

The probability scale has six equally likely outcomes so each line represents one sixth. These are then indicated with arrows and labelled with the correct letter.
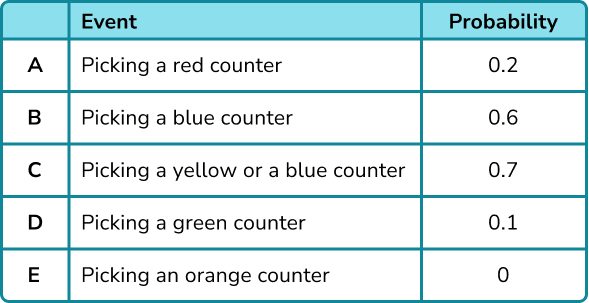
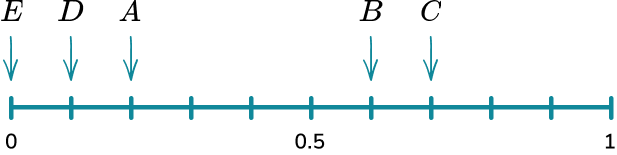
2. A bag has 10 counters in it. 4 of the counters are red, 3 of the counters are blue, 2 of the counters are green and 1 of the counters is yellow. Place the events on the probability scale below.


The probability scale has ten equally likely outcomes so each line represents 0.1. These are then indicated with arrows and labelled with the correct letter.
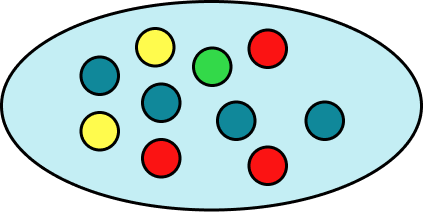
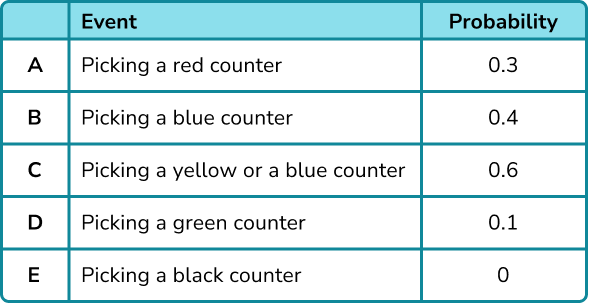
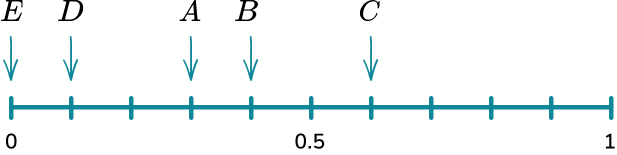
3. A bag has 10 counters in it. 1 of the counters are red, 7 of the counters are blue, 1 of the counters is green and 1 of the counters is yellow. Complete the table of probabilities below and represent the probabilities on a probability scale.

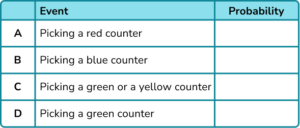
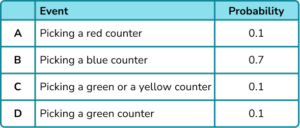


There are ten counters so you can either represent each counter as 0.1 or \frac{1}{10}.
4. A bag contains three blue counters, four red counters, two green counters and a yellow counter. Calculate the probability of picking a red counter. Represent this on a probability scale.


There are ten counters and four of them are red.
4 \div 10 = 0.4
5. A bag contains three blue counters, four red counters, two green counters and a yellow counter. Calculate the probability of picking a green or a yellow counter. Represent this on a probability scale.


There are ten counters in total. Two of them are green and one of them is yellow, so there are three that could be picked,
3 \div 10 = 0.3.
6. A spinner is shown below.
Calculate the probability of the spinner landing on green as a fraction. Represent this on a probability scale.


There are six equal sections and one of them is green,
1 \div 6 = \frac{1}{6}.
7. A bag contains three blue counters, four red counters, two green counters and a yellow counter. Calculate the probability of not picking a green counter. Represent your answer on a probability scale.


There are ten counters and two of them are green, so eight of them are not green,
8 \div 10 = 0.8.
8. A bag contains three blue counters, four red counters, two green counters and a yellow counter. Calculate the probability of not picking a red or a blue counter. Represent this on a probability scale.


There are ten counters in total. Four of them are red and three of them are blue. This means there are 3 counters that are not red or blue,
3 \div 10 = 0.3.
Probability scale GCSE questions
1. An ordinary fair dice is thrown once. On the probability scale mark with a cross (X) the probability that the dice lands on an even number.

(1 mark)

(1)
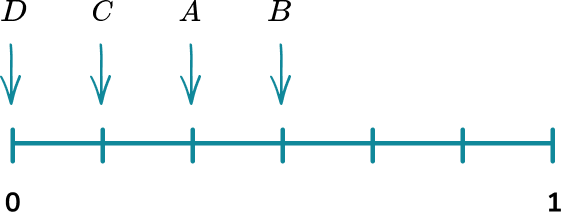
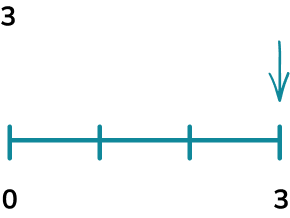
2. (a) A fair spinner has 6 sections. They are labelled 1, \ 2, \ 3 and 5.
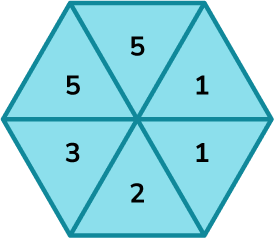
Which arrow shows the probability of the spinner landing on a 5?

(b) Which arrow shows the probability of the spinner landing on an even number?

(2 marks)
(a) C
(1)
(b) B
(1)
3. Stevie spins a fair 4 -sided spinner.
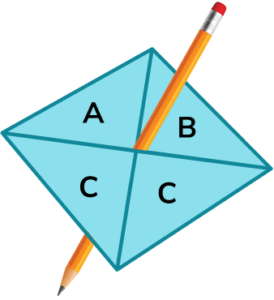
(a) On the probability scale mark with a cross (X) the probability that the spinner lands on A.
(b) Write down the probability that the spinner lands on C.
(2 marks)
(a)

(1)
(b) 0.5 or equivalent
(1)
Learning checklist
You have now learned how to:
The next lessons are
Still stuck?
Prepare your KS4 students for maths GCSEs success with Third Space Learning. Weekly online one to one GCSE maths revision lessons delivered by expert maths tutors.

Find out more about our GCSE maths tuition programme.